2125
In vivo DTI to correlate in ‘real time’ testosterone-induced neural changes to song performance in a seasonal songbird1Bio-Imaging Lab, University of Antwerp, Deurne, Belgium, 2Bio-Imaging Lab, University of Antwerp, Wilrijk, Belgium, 3University of Antwerp, Wilrijk, Belgium, 4Laboratory of Comparative Endocrinology, KU Leuven, Leuven, Belgium
Synopsis
The dynamic relationship between song performance and neuroplasticity induced by testosterone implantation was monitored longitudinally in a seasonal songbird (European starling) by using in vivo DTI. Voxel based analysis showed that the song bout length was positively correlated to the fractional anisotropy changes in different parts of the motor pathway. Meaning that the motor pathway strengthens as song performance advances under the influence of testosterone.
Introduction
Every spring, seasonal songbirds, like European starlings, start to sing more and experience adult neuroplasticity changes of the song control system (SCS). This seasonal neuroplasticity was linked to the increased testosterone (T) levels as their reproductive system matures1. This relation between T, song and neuroplasticity was studied in the past using mostly histological techniques and only started acquiring data after 8-14 days of T treatment2. With this study we want to monitor longitudinally and almost in ‘real-time’ the T-effects on the neuroplasticity and song performance, by using DTI and song recordings within the same animals. This will give insight into the causality between T, song performance and neuroplasticity.Material and methods
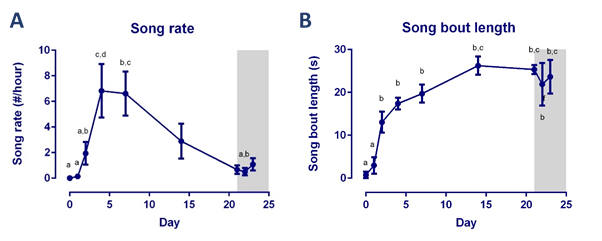
Thirteen female starlings (Sturnus vulgaris) were kept on short days (8L/16D) in order to remain photosensitive. All starlings underwent a baseline scan without T implant (Day 0 or D0). Birds were implanted with silastic tube implants filled with crystalline T for a total of 3 weeks, during which they were repeatedly measured on D1, D2, D4, D7, D14 and D21 after implantation, and again one (D-1) and 2 days (D-2) after implant removal. Song was recorded before and after each DTI measurement to calculate the average song performance. The song bout length and song rate (number of warbles/hour) were quantified as a measure of the song performance. Blood samples were taken to assay T levels. Structural neuroplasticity was monitored over these different time points by acquiring MRI images on a 7T Bruker MR system. Each imaging session consisted of a T2-weighted 3D anatomical RARE scan (TR: 2000 ms; TE: 11 ms; RARE factor: 8; zerofilled matrix of (256x92x64) with voxel resolution (0.089x0.25x0.25)mm³) followed by a DTI scan (TR: 7000 ms; TE: 23 ms; δ 4ms, Δ 12ms; b-value 670 s/mm²; 60 diffusion gradient directions; spatial resolution: (0.179x0.179x0.23)mm³; 27 horizontal slices). Throughout the entire imaging procedure, respiration rate and temperature were kept within narrow physiological ranges (41.0 ± 0.2)°C. All datasets were spatially normalized to a population-based template, diffusion tensor was estimated from the DW data and mean diffusivity (MD), eigenvalues (λ1, λ2, λ3) and fractional anisotropy (FA) maps were calculated using the Diffusion toolbox II of SPM12. Based on the anatomical contrast of the FA maps RA and the HVC-RA tract were manually delineated using Amira 5.4. Statistical analysis of T, song behavior and ROI averaged diffusion metrics and volumes was performed using linear mixed model in JMP13Pro. Voxel based multiple regression analysis was performed to unravel correlations between song performance and structural changes using SPM12.Results
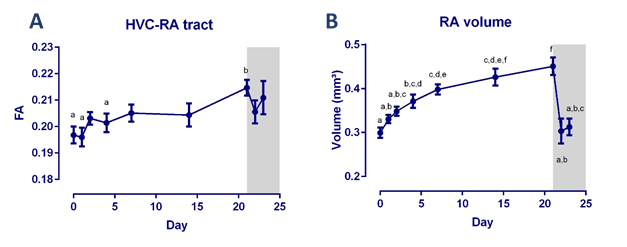
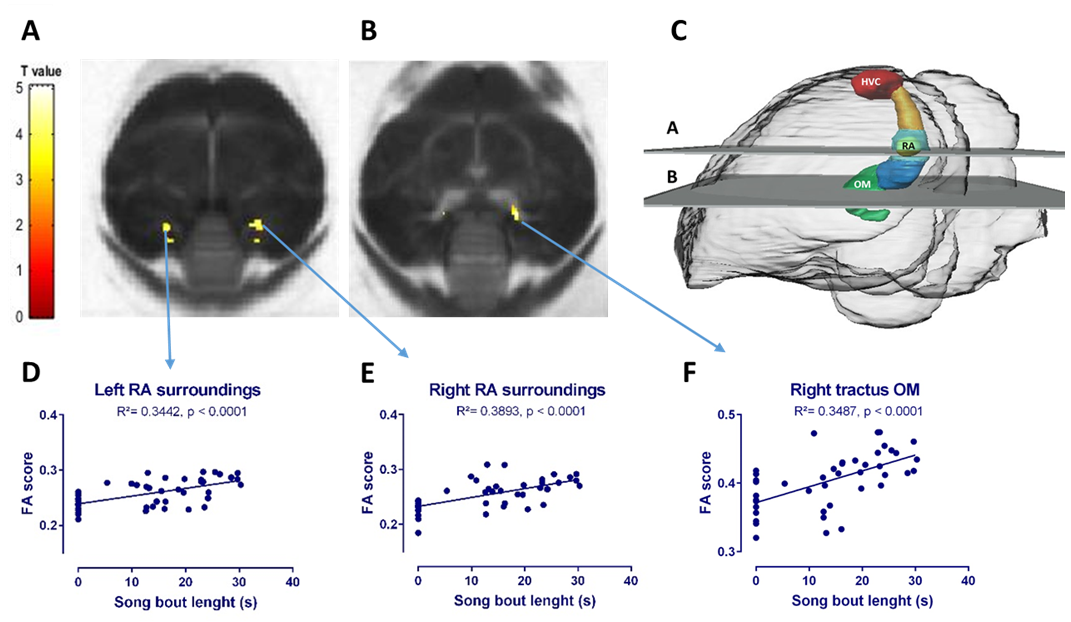
T-implantation significantly increased testosterone concentrations to 4.83 ± 3.09 ng/ml (average ±SD) at D2, remained high during implantation, but dropped after T implant was removed. Song rate increased drastically from D4 onwards (Figure 1). Fractional anisotropy was significantly higher in the HVC-RA tract at D21 compared to D0 (Figure 2A). Furthermore, RA volume was significantly larger at D4 compared to D0 (Figure 2B). We found a positive correlation between song bout length and FA and λ1 score in the region directly surrounding RA and part of the occipito-mesencephalic (OM) tract (Figure 3).Discussion and conclusion
In this study we wanted to examine in ‘real time’ the relationship between song performance and neuroplasticity induced by T treatment. After T implantation, song performance was the first to increase and further developed until it reached a stable song bout length after 14 days, in line with prior T implantation studies3. This increase in song bout length was positively correlated to the increase in RA volume, similar to male starlings in natural conditions4. This relation was further confirmed by a voxel based positive correlation between song bout length and FA and λ1 score observed in a region surrounding RA and part of the OM tract. Indicating that more neurons from HVC and the OM tract connect to RA. These SCS nuclei are part of the motor pathway connecting to the syrinx, controlling the production of song (Figure 3C). Prior studies reported structural changes in dendritic synapses at the level of RA after T implantation5 and strengthening of this pathway in male starlings during spring6. Steroids first induce singing behavior, by acting on the medial preoptic nucleus or POM (part of the hypothalamus), to increase the motivation to sing7. This in turn induces the observed neuroplasticity, known as activity-induced neuroplasticity. Furthermore, it was suggested that T stimulates the motor pathway to enable birds to master already acquired songs5. We showed in ‘real time’ that the motor pathway, connecting HVC to RA and to the OM tract, matures to reach a stable song bout length.Acknowledgements
This research is supported by a Belspo IAP grant (PLASTOSCINE: P7/17) from the Belgian Science Policy Office and by grants from the Research Foundation – Flanders (FWO, project Nr 1115217N, 1274714N and G030213N)References
1. Tramontin A D, Brenowitz E A. Seasonal plasticity in the adult brain. Trends Neurosci. 2000; 23(6): 251-258.
2. Hall Z J, Macdougall-Shackleton S A. Influence of testosterone metabolites on song-control system neuroplasticity during photostimulation in adult European starlings (Sturnus vulgaris). PLoS One. 2012; 7(7): e40060.
3. deVoogd T J, Nixdorf B E, Nottebohm F. Synaptogenesis and changes in synaptic morphology related to acquisition of a new behavior. Brain Res. 1985; 329: 304-308.
4. Bernard D J, Eens M, Ball G F. Age- and behavior-related variation in volumes of song control nuclei in male European starlings. J Neurobiol. 1996; 30(3): 329-339.
5. Canady R A, et al. Effect of testosterone on input received by an identified neuron type of the canary song system: a Golgi/Electron microscopy degeneration study. J Neurosci. 1988; 8(10): 3770-3784.
6. De Groof G, et al. Seasonal rewiring of the songbird brain: an in vivo MRI study. Eur J Neurosci. 2008; 28(12): 2475-2485.
7. Alward B A, Balthazart J, Ball G F. Differential effects of global versus local testosterone on singing behavior and its underlying neural substrate. Proc Natl Acad Sci U S A. 2013; 110(48): 19573-19578.
Figures