2122
A novel transgenic rat model of evolving cerebral amyloid angiopathy (CAA)1Yale University, New Haven, CT, United States, 2University of Rhode Island, Kingston, RI, United States
Synopsis
Understanding the pathophysiology of cerebral amyloid angiopathy (CAA) has become increasingly important because there is evidence to suggest that vascular dysfunction plays an important role in early component in the development of Alzheimer’s disease (AD). To study CAA, Tg-SwDI transgenic mouse model was recently extended to rat (Tg-DI) and here we report the first MRI studies to characterize CAA in Tg-DI in both in vivo as well as in vitro using 3D-GRE sequence. Conspicuous lesions were detected in thalamus in Tg-DI at very early stage, consisting of multiple pathological changes including micro-bleeds, extravasation of blood products and/or occluded vessels.
Introduction
Cerebral Amyloid Angiopathy (CAA) can occur in sporadic or rare hereditary forms [1]. The importance of understanding the pathophysiology of CAA, especially at the capillary level, is currently highlighted since there is increasing evidence that vascular dysfunction is critical in the development of Alzheimer’s disease (AD). A variety of transgenic CAA mouse models have been generated to study the pathophysiology [2]. One of these models, Tg-SwDI mouse model, expresses the human APP gene (isoform 770) containing the Swedish, Dutch, and Iowa mutations under the control of the mouse Thy1 promoter in brain and develops early pathology [3]. Van Nostrand’s laboratory recently extended this model that expresses the same mutations in rat and here we report the first MRI studies to characterize cerebral pathology of the Tg-DI rat model in vivo as well as in vitro.Methods
All animal studies were approved by the local IACUC committee at Yale and URI. MRI imaging acquisitions were performed on a Bruker 9.4T MRI. In vitro experiments: Following perfusion fixation of 12 months old male transgenic (Tg-DI) and wild type (WT) rats, skull stripped brain specimens were immersed in PBS for ≥ 4 days and ex-vivo scans were acquired using cryogenically cooled RF coil as a transmit and receive. A 3D gradient echo sequence (GRE) with the following imaging parameters was used: TR/TE/FA=100ms/7~30ms/25° NEX=1 resolution= 0.08x0.08x0.08mm. The brain specimens were subsequently processed for histology. Briefly, sections were cut in the axial plane at 10-μm thickness using a microtome, deparaffinated, and rehydrated. To evaluate fibrillar amyloid deposition in the brain, we performed thioflavin S staining; and to evaluate microbleeds and extravasation of blood products we used Perl’s Prussian blue staining. In vivo experiments: Rats were anesthetized with dexmedetomidine (0.015mg/kg/hr) and low dose isoflurane 0.5-1% and images were taken by 40mm volume transmit and receive coil. 3D gradient echo imaging parameters were TR/TE/FA=60ms/2~32/15°NEX=6 resolution= 0.23x0.23x0.23mm. T2* was calculated in each voxel assuming mono-exponential signal decay between the MR image intensity and the echo times. A region of interest (ROI) was drawn over the conspicuous lesion in thalamus and the mean ± SD of T2* were extracted in 3 & 6 months old rats from both groups.Results
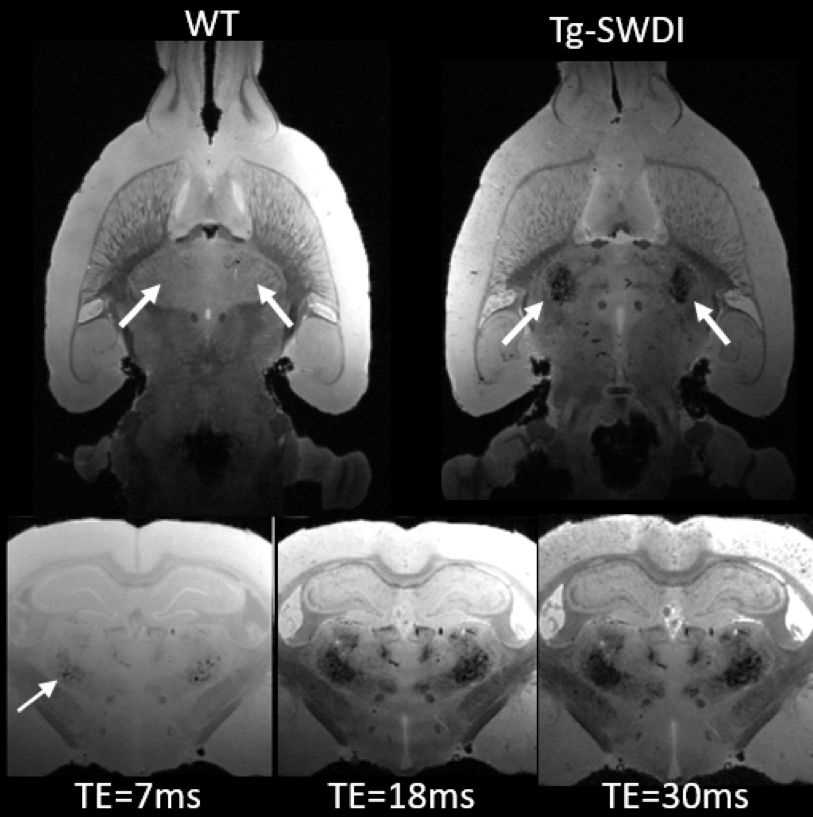
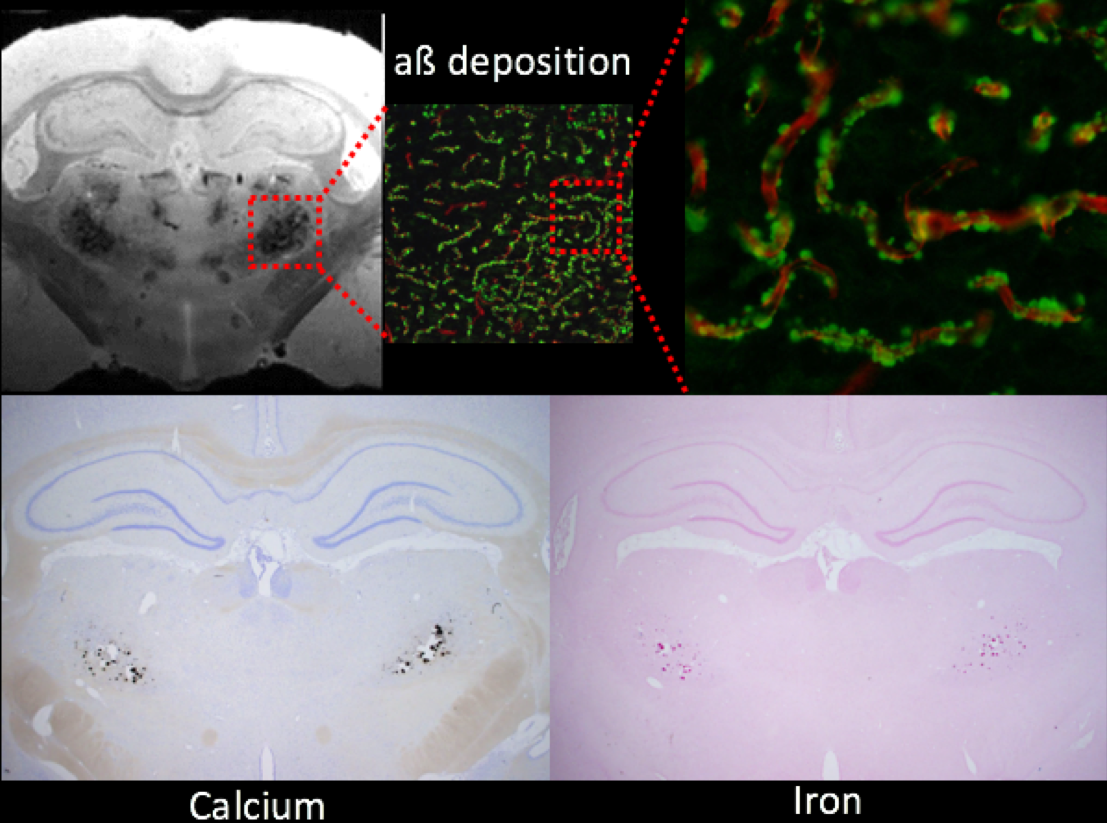
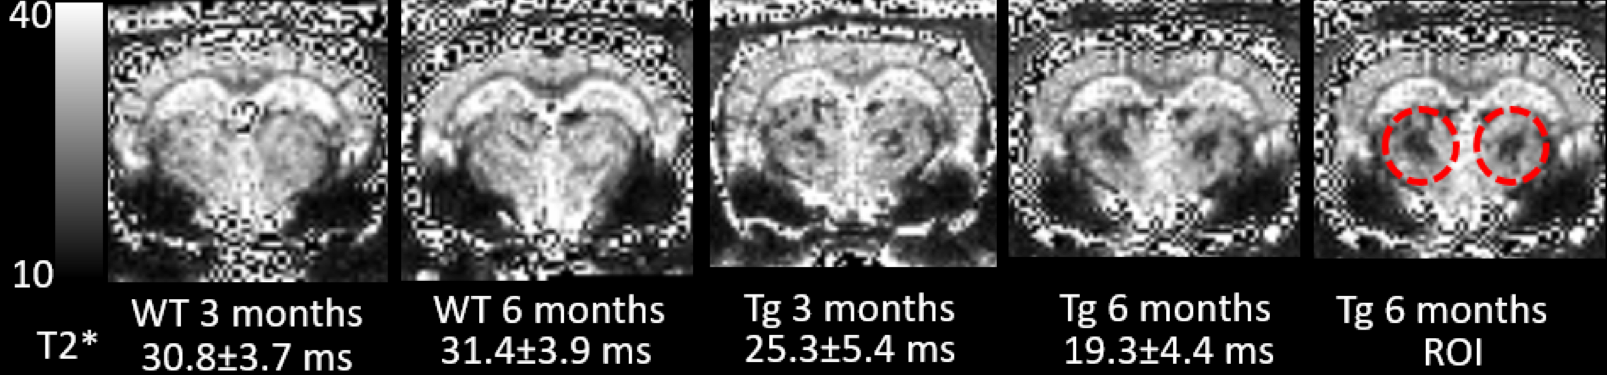
Ex-vivo: Conspicuous hypo-intensities in thalamus were consistently observed in all Tg-DI rats while absent in WT rats (Fig. 1). With increasing TE (Fig. 1, bottom), the mid-thalamic low-signal lesions grow progressively larger because of susceptibility effects. Other pathological features included ventricular dilation and focal hypo-intensities in the subiculum. Histology revealed that the thalamic hypo-intensities represent small vessel occlusion (occasionally calcified) and extravascular ferritin deposition and older bleeds (hemosiderin). Deposition of Ab in the microvasculature was ubiquitous as shown in Fig.2; but was not detected by T2*-weighted MRI. In vivo: The progression of thalamic micro-bleeds was evaluated from longitudinal in-vivo scans acquired at 3 and 6 months. Quantitative T2* maps from a WT and a Tg-SwDI rat at 3- and 6-months showed that the thalamic T2* was unchanged in the WT rat; while the T2* decreased by 15-20% in 3- as well as 6-months in a Tg-DI rat when compared to T2* of WT (Fig.3).Conclusion
CAA hallmarks including microbleeds, extravasation of blood products and accumulation of Ab along capillaries and small arterioles was demonstrated in the novel Tg-DI rat model in vitro as well as in vivo. At 12 months, bilateral thalamic hypo-intensities were consistently observed. The thalamic lesions characterized by low T2* were also clearly visible in vivo even at very early age and are representing multiple pathological changes including micro-bleeds, extravasation of blood products and/or occluded vessels, which could not be distinguished from the gradient-echo images alone. In vivo multi-modality, longitudinal MRI studies for the full characterization of onset and progression of pathology in Tg-DI rats are underway. Whether the CAA disease progression is associated with a changes of CSF transport via the ‘glymphatic pathway’ remains to be tested and experiments are ongoing and will be presented.Acknowledgements
NIH-RF1AG053991
Leducq Foundation.
References
1. S. X. Zhang-Nunes et al., The cerebral beta-amyloid angiopathies: hereditary and sporadic. Brain Pathol 16, 30-39 (2006).
2. L. Jakel, W. E. Van Nostrand, J. A. R. Nicoll, D. J. Werring, M. M. Verbeek, Animal models of cerebral amyloid angiopathy. Clin Sci (Lond) 131, 2469-2488 (2017).
3. F. Xu et al., Early-onset subicular microvascular amyloid and neuroinflammation correlate with behavioral deficits in vasculotropic mutant amyloid beta-protein precursor transgenic mice. Neuroscience 146, 98-107 (2007).
Figures