2120
Neural activation imaged by MEMRI in mouse models of PTSD: Early Life Stress and Role of the Serotonergic System in Prolonged Response to Fear1Pathology, University of New Mexico Health Sciences Center, Albuquerque, NM, United States, 2Zilkha Neurogenetic Institute, University of Southern California, Los Angeles, CA, United States
Synopsis
PTSD results from life-threatening fear. We use mouse as an experimental model to investigate acute and persistent fear responses, imaging brain activity by MEMRI, coupled with behavioral responses and histologic confirmation of activity with c-Fos staining. We imaged neural activity at multiple time points in mouse lacking the serotonin transporter, SERT, and with/without early life stress. This approach represents an unbiased comprehensive method to look at the dynamics of the brain’s response to fear over time, not possible by other imaging methods. We find altered activity and circuits in mice after fear dependent on genotype and environment.
Introduction
Posttraumatic stress disorder (PTSD) occurs in some people after exposure to life-threatening fear, and impacts up to 8% of the general population, including veterans and victims of domestic violence. One of the central questions involved in PTSD research is how a traumatic event fundamentally alters neural circuits. Early life stress (ELS) and serotonergic dis-regulation are associated with PTSD, and fear activates serotonergic and noradrenergic systems, and the HPA axis. Mouse lines knocked-out for the serotonin transporter gene (SERT-KO) have increased fear responses to predator stress (PS), with prolongation of the fear response1. Using manganese-enhanced MRI (MEMRI) tract-tracing, we reported that SERT-KO mice have abnormal circuitry in the prelimbic system2. To determine if this circuit is affected by fear, SERT-KO and WT mice were exposed to PS and the effects on neural activity and circuitry assayed by MEMRI before and after stress. Predator stress is a known naturalistic provocateur of PTSD in rodents. Mn2+ is a metabolic contrast agent that reports on neural activity by entering active neurons through voltage-activated Ca2+ channels when delivered systemically3, and is transported along axons tracing multi-synaptic circuitry when injected locally4,5. Mn2+ increases the relaxation rate of protons in water in T1-weighted pulse sequences, and thus produces a hyper-intense signal in T1-weighted MRI.Methods
WT littermates and SERT KO mice (12 each) were either exposed to fragmented care during post-natal day P2-10 or raised normally and exposed to PS at 10 weeks of age. For PS, we used the synthetic fox anal gland odor, 2,3,5-Trimethyl-3-thiazoline (TMT). Behavior in the light-dark box was recorded by Noldus video system to determine baseline behavior prior to PS and post-PS responses. Mice were imaged in an 11.7 T vertical bore Bruker MR scanner prior to Mn2+ IP injection, then injected with Mn2+ IP and scanned 24hr later. Immediately following the 24hr scan, mice were exposed first to saline and then to PS in a light-dark box, their behavior recorded. Neural activity was tracked by capturing MR images at 15m intervals for 2hr after PS. At 9d, behavior was recorded and mice were scanned, then injected IP with Mn2+ and scanned 24hr later to test for persistence of neural activity. Whole head images of living mice were skull-stripped and aligned5,6. Using statistical parametric mapping (SPM) tools we compared images within group between time-points by paired T-tests and between the SERT KO and WT groups with ANOVAs. We confirmed intensity changes by ROI analysis of locations detected by SPM as statistically different, and localized neural activation by c-Fos staining.Results and Discussion
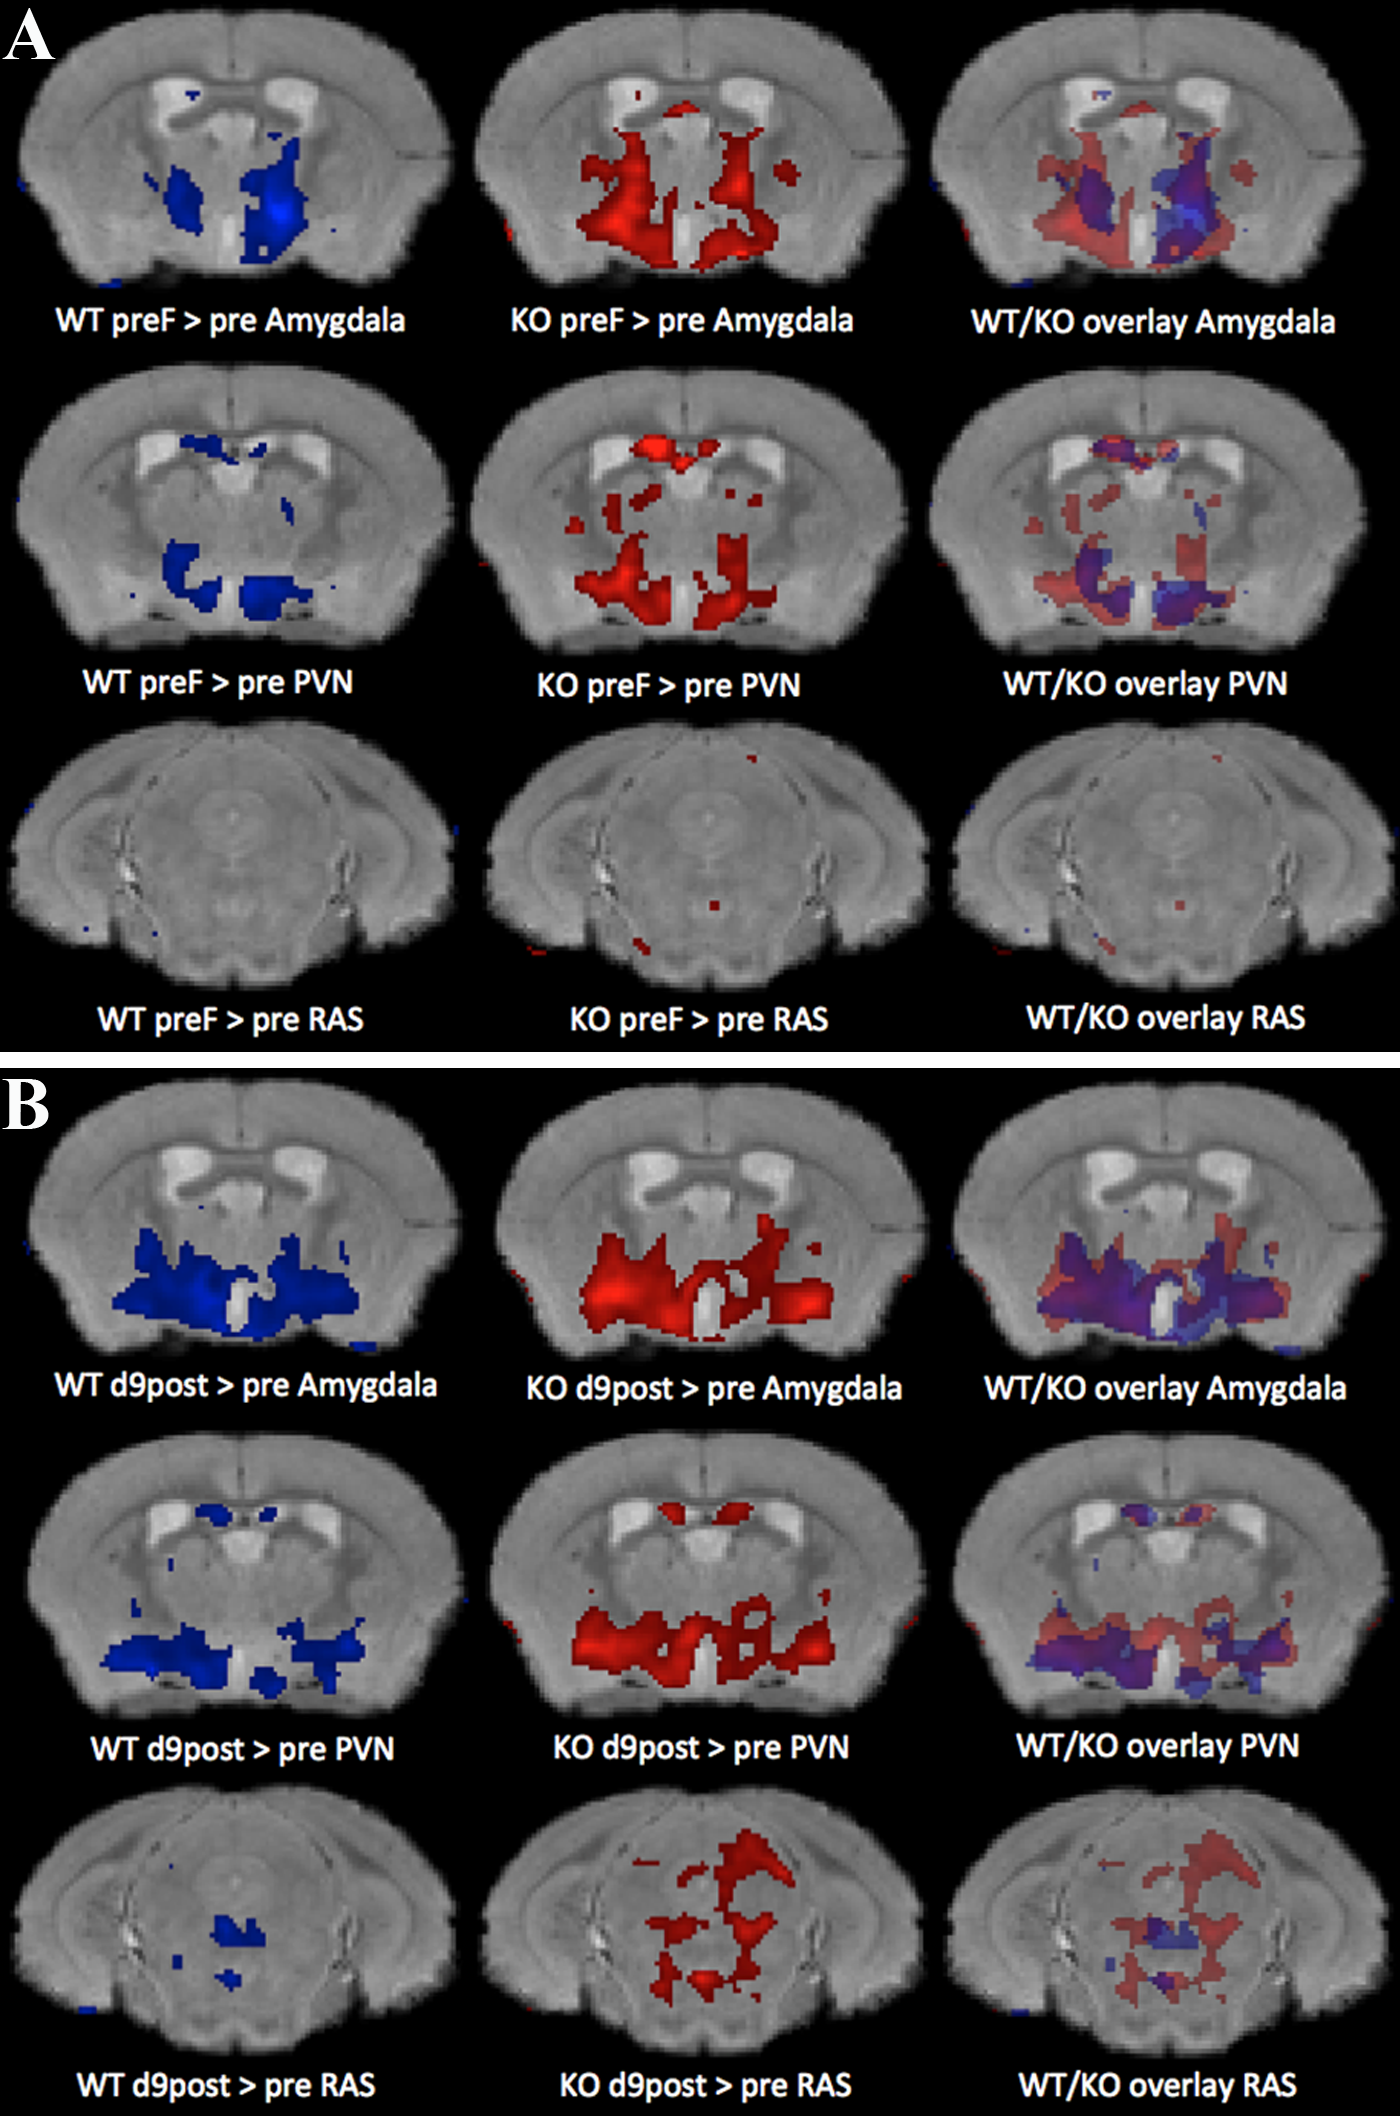
We detected strong signals in the "resting" brain, prior to PS. This signal had maximal increase at 24hr and dissipated over 13d. After PS, signal increased specifically in amygdala, hypothalamus, hippocampus and reticular activating system, with more increase in ELS-exposed mice and SERT-KO than wild-type-normally raised animals. Both fearful behavior and brain activity in ELS and in SERT-KO mice was prolonged after PS. Comparisons of the 10d post PS images detected statistically significant (p<0.001 uncorr.) in the paraventricular hypothalamic nucleus, amygdala and reticular activating system in SERT KO mice compared to WT by ANOVA (p<0.001 uncorr). An ROI analysis demonstrated that the extent of difference in voxel intensity, after normalization, between groups at the 10d time-point was 2-6%, and confirmed statistical differences in intensities as identified by SPM analysis. Activation of these brain regions was confirmed by c-Fos staining of the same mice. MEMRI tract-tracing of the prelimbic circuit was also affected by SERT, PS and ELS. Hence SERT KO mice exhibited both sustained behavioral response to PS as well as prolonged neural activity in fear-associated brain regions. Interestingly, the locations of activity evolved over time.Conclusions
The behavior of SERT-KO animals in response to PS correlates to PTSD-like symptoms, such as avoidance and hyper-arousal. Like the behavior, activation of brain regions in these mice also persisted for 10d after PS but less so in WT mice. Changes in location of signal suggest that PTSD responses in the brain evolve. Thus, MEMRI provides an experimental system to explore the dynamics of whole brain biological mechanisms that result in PTSD, with possible clues for diagnosis and interventions. These results show interactions between genotype, early life experience and context, suggesting a 2 or even 3-hit model for PTSD.Acknowledgements
NIMH: MH096093 and The Harvey Family Endowment (ELB)References
1.Adamec, R., et al. Behav Brain Res 170, 126-40 (2006).
2. Bearer, E.L., et al. Neuroimage 46, 1091-104 (2009).
3.Malkova, N.V., et al.. Proc Natl Acad Sci U S A 111, E2492-500 (2014).
4. Bearer, E.L. et al. R). Neuroimage 37 Suppl 1, S37-46 (2007).
5.Medina, C.S., et al Curr Protoc Mol Biol 119, 29A 5 1-29A 5 38 (2017).
6. Delora, A. et al. J Neurosci Methods 257, 185-93 (2016).
Figures