2117
Multiparametric magnetic resonance and phenotypic characterization of a mild depression rat model1Instituto de Investigaciones Biomédicas "Alberto Sols", CSIC-UAM, Madrid, Spain
Synopsis
Depression is a common and serious medical illness with a direct impact both in the physical and mental health. It is a complex disorder of the mood with a high incidence in the world population and a tendency to continue increasing. The multifactorial and heterogeneous character of this disease hinders the understanding of the pathological mechanism. The use of an appropriate animal model of depression can contribute to improve the diagnosis and monitoring of the therapy outcome. In this work, we characterized with MRI and phenotyping studies a mild depression model developed in female rats.
Introduction
Depression is a mental disorder that alters individual disposition and involves depressed mood and feelings of sadness, worthlessness and culpability. It is a severe condition whose prevalence has increased dramatically, with the social and health problem that this entails [1]. The molecular mechanisms that underlie the pathology are not currently well known. In fact, there is not any clinical approach in order to validate either the progress of the illness or the outcome of therapies [2]. On the other hand, magnetic resonance imaging (MRI) has been proven as a powerful tool for assessing the healthy and diseased brain also in the clinical and the preclinical set ups. In this line, multiparametric MRI is emerging as a useful approach in improving the diagnosis, prognosis and therapy validation of numerous pathological processes [3,4]. Also, manganese enhanced magnetic resonance imaging (MEMRI) is a powerful imaging method to evaluate the distribution of central neural activity [5]. On these grounds, we aimed to employ multiparametric MRI approaches in combination with phenotyping studies, to characterize a mild depression rat model.Methods
Animal model. Adult female Wistar rats were submitted to a Chronic Mild Stress (CMS) protocol (3 groups, n=12 each one) and 36 healthy animals used as control were studied in this work. The depression protocol was based on the application of alternating physical stressors during 18 days.
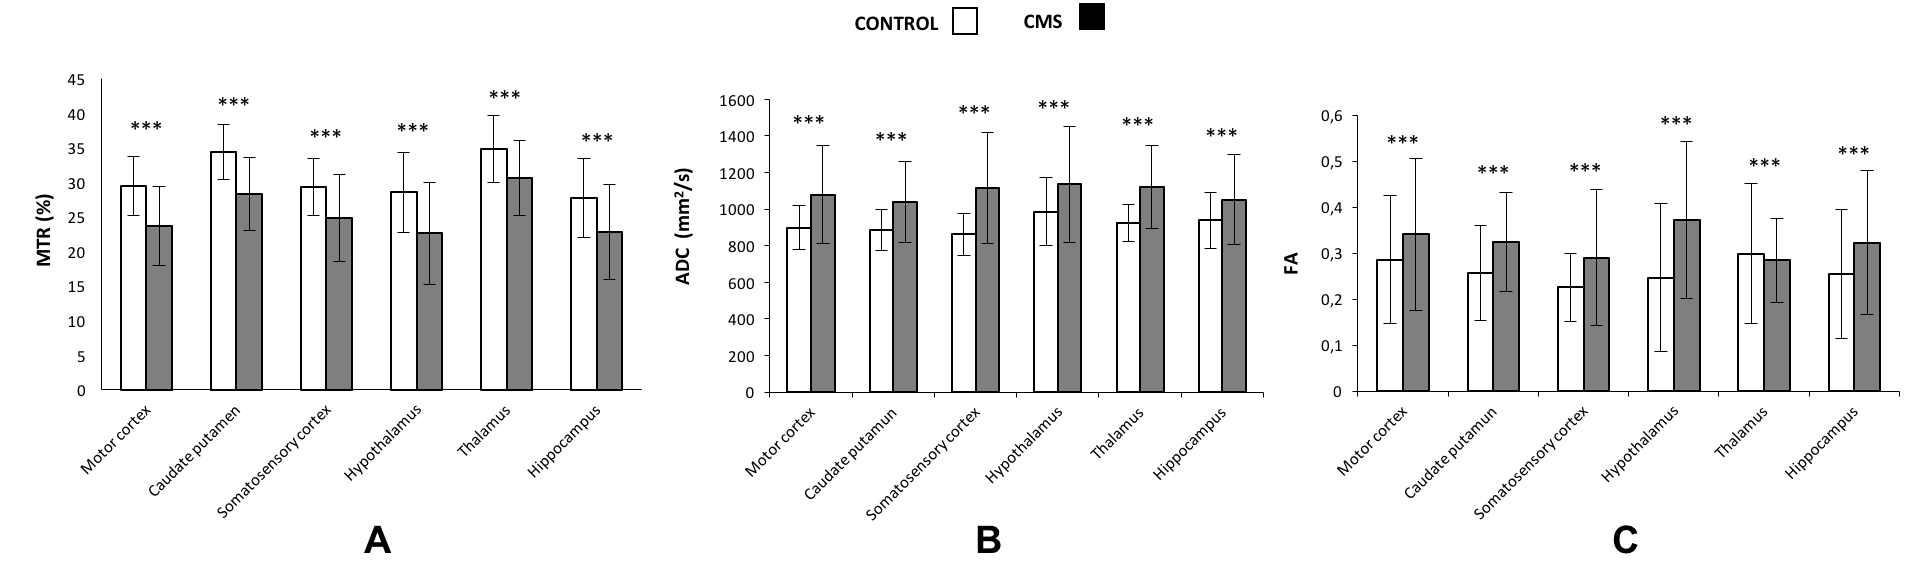
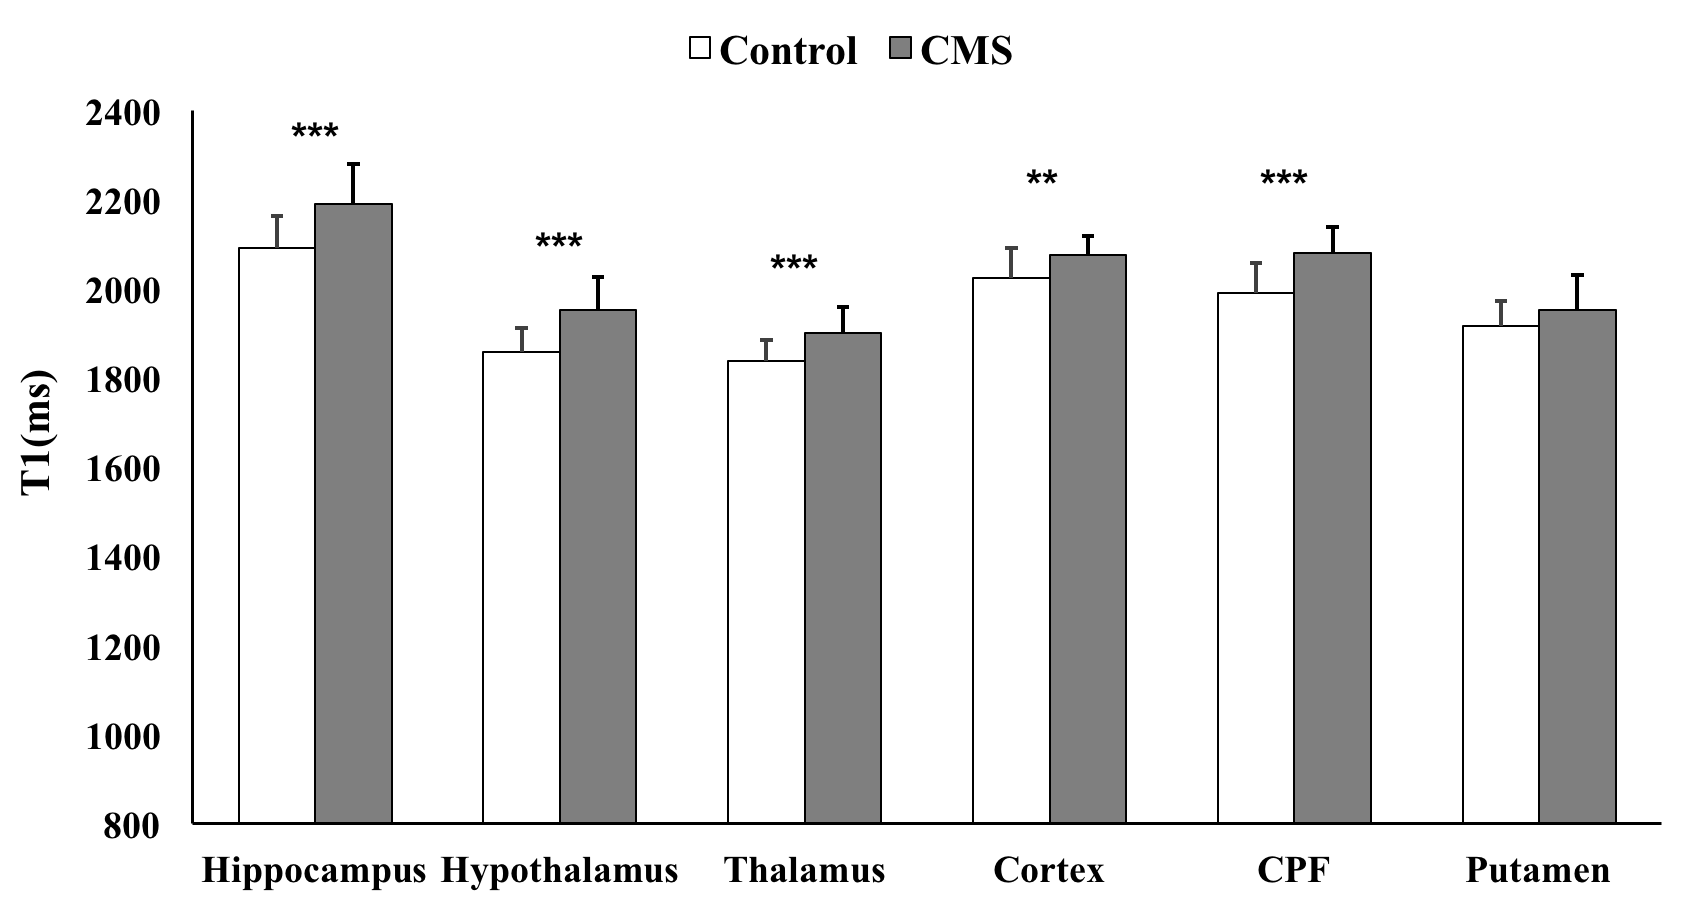
MRI studies. The imaging protocol was implemented in a 7T system and included: i) morphological T2W-images, ii) magnetization transfer imaging, iii) diffusion-weighted imaging at 6b values, iv) MEMRI studies, 24h after the i.p. administration of MnCl2 (100 mM, 1 mL/kg b.w.) based on the acquisition of T1 maps by using a saturation-recovery sequence a 9 TR values (from 150 to 6000 ms). Hippocampal volumes were measured and parametric maps were calculated from images by adjusting the signal to the appropriate equations with a home-made software. Several brain regions were manually selected (hippocampus, hypothalamus, thalamus, caudate putamen, somatosensory cortex and motor cortex) and analyzed from the computed parametric maps (MTR, ADC, FA and T1) with R software. Statistical differences were considered for p values lower than 0.05.
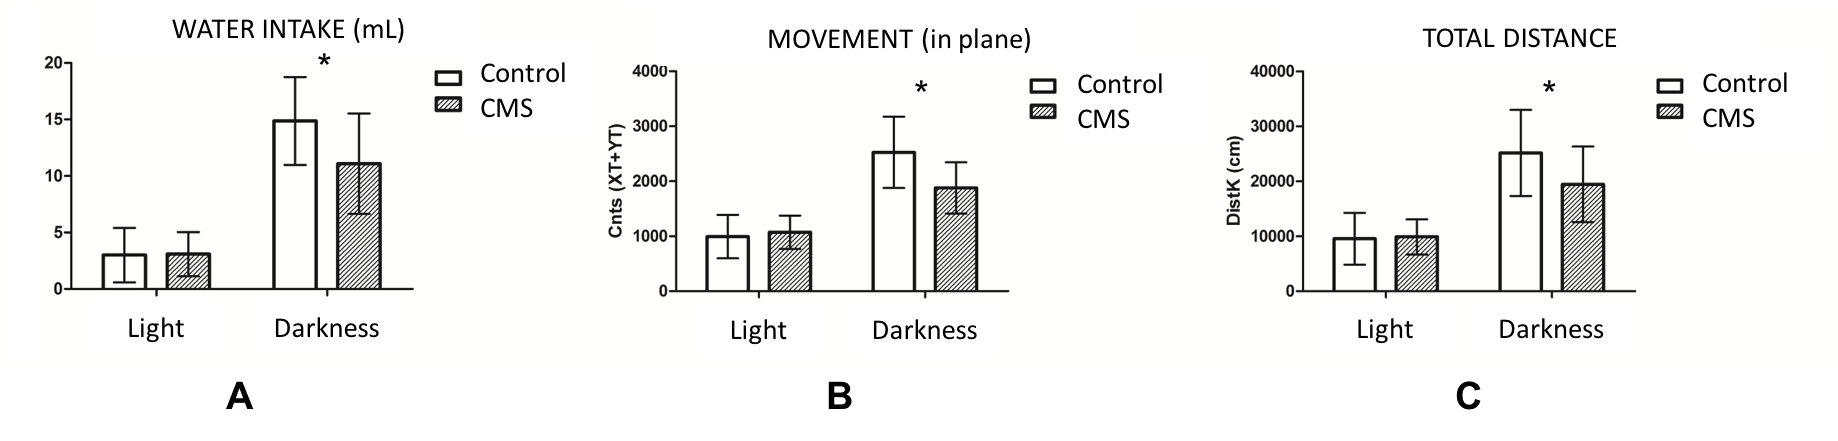
Phenotyping analysis. Rats were analyzed in a phenotyping platform that allows fully automated and perfectly synchronized assessment of metabolic, behavioral, and physiological parameters with highest precision in a stress-free home cage environment. Data of indirect gas calorimetry, food/liquid intake and locomotor activity were monitored.
Behavioural test. Animals were evaluated by using anxiety behavioural test: open-field, forced swimming and elevated cross maze. All test were recorded and different parameters evaluated.
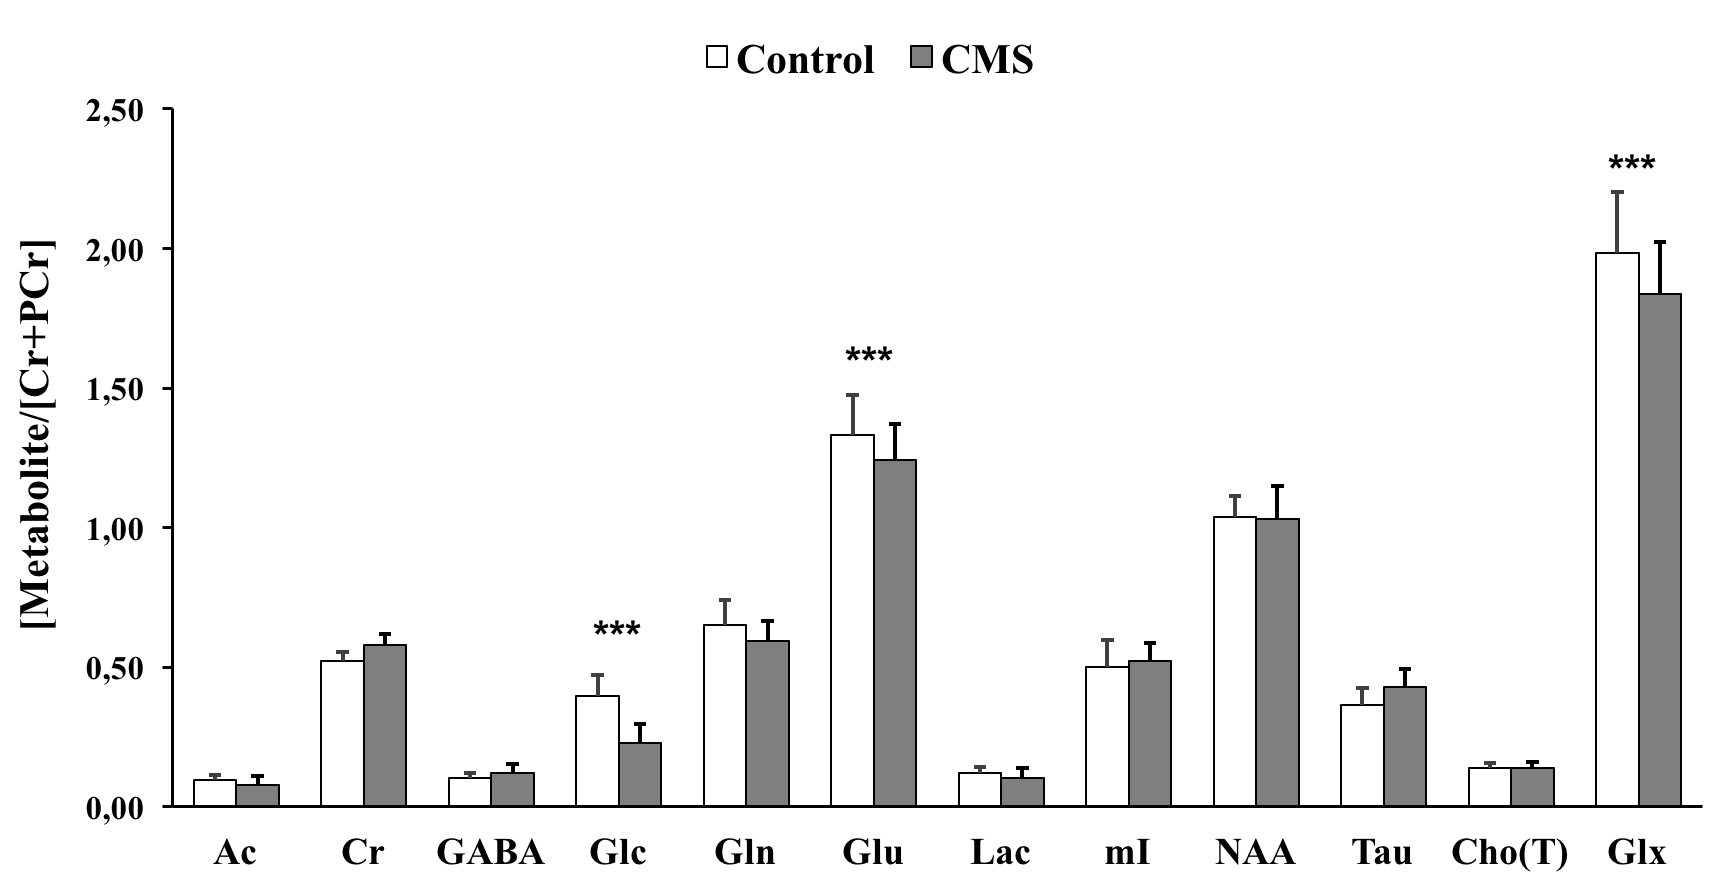
HRMAS studies. Rats were euthanized with a high power focused microwave and the excised brains regionalized to acquire 1H HRMAS spectra in an 11.7T spectrometer (CPMG sequences at TE=36 and 144 ms).
Results
Volumetric measurements indicated a reduction of the hippocampal volume in pathological rats compared to controls (4,29% ± 0,37 vs 4,65 ± 0,27, p<0.05). MTR values were also decreased in depressed animals in all regions analysed (fig.1A), whereas ADC values were increased in the same group (fig.1B) and FA presented lower values (fig.1C). Regarding on MEMRI studies, T1’s measured were clearly higher in animals submitted to the CMS protocol in all regions but the putamen (fig.2). Results from phenotyping studies signaled statistical differences in darkness measurements as lower values in diseased animals regarding on the consumption and motor indicators (fig.3). Nevertheless, behavioural tests did not show any significant differences in all parameters assessed but an open-field measurement. Finally, metabolomic analysis from ex vivo spectra showed a lower concentration of glutamate and glutamine (GABAergic neurotransmitters), and glucose, an essential substrate for neurons to transmit adequately nerve impulses (fig.4).Discussion/Conclusion
We validated by in vivo and post-mortem studies the mild depression model achieved in female rats submitted to a CMS protocol. It was identified a hippocampal volume reduction from morphological images, and the anhedonia status verified by phenotyping studies. Inflammation processes were detected by a decrease in MTR and an increase of ADC, and gliosis suggested by the alterations in FA values. Also, MEMRI functional studies indicated a lower neuronal activation of pathological group detected by a higher T1 decrease in control rats. The higher T1 values are associated to a minor Mn2+ accumulation because of decreased cerebral activation in diseased animals. Ex vivo spectra are also in concordance with a defective GABAergic and nerve impulse transmission. Results suggest that these quantitative parameters can be used like biomarkers of depression to improve diagnosis and therapies validation.Acknowledgements
This work was supported by grants from Ministerio de Ciencia e Innovación (CTQ2010-20960-C02-02) and Comunidad de Madrid (S-BIO-0170-2006).References
[1] Deussing, Drug discovery today: disease models, 2007, 3:375-383
[2] Krishnan, Nestler, The molecular neurobiology of depression, Nature, 2008, 455:894-902
[3] Wiestler et al. Multiparametric MRI-based differentiation of WHO grade II/III glioma and WHO grade IV glioblastoma, Sci Rep. 2016; 6:35142
[4] Perez-Carro et al. Multiparametric magnetic resonance in the assessment of the gender differences in a high-grade glioma rat model, 2014, EJNMMI Res. 4:44
[5] Silva et al. Manganese-enhanced magnetic resonance imaging (MEMRI): methodological and practical considerations, NMR in biomedicine, 2004, 17: 532-543
Figures