2116
Apparent Diffusion Coefficient Correlates with Histological Tumor Burden at the Infiltrating Margins of a Preclinical Glioblastoma Model1Centre for Clinical Brain Sciences, University of Edinburgh, Edinburgh, United Kingdom, 2Glasgow Experimental MRI Centre, University of Glasgow, Glasgow, United Kingdom, 3Institute of Cancer Sciences, University of Glasgow, Glasgow, United Kingdom
Synopsis
Assessing the imaging boundary of glioblastoma multiforme (GBM) has potential to characterize phenotypic invasiveness relevant to outcomes. Preoperative apparent diffusion coefficient (ADC) changes across this boundary predicts outcome in humans. The tissue specificity of this finding is unknown, hindering the interpretation, further development, and application of the technique. We selected and assessed a relevant preclinical murine infiltrating GBM orthotopic human xenograft model with a novel histological tissue tumor load assessment to investigate relationships between ADC on imaging and cellular infiltration. A robust and strong inverse correlation between the histological tumor infiltration measure and ADC transition is demonstrated, supporting the hypothesis that ADC changes across GBM boundaries represent tumor infiltration and therefore relate to the previously-proposed invasive phenotype imaging biomarker.
INTRODUCTION
Glioblastoma multiforme (GBM) remains a therapeutic challenge, with small increases in dismal outcomes despite numerous clinical trials. There have been significant recent developments in molecular characterization, although grading remains primarily histopathological. While molecular subtypes of GBM are associated with differential outcomes, whole lesion categorical grading and characterization from a small sample eschews intratumoral genetic and/or phenotypic heterogeneity relevant to diagnosis, prognosis, and treatment. Maximal safe cytoreductive surgery is a therapeutic ideal, generally precluding the tissue-diagnostic enhancing component from the longitudinal disease process. Non-enhancing infiltrative disease ultimately drives treatment failure and is increasingly studied. Largely obscured within surrounding FLAIR abnormality, interrogation of infiltrating tumor is challenging, with comparatively low tumor burden and intact blood-brain barrier limiting even highly sensitive positron emission tomography (PET) techniques. Imaging assessment of tumor margins shows promise in molecular subtyping1, characterizing potentially-invasive behavior beyond the enhancement2,3, and providing relevant spatial heterogeneity information3. A challenge to prior tumor margin clinical research stems from ADC non-specificity4, and the multiple serial biopsies required to determine tissue specificity are problematic. We aimed to investigate the contribution of microscopic tumor burden in an infiltrating GBM model to ADC changes at the macroscopic margin, to better characterize this previously-described predictive relationship between pre-operative tumor margin ADC transition values in humans, and disease outcome.METHODS
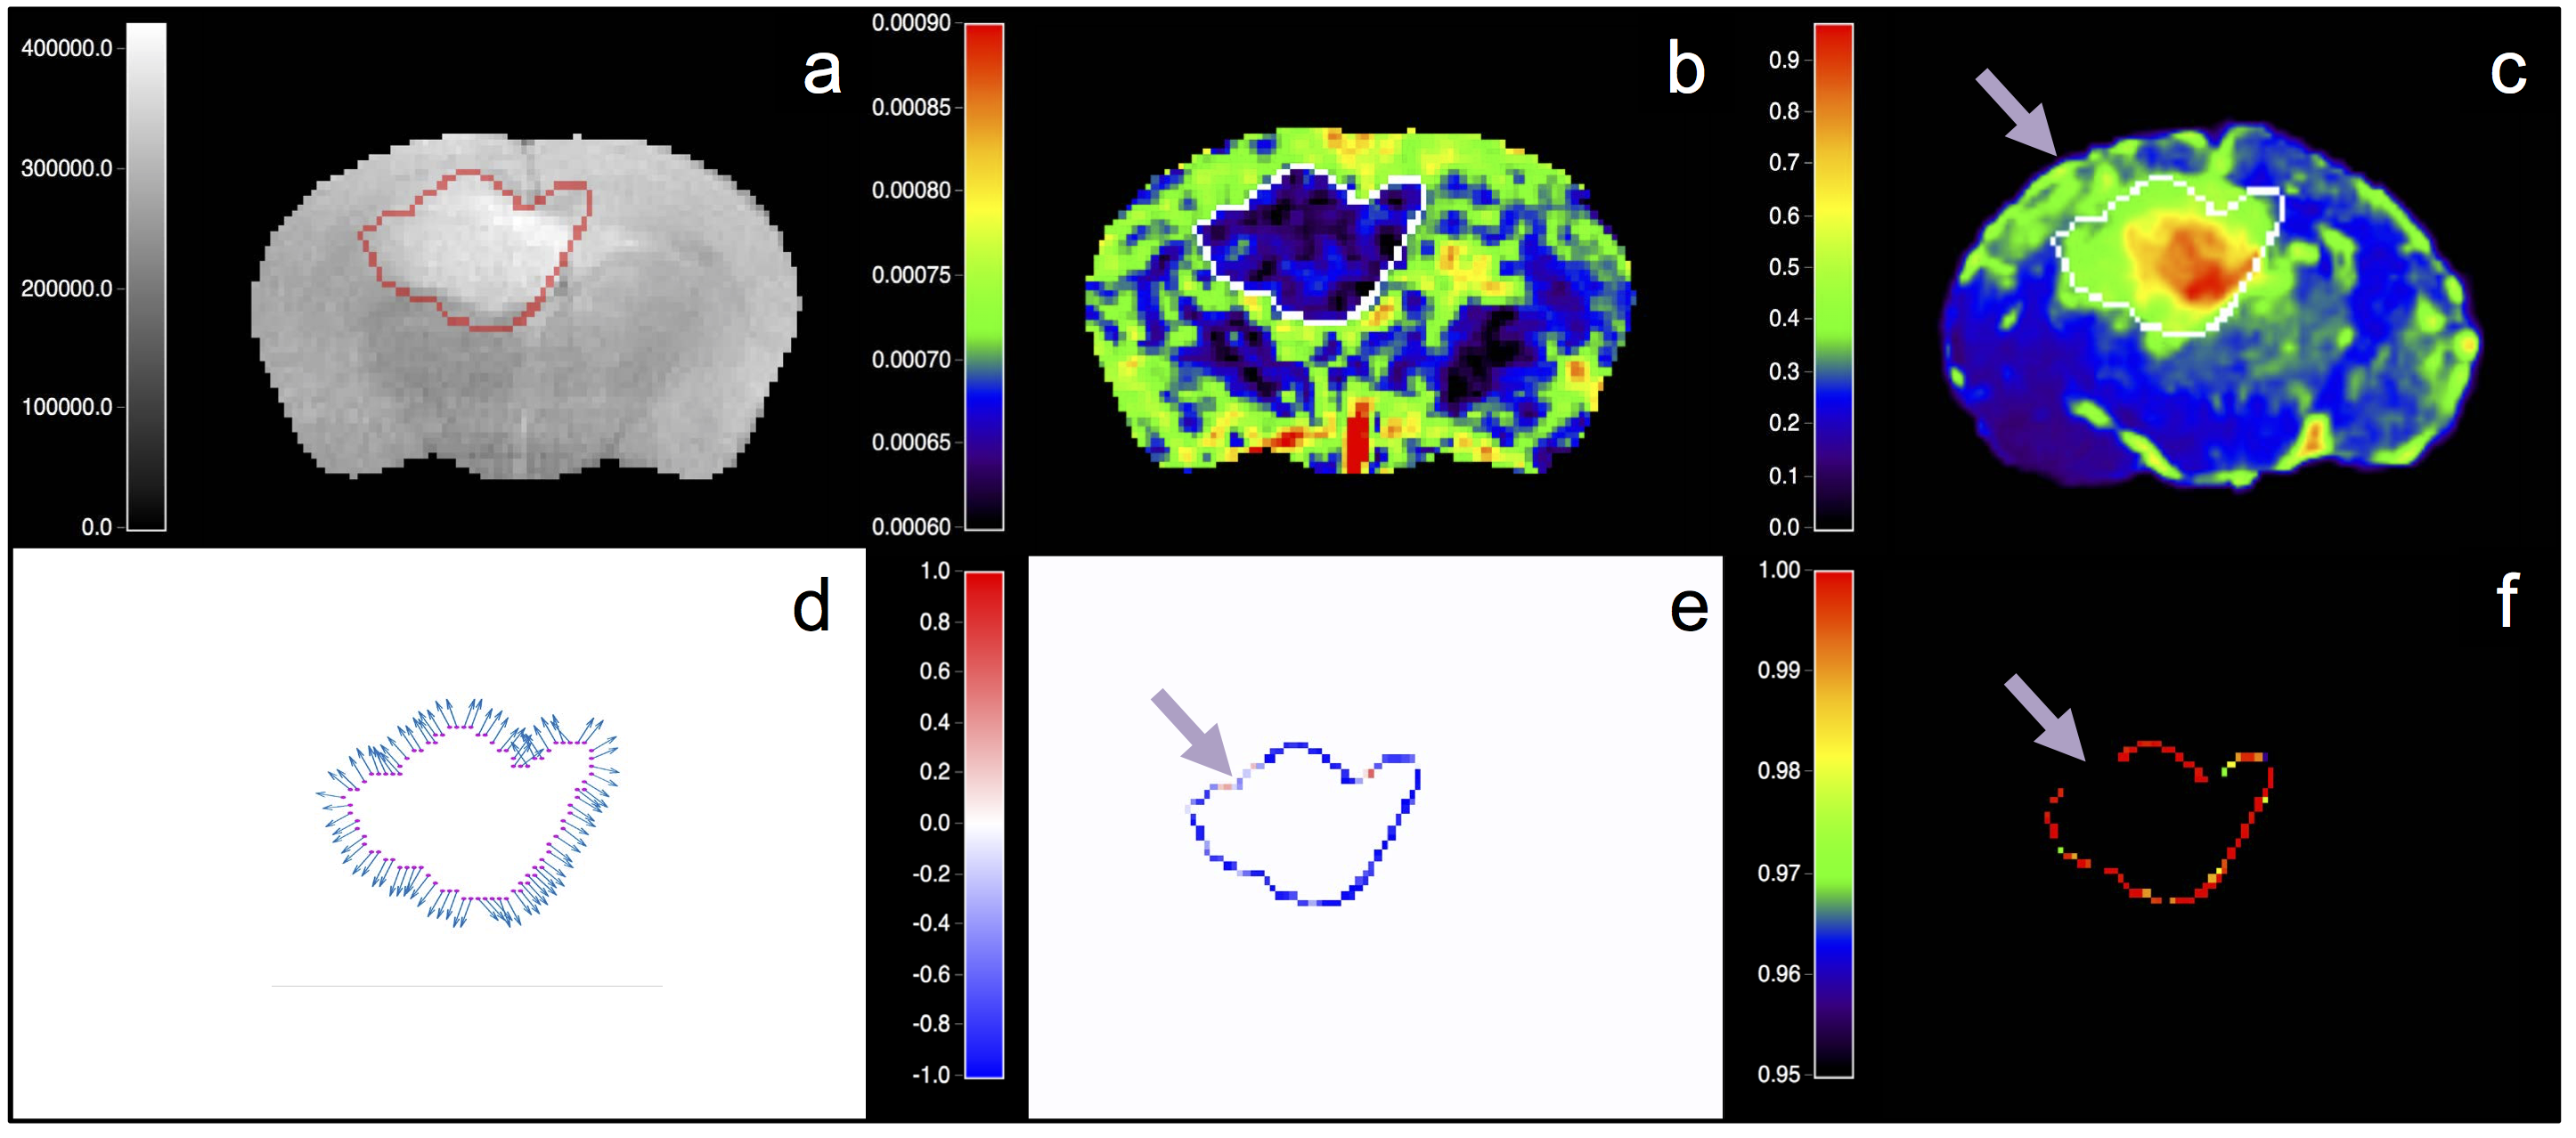
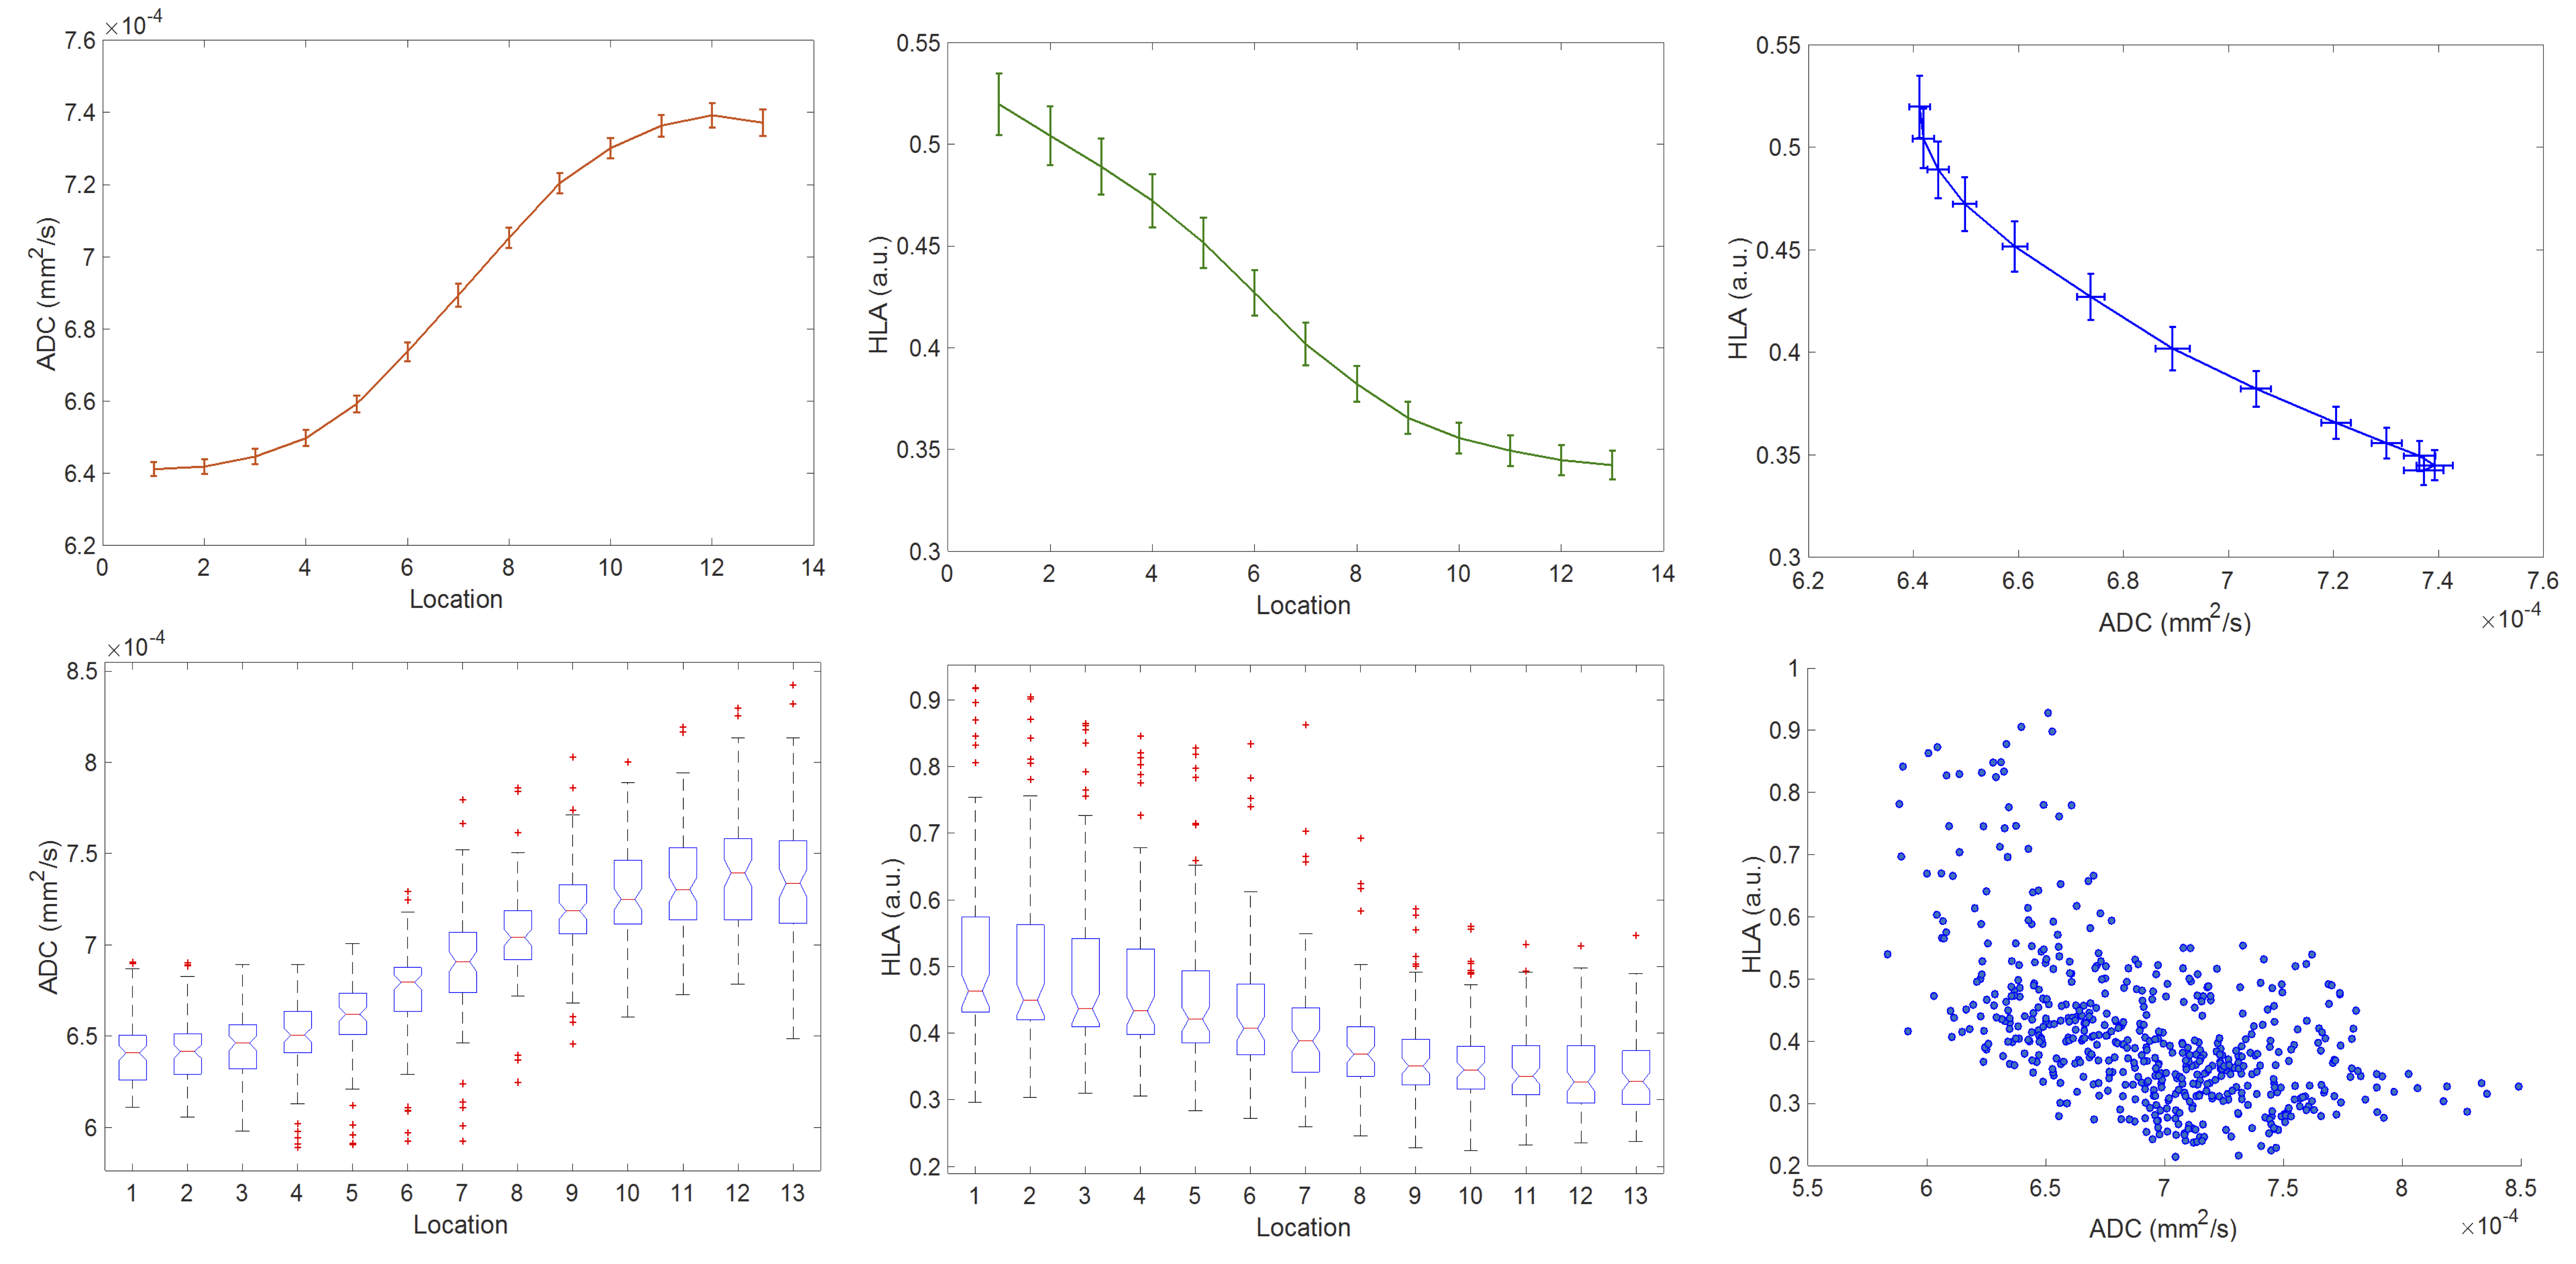
Human-derived G7 GBM orthotopic xenografts were implanted into 8 CD1 nude mice5. T2-, and diffusion-weighted images (DWI) were acquired on a 7T Bruker platform5. Brains were extracted and fresh-frozen to minimise fixation artefacts and preserve morphology for matched slicing and imaging co-registration5. Sections were stained with a human leucocyte antigen (HLA) marker complex which binds specifically to the human-derived GBM cells, with minimal non-specific background binding. Confocal tile photomicrographs of normalised HLA binding at 10x magnification were obtained5. Standard structural MR, diffusion-weighted MR, and HLA-ligand slices were rigidly co-registered, and resampled to match DWI. The tumor margin was visually delineated on the largest section at the margin of the low ADC region, informed by the tumor mass visible on T2w imaging. Linear sampling profiles were defined perpendicular to boundary voxels3, and spatially-congruent values of ADC and HLA were measured at 13 serial centrifugal locations over a length of 0.7 mm with linear interpolation. Spearman’s rho was calculated in each subject for every tumor margin profile and adjusted for multitest comparison using Bonferroni correction. These properties were assigned to the boundary voxels to allow subjective visual assessment and overlay comparison to the structural images.RESULTS
Five mice were suitable for analysis following imaging and histological preparation. Examples of a lesion with margin profiles on ADC and HLA images, Spearman’s rho, and adjusted p-value are shown in figure 1. Summary plots of the values of ADC and HLA across all measured tumor margin profiles and locations are shown in figure 2. In >80% of tumor boundaries measured in each subject, there was a statistically significant strong inverse correlation between ADC and HLA following multitest correction. On visual review, areas with insignificant/direct correlation represented physical boundaries such as ependyma/ventricular margin, or artefact e.g. from folding/misregistration of cryosections following histological preparation.DISCUSSION
Characterizing invasive disease which ultimately leads to treatment failure in GBM remains challenging. While WHO 2016 molecular markers and histological grading relate to origins and groupwise prognosis, such binary categorizations do not capture the treatment relevant heterogeneity nor adverse phenotypic behaviors at the individual level. Research predominantly focuses on enhancing disease components which augur molecular diagnosis; fewer groups interrogate the challenging non-enhancing FLAIR abnormality. Margin assessment provides an opportunity to characterize tumor at the interface between predominantly dividing bulk tumor, and the more invasive cells infiltrating parenchyma. Histopathological characterization of this region in humans carries significant limitations. Using proliferation markers does not capture non-dividing, infiltrating cells, while H&E is non-specific. Xenografts provide an opportunity for comprehensive and sensitive cellular infiltration detection since HLA is exclusive to human glioblastoma cells, surface binding on dividing and migrating cells. A drawback is that cryopreparation limits subsequent traditional histological assessment, precluding more detailed comparison without further dedicated experiments. There is strong inverse correlation between tumor margin HLA and ADC values for almost all profiles at the tumor-parenchyma interface. This indicates that the ADC profiles relate to tumor infiltration as previously hypothesised. The mechanism requires further investigation, e.g. to assess potential perfusion contributions to the ADC measurements used here.
CONCLUSION
ADC values across the macroscopic tumor margin are robustly inversely correlated with HLA measures of tumor infiltration/cellularity at the microscopic level in this relevant preclinical model. This indicates that ADC is related to cellularity here, and is therefore a potentially useful biomarker of infiltrative phenotype. Spatial characterization could provide useful structural and heterogeneity information, although further experiments are required.Acknowledgements
Antoine Vallatos was funded by GEMRIC, the Glasgow Experimental MRI Centre.References
1. Jenkinson, M. D. et al.
(2007) J. Magn. Reson. Imaging, 26: 1405–1412. (doi:10.1002/jmri.21062)
2. Thompson, G. et al. (2009) Proceedings 17th Scientific
Meeting of the International Society of Magnetic Resonance in Medicine (ISMRM):
p2803
3. Thompson, G. et al. (2013) Proceedings 51st Annual
Meeting of the American Society of Neuroradiology (ASNR): p302
4. Eidel, O. et al. (2016) PLoS ONE 11(7): e0160250
5. Holmes, W. M. et al. (2017) Magnetic Resonance in Medicine, (doi:10.1002/mrm.26706) (PMID:28516482)
Figures