2114
Monitoring LPS-induced gray matter inflammation through endogenous contrasts: MT, CEST and NOEChenwang Jin1,2, Yanrong Chen1,3, Chenyan Chu1, Piotr walzcak1, and Xiaolei Song1
1Morgan Department of Radiology and Radiological Science, Cellular Imaging Section and Vascular Biology Program, Institute for Cell Engineering,The Johns Hopkins University School of Medicine, Baltimore, MD, United States, 2Medical Imaging, The First Affiliated Hospital of Xian Jiaotong University, Xian, China, 3School of information and technology,The Northwest University, Xian, China
Synopsis
Gray matter (GM) damage is a common phenomenon and clinically relevant in the onset and progression of many neuroinflammation diseases, including Multiple Sclerosis, Alzheimer’s Disease and Depression. However, conventional MRI techniques are insensitive to the detection of GM damage. Chemical exchange saturation transfer (CEST) is an innovative molecular MRI technique that bridges the tissue microstructure and cellular metabolic function, possibly allowing sensing metabolic changes. Our preliminary results suggest that NOE-MRI (Nuclear Overhauser Effect, NOE) may provide a novel biomarker in detection of slight inflammatory changes in cortex and deep GM and also potentially enable quantifing the diffusive GM damages.
Introduction:
Neuroinflammation plays an important role in the onset and progression of many neurological diseases including Multiple Sclerosis, Alzheimer’s Disease and Depression. Moreover, several studies have demonstrated, from the early phase of the brain inflammation, gray matter (GM) damage especially in cortex is a common phenomenon and clinically relevant1,2. However, conventional MRI techniques are insensitive to the detection of damages in cortical GM and deep GM. Chemical exchange saturation transfer (CEST) is an innovative molecular MRI technique that bridges the tissue microstructure and cellular metabolic function, possibly allowing sensing metabolic changes. In this study, we investigated how the endogenous CEST Zspectra method performs, in a mouse model setting with acute brain inflammation induced by intrastriatum injection of lipopolysaccharide (LPS).Method:
Focal neuroinflammation was induced by a unilateral intra-striatum injection of 10 μg LPS to striatum in C57/Bl6 mice (8-10 weeks, n=10) using a stereotactic device (Fig.1a). 24 hours later, MRI experiments were conducted using an 11.7T Bruker Biospec horizontal scanner, with protocols including endogenous CEST, T1w, T2w, Diffusion Weight Images (DWI),MTw and Post-Gadolinium T1w at the end. Specifically, CEST Zspectra were acquired using a continues waved saturation pulse of 1.0µT at 42 frequency offsets between +/- 4.0 ppm with 0.2 ppm increments and one reference offset (S0). Three pairs of ROIs (Fig.2b) were defined on T2w and placed manually on both the surgical side (ipsilateral) and the contralateral side covering cortex and deep GM by a certified neuro-radiologist. Then, CEST Zspectra were generated by plotting the normalized water signal (Ssat/S0) as a function of saturation frequency (freq.) offset, with the B0 inhomogeneity corrected by WASSR. According to their signal origins, the Z-spectra was divided into three segments: 1) freq. offsets between -1.6 ppm to -3.4 ppm depicting the Nuclear Overhauser Effect (NOE) mainly considered from the myelin lipid[3]; 2) offsets between 1.6 ppm to 2.2 ppm for the slow-exchanging guanidine amine contained in creatine; 3) offsets between 2.8 ppm to 3.2 ppm for the fast-exchanging amines in glutamate and proteins. According to the non/normal distribution of data,comparisons of the difference between the three segments in all the ROIs were evaluated by one-way analysis of variance or Kruskal-Wallis test.Result:
The data of one mouse were discarded due to massive intracerebral hemorrhage in the surgery side of brain. At 24 hours of post-surgery, T2w and DWI shows the line-like hyperintense lesions along (Fig.1b, arrow) and large hypersignal lesion on the end of needle track (Fig.1b.c, arrowhead) in the upper-left part of the right stratum. There are significantly enhanced Post-gadonilium T1w (Fig.1e) signal in the same region, with the enhanced region slightly extended comparing with T2w, suggesting the destructed brain blood barrier (BBB) region due to the inflammatory consequence. Moreover, a little acute hemorrhage in the central of lesion in upper-left part of the right striatum shows hypointense in T1w, T2w, DWI and Post-gadolinium T1w (Fig.1b-e). On the MTw (Fig.1f) and the three sat. weighted images (Fig.1g-i), the lesion in the right straitum and the needle track also are hyperintense similar to the T2w. But, beside those enhanced region, the three sat. weighted images also display a enhanced lesion region in the cortical GM (arrow), which are not shown on other images. The large inflamed region adjacent to the needle track on (Fig.1g-i, arrowhead) was confirmed by presence of numerous activated microglia in post-mortern immunohistology study (Fig.2a). We further quantified the endogenous CEST signal by removing the fitted water line from the experimental Zspectra (Fig.2c), with the extracted NOE signal displaying largest difference between ipsilateral and contralateral GM. (ROI 3 and ROI 4). Furthermore, we analyzed the signal difference between Z-spetra of the ipsilateral ROIs and their mirrored ones on the contralateral side (Fig.2d). Indeed, Z-spectra signal at NOE part show highest difference between each pair of ROIs,especially between ROI 3 and 4 (~3-4% of total water signal) (p<0.01, n = 9). The NOE signals, quantified by either the method in Fig.2c or the conventional MTRasym, show statistically difference (p<0.05) between NOE group and MTRasym group in the each pair of ROIs (Fig.2e). Although the NOE contrast was displayed in a broad frequency range, and sometimes considered due to MT effect. However, in this study the conventional MTR differences were not statistically significant (p > 0.05).Conclusion:
Our preliminary results suggest that NOE-MRI may provide a novel biomarker in detection of slight inflammatory changes in cortex and deep GM and also potentially enable quantifing the diffusive GM damages.Acknowledgements
NIH R21EB020905References
- Harrison N A, Cooper E, Dowell N G, et al. Quantitative Magnetization Transfer Imaging as a Biomarker for Effects of Systemic Inflammation on the Brain[J]. Biological Psychiatry, 2015, 78(1):49-57.
- MarcoVercellino, SilviaMasera, MarcellaLorenzatti, et al. Demyelination, Inflammation, and Neurodegeneration in Multiple Sclerosis Deep Gray Matter[J]. Journal of Neuropathology & Experimental Neurology, 2009, 68(5):489.
- van Zijl, P.C.M., W.W. Lam, J. Xu, L. Knutsson, and G.J. Stanisz, "Magnetization Transfer Contrast and Chemical Exchange Saturation Transfer MRI. Features and analysis of the field-dependent saturation spectrum." Neuroimage (2017), doi:10.1016/j.neuroimage.2017.04.045.
Figures
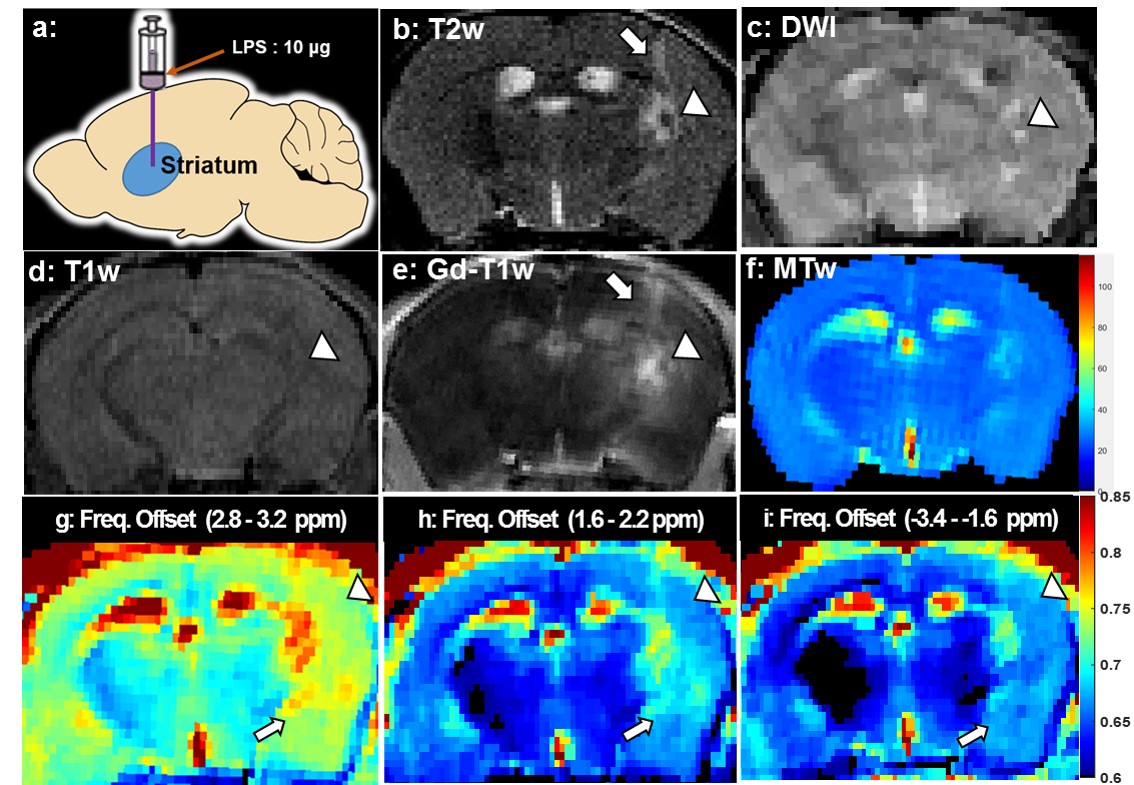
Fig.1 a)illustration of animal model; (b-e): Conventional MRI and
parametric maps of the 24h MR scan post LPS-injection. T2w shows line-like
hyperintense lesions along the needle track (b, arrow) and a little of acute
heaemorrhage on the upper-left part of the right stratum(b,c, arrowhead); (e)
Brain blood barrier was destructed due to the inflammatory consequence which is
significantly enhanced in the more diffusive region around the injection site; (f-i) Beside those hyperintense lesions in conventional MRI, the three
sat. weighted images at further display enhanced contrast in the cortex (arrow),
with their freq. range corresponding to fast-exchanging amines(g),
slow-exchange amines(h) and myeline lipid(I), respecitvely.
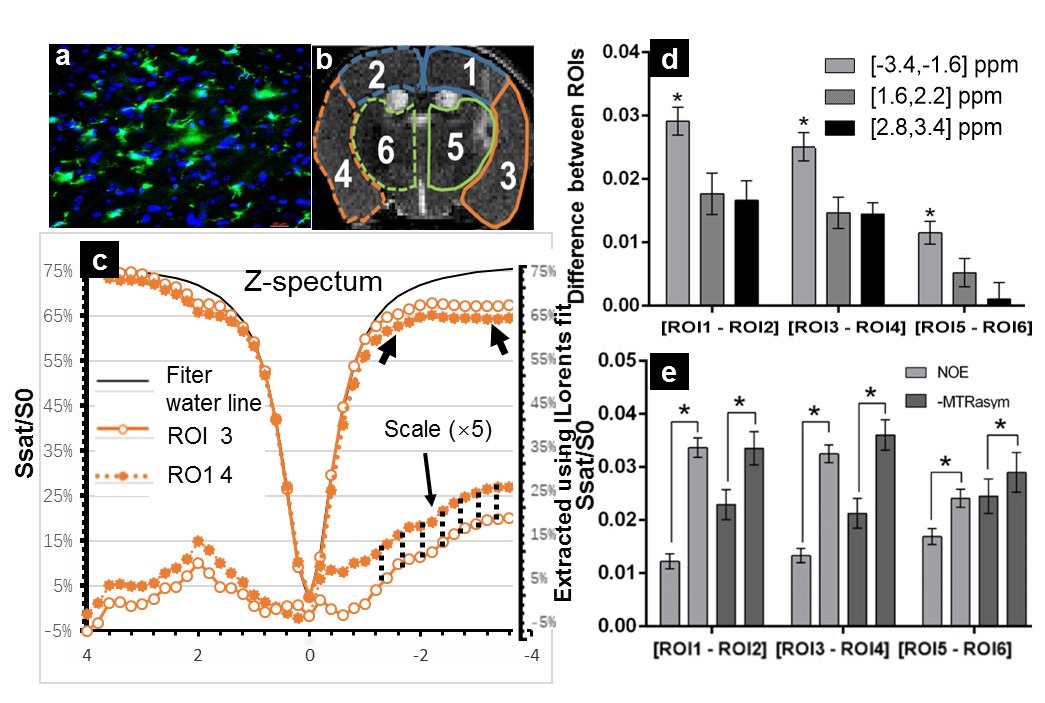
Fig.2 (a) Shows on the surgical
cortex adjacently to the needle track, presence of
numerous activated microglia in post-mortern immunohistology; (b) Indicate three
pairs of ROIs were manually defined on the T2w; (c) the endogenous CEST signal was
quantified by removing the fitted water line from the experimental Zspectra,
with the extracted NOE signal displaying largest difference between ROI3 and
ROI4; (d) Shows a characteristic difference (p<0.05) of CEST effect from freg.
offsets between -1.6 to -3.4ppm than other two segments(1.6:2.2; 2.8:3.2) in
each pair of ROIs; (e) Shows statistically difference (p<0.05) between NOE and MTRasym group in the each of ROIs of monitoring neuroinflammation.