2107
Simian immunodeficiency virus infection transiently increases brain temperature in rhesus macaques as detected with magnetic resonance spectroscopy thermometry1McLean Imaging Center, McLean Hospital, Belmont, MA, United States, 2Harvard Medical School, Boston, MA, United States, 3Martinos Center for Biomedical Imaging, Massachusetts General Hospital, Charlestown, MA, United States
Synopsis
Our prior proton Magnetic Resonance Spectroscopy (MRS) studies in Simian Immunodeficiency Virus (SIV)-infected macaques reported higher brain choline and myo-inositol levels at 2 weeks post-infection, suggestive of ongoing inflammation. As brain inflammation has been associated with brain hyperthermia, we used Magnetic Resonance Spectroscopy Thermometry retrospectively to determine whether SIV infection increases brain temperature. At 2 weeks post-infection, we detected increased brain temperature in the frontal and parietal cortex, basal ganglia, and in white matter, relative to pre-infection temperatures. Brain temperatures were strongly correlated with choline levels, suggesting that SIV transiently increases brain temperature by increasing brain inflammation.
Introduction
Human Immunodeficiency Virus (HIV) infection induces a cascade of deleterious processes resulting in neuronal injury and apoptosis, which can lead to neurological disorders known as neuroAIDS and HIV-Associated Neurocognitive Disorders (HAND). The rhesus macaque Simian Immunodeficiency Virus (SIV) model is well-established and facilitates studies of disease progression, as well as efficacy assessments of novel interventions. In vivo Magnetic Resonance Spectroscopy (MRS) permits noninvasive, longitudinal measurements of brain chemistry and physiology, including changes induced by SIV [1,2,3,4]. Previously, we used MRS in SIV-infected macaques to detect complex temporal and regional changes of choline (Cho) concentrations, which increased two weeks post infection (wpi), then decreased to near-normal levels at 4 wpi, followed by elevations at later time points [3,4]. The Cho increase could reflect ongoing inflammation [5,6]. Cho elevations were found to be associated with increased levels of inflammation biomarkers in SIV [3,7] and HIV [5,8] studies. As inflammation has been linked to cerebral hyperthermia [9,10], we hypothesized that SIV could also induce brain hyperthermia. We performed a retrospective MRS thermometry analysis using the method of Zhu et al. [11] to determine whether SIV also induces brain hyperthermia.Methods
Study methods were published in detail previously [1,2,4]. Sixteen adult rhesus macaques were included in the current analysis. After baseline MRS scans, animals were inoculated with SIV-mac251 virus (10 ng SIVp27, i.v.) and their CD8 lymphocytes were depleted with an antibody (cM-T807) administered, 6, 8, and 12 days post-inoculation. Proton (1H) MRS PRESS (point-resolved spectroscopy) traces (TR/TE=2.5s/30ms, 192 averages) and associated unsuppressed water reference traces were acquired at a magnetic field strength of 3T (Siemens Magnetom TIM Trio) using a circularly polarized transmit-receive extremity coil. Spectra were obtained from four voxels: Basal Ganglia (BG), Parietal Cortex (PC), Frontal Cortex (FC), and White Matter (WM). LCModel was used to estimate metabolite concentrations. Temperatures were estimated from the 1H frequency difference between N-acetylaspartate (NAA) and the unsuppressed water (H2O) peak according to the equation Tbrain(oC) = 36.0 – 103.80 x (δH2O(ppm) – δNAA(ppm) – 2.6759) [11]. MRS traces were imported to Matlab using custom code based on Siemens RDA reader from the VESPA project [12]. Custom code was also written to locate the NAA and water peaks.Results
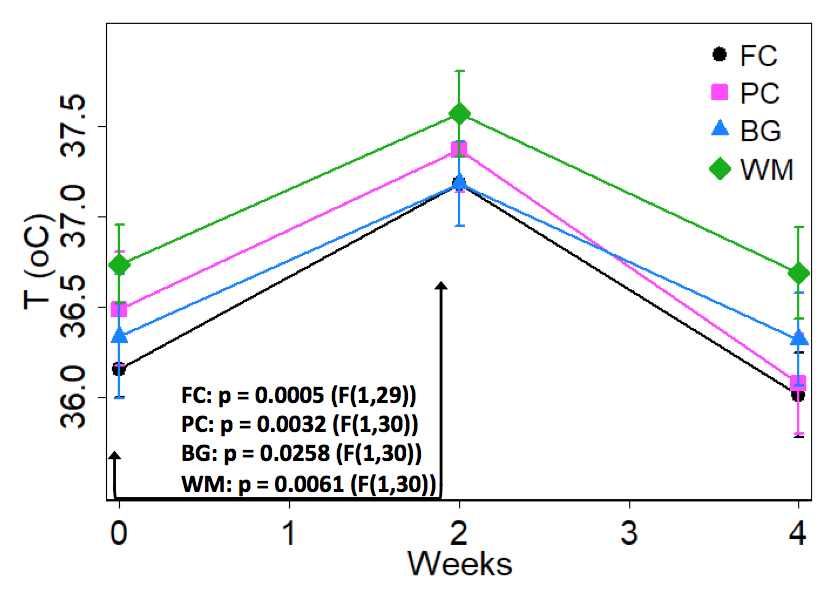
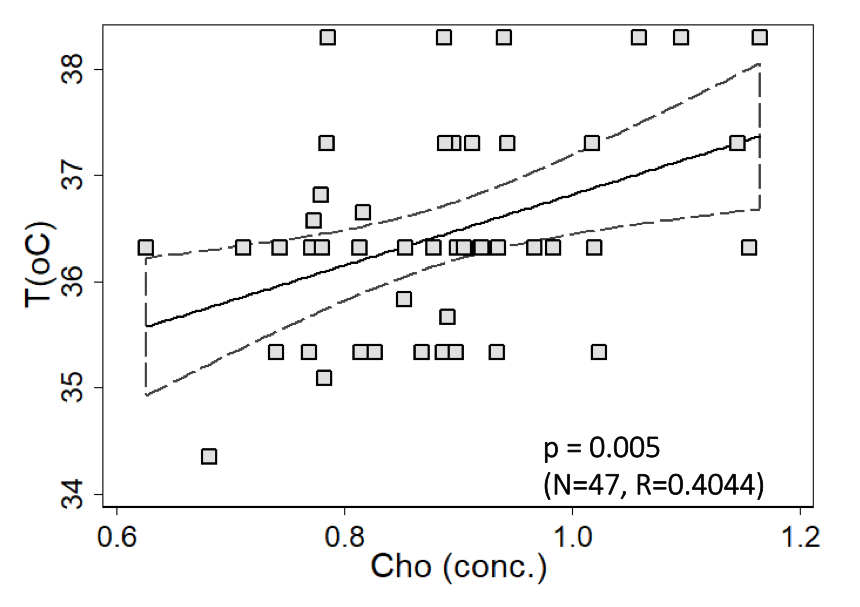
In all four brain regions, temperature was significantly elevated 2 wpi relative to 0 wpi (baseline) and 4 wpi. Figure 1 shows the mean profiles of temperature up to 4 wpi (mean value +/- SE). Reported p-values are from post hoc comparisons of 2 wpi temperature values to baseline (repeated-measures ANOVA, uncorrected). The FC, PC, and WM post-hoc comparisons survive Bonferroni correction. A representative graph of Cho-temperature covariation up to 4 wpi is shown in Figure 2 (FC voxel). The linear relationship is significant at p=0.005 (Pearson R=0.4044). Similar relationships were found in other brain regions PC: p=0.005, R=0.4029, WM: p=0.0012, R= 0.4579, and BG: p=0.046, R= 0.2921.Discussion & Conclusion
We performed a retrospective MRS thermometry analysis of SIV-infected rhesus macaques in four brain regions. All regions showed a transient temperature increase at 2 wpi, which temporally correlated with brain Cho changes, suggesting that SIV transiently increases brain temperature by increasing brain inflammation. In light of our previous thermometry analysis showing frontal cortex hyperthermia in mice induced to express HIV-Tat protein [13], it appears that MRS thermometry is informative in HIV models, and may be useful for assessing effects of novel treatments that reduce inflammation, such as minocycline [1].Acknowledgements
DM and MJK gratefully acknowledge support from R01DA039044 and the McLean Hospital Brain Imaging Center. NIH grants R21NS059331 (EMR), R01NS050041 (RGG), R01NS040237 (KW), R01NS37654 (KW), and RR00168 (NEPRC Base Grant). Depleting anti-CD8 (human recombinant, cM-807) used in these studies were provided by the NIH Nonhuman Primate Reagent Resource (R24 RR016001, N01 AI040101).References
[1] Ratai EM et al, PLoS One. 2010 May 7;5(5). [2] Campbell JH et al, PLoS One. 2011 Apr 6;6(4). [3] Kim JP et al. AJNR Am J Neuroradiol. 2005 Apr;26(4):752-9. [4] Ratai EM etl. Magn Reson Med. 2011 Sep;66(3):625-34. [5] Anderson AM et al. J Acquir Immune Defic Syndr. 2015 May 1;69(1):29-35. [6] Chang L et al. J Neuroimmune Pharmacol. 2013 Jun;8(3):576-93. [7] Ratai et al., Proc. ISMRM 2011; 19:4184. [8] Valcour V et al. J Infect Dis. 2012 Jul 15;206(2):275-82. [9] Sungren-Andersson AK et al. Neuroimmunomodulation 1998 5:241-247. [10] Imeri L et al. Brain Behav Immun 2008 18:399-404. [11] Zhu M et al. Magn Reson Med. 2008 Sep;60(3):536-41. [12] https://scion.duhs.duke.edu/svn/sample_data/siemens_rda_export/read_rda102.m. [13] McLaughlin JP et al. Biol Psychiatry Cogn Neurosci Neuroimaging. 2017 Oct;2(7):599-609.Figures