2105
Quantitative T2 mapping can reliably detect the retention of Omniscan in the rat brainSerguei Liachenko1, Natalya Sadovova1, Sherry Ferguson1, Joseph Hanig2, Zhen He1, Merle G Paule1, Olayinka Dina3, Anthony Fotenos3, Adebayo Laniyonu3, and Ira Krefting3
1Neurotoxicology, NCTR / FDA, Jefferson, AR, United States, 2OTR, CDER / FDA, White Oak, MD, United States, 3DMIP, CDER /FDA, White Oak, MD, United States
Synopsis
Current methods of investigating brain retention of gadolinium-based contrast agents use T1-weighted MRI, and rarely T1 quantitative mapping. The former does not provide easily quantifiable data and the latter require prolonged scanning time. We proposed the use of a simple ‘off-the-shelf’ T2 mapping technique to reliably quantify relaxation changes in the rat brain due to gadolinium accumulation. The sensitivity of this method is much better compared to the commonly used T1-weighted MRI.
Introduction
Brain retention of some gadolinium-based contrast agents (GBCAs) has been reported in patients and laboratory animals after multiple doses1. However, the current methods for investigation of this phenomenon are mainly based on relative signal intensity changes in T1-weighted MRI (T1w). Quantitative relaxometry may provide more precise tool for animal studies. Here, we propose using quantitative T2 mapping to study brain retention of GBCAs in rats at 7 tesla field strength.Methods
The animal use protocol was approved in advance by the NCTR IACUC. Male Sprague-Dawley rats (N = 12, 108 ± 3 days old, 480 ± 32 g) were surgically implanted with jugular vein catheters with externalized injection ports (Rat-O-Port, Braintree Scientific, Inc). Six rats received Omniscan injections (0.62 mmol/kg, iv) over 5 weeks (4 injections/week, 20 total) and six rats were injected with saline using the same injection regime and volume (1.24 ml/kg). Brains were imaged before the start of treatment and weekly thereafter (6 scans/subject). MRI was performed using a 7 tesla Bruker Biospec AV III equipped with 12 cm ID gradient insert (440 mT/m) and 38 mm litz-cage quadrature RF coil (Doty Scientific, Inc). The following MRI protocols were used: 1) T1w fast spin echo sequence, similar to 2: TR = 700 ms, TE = 8.4 ms, MTX = 192 × 192, RARE = 2, FOV = 3.84 × 3.84 cm, 28 slices, 1 mm slice thickness, acquisition time ~ 5 min; 2) T2 mapping spin echo sequence, as described in 3: TR = 6000 ms, TE = 15 ms, ETL = 12, MTX = 192 × 192, FOV = 3.84 × 3.84 cm, 28 slices, 1 mm slice thickness, acquisition time ~20 min. Both T1w and T2 images were acquired using the same geometrical coordinates, so they were intrinsically co-registered. T2 maps were calculated off-line as described in 3. Before each MRI scan, open field locomotor activity was assessed. At the end of the observation, rats were perfused trans-cardially with 4% paraformaldehyde as described in 4 for follow-up histopathological evaluation of the brain. The regions of interest (ROIs), which delineated deep cerebellar nuclei (DCN)2 were drawn manually on T2 maps as they provided better contrast than T1w for visual boundary detection. As both T1w and T2 maps were co-registered for each rat, the same ROIs were used to quantify T2 values and T1w image intensities. Additionally, T1w image intensities in ROIs were normalized against adjacent cerebellum signals (by shifting ROIs upwards by 8 pixels, 1.6 mm – reference ROI) as suggested in 2. The ratios of T1w signal intensities from the ROI of interest to the reference ROI are presented. Statistical analysis was performed using repeated measures ANOVA.Results
Figure 1 shows an example of manual ROI positioning (red) on T2 maps and T1w images and shifted reference ROI (green) on T1w images. Figure 2 shows that quantitative T2 mapping could positively detect the accumulation of Omniscan in DCN of rats’ brains, starting from week 3 of dosing (*), whereas the T1w approach could detect the contrast changes only at 5 weeks, and showed overall larger scattering and less dynamic range. Cohen’s effect size was much higher using the T2 mapping method (7.53) vs. the T1w method (2.97) at the 5 week point. There was a moderate negative correlation between T2 values and T1w signal intensity ratio (R = -0.574, P= 0.00002). These results suggest that even though Omniscan is predominantly a T1 agent, T2 effects are more readily detectable in the current settings. Moreover, T2 mapping provides intrinsically quantitative data, which is less prone to errors related to imaging setup (e.g., RF coil homogeneity among others) as well as to errors due to image analysis (no need for reference ROI for ratio calculations). In addition, the known change in T2 relaxation due to GBCAs retention could be roughly translated into its concentration in the tissue. Given the R2 relaxivity of Omniscan in human plasma at 7T of 3.09 mmol/L 5, its concentration is estimated at ~0.39 mmol/L in DCN. Omniscan did not alter open field locomotor activity or cause any detectable histological brain abnormalities.Conclusion
Repeat dosing with Omniscan has been demonstrated to lead to its retention in the DCN of the rat brain and quantitative T2 mapping provides a robust method for its quantification. Further studies with the additional GBCAs are warranted.Acknowledgements
This work was supported by the National Center for Toxicological Research (NCTR), US FDA (protocol number P00802).References
- Olchowy, C., et al., The presence of the gadolinium-based contrast agent depositions in the brain and symptoms of gadolinium neurotoxicity - A systematic review. PLoS One, 2017. 12(2): p. e0171704.
- Robert, P., et al., T1-Weighted Hypersignal in the Deep Cerebellar Nuclei After Repeated Administrations of Gadolinium-Based Contrast Agents in Healthy Rats: Difference Between Linear and Macrocyclic Agents. Invest Radiol, 2015. 50(8): p. 473-80.
- Liachenko, S. and J. Ramu, Quantification and reproducibility assessment of the regional brain T2 relaxation in naive rats at 7T. J Magn Reson Imaging, 2017. 45(3): p. 700-709.
- Hanig,
J., et al., The use of MRI to assist the
section selections for classical pathology assessment of neurotoxicity.
Regul Toxicol Pharmacol, 2014. 70(3):
p. 641-7.
- Noebauer-Huhmann, I.M., et al. MR Contrast Media at 7 Tesla - Preliminary Study on Relaxivities. in ISMRM. 2008.
Figures
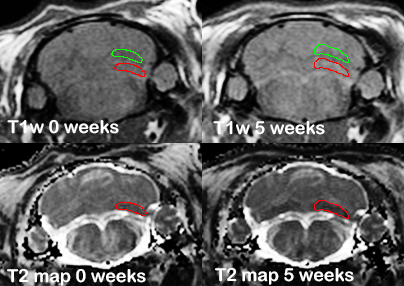
Figure 1. Representative T1w (top)
and T2 map (bottom) images of the same rat before (left) and after
the end of Omniscan dosing (right). Manual ROI drawn on T2 map (red)
was copied to T1w (red) and shifted 1.6 mm upwards – reference ROI
(green).
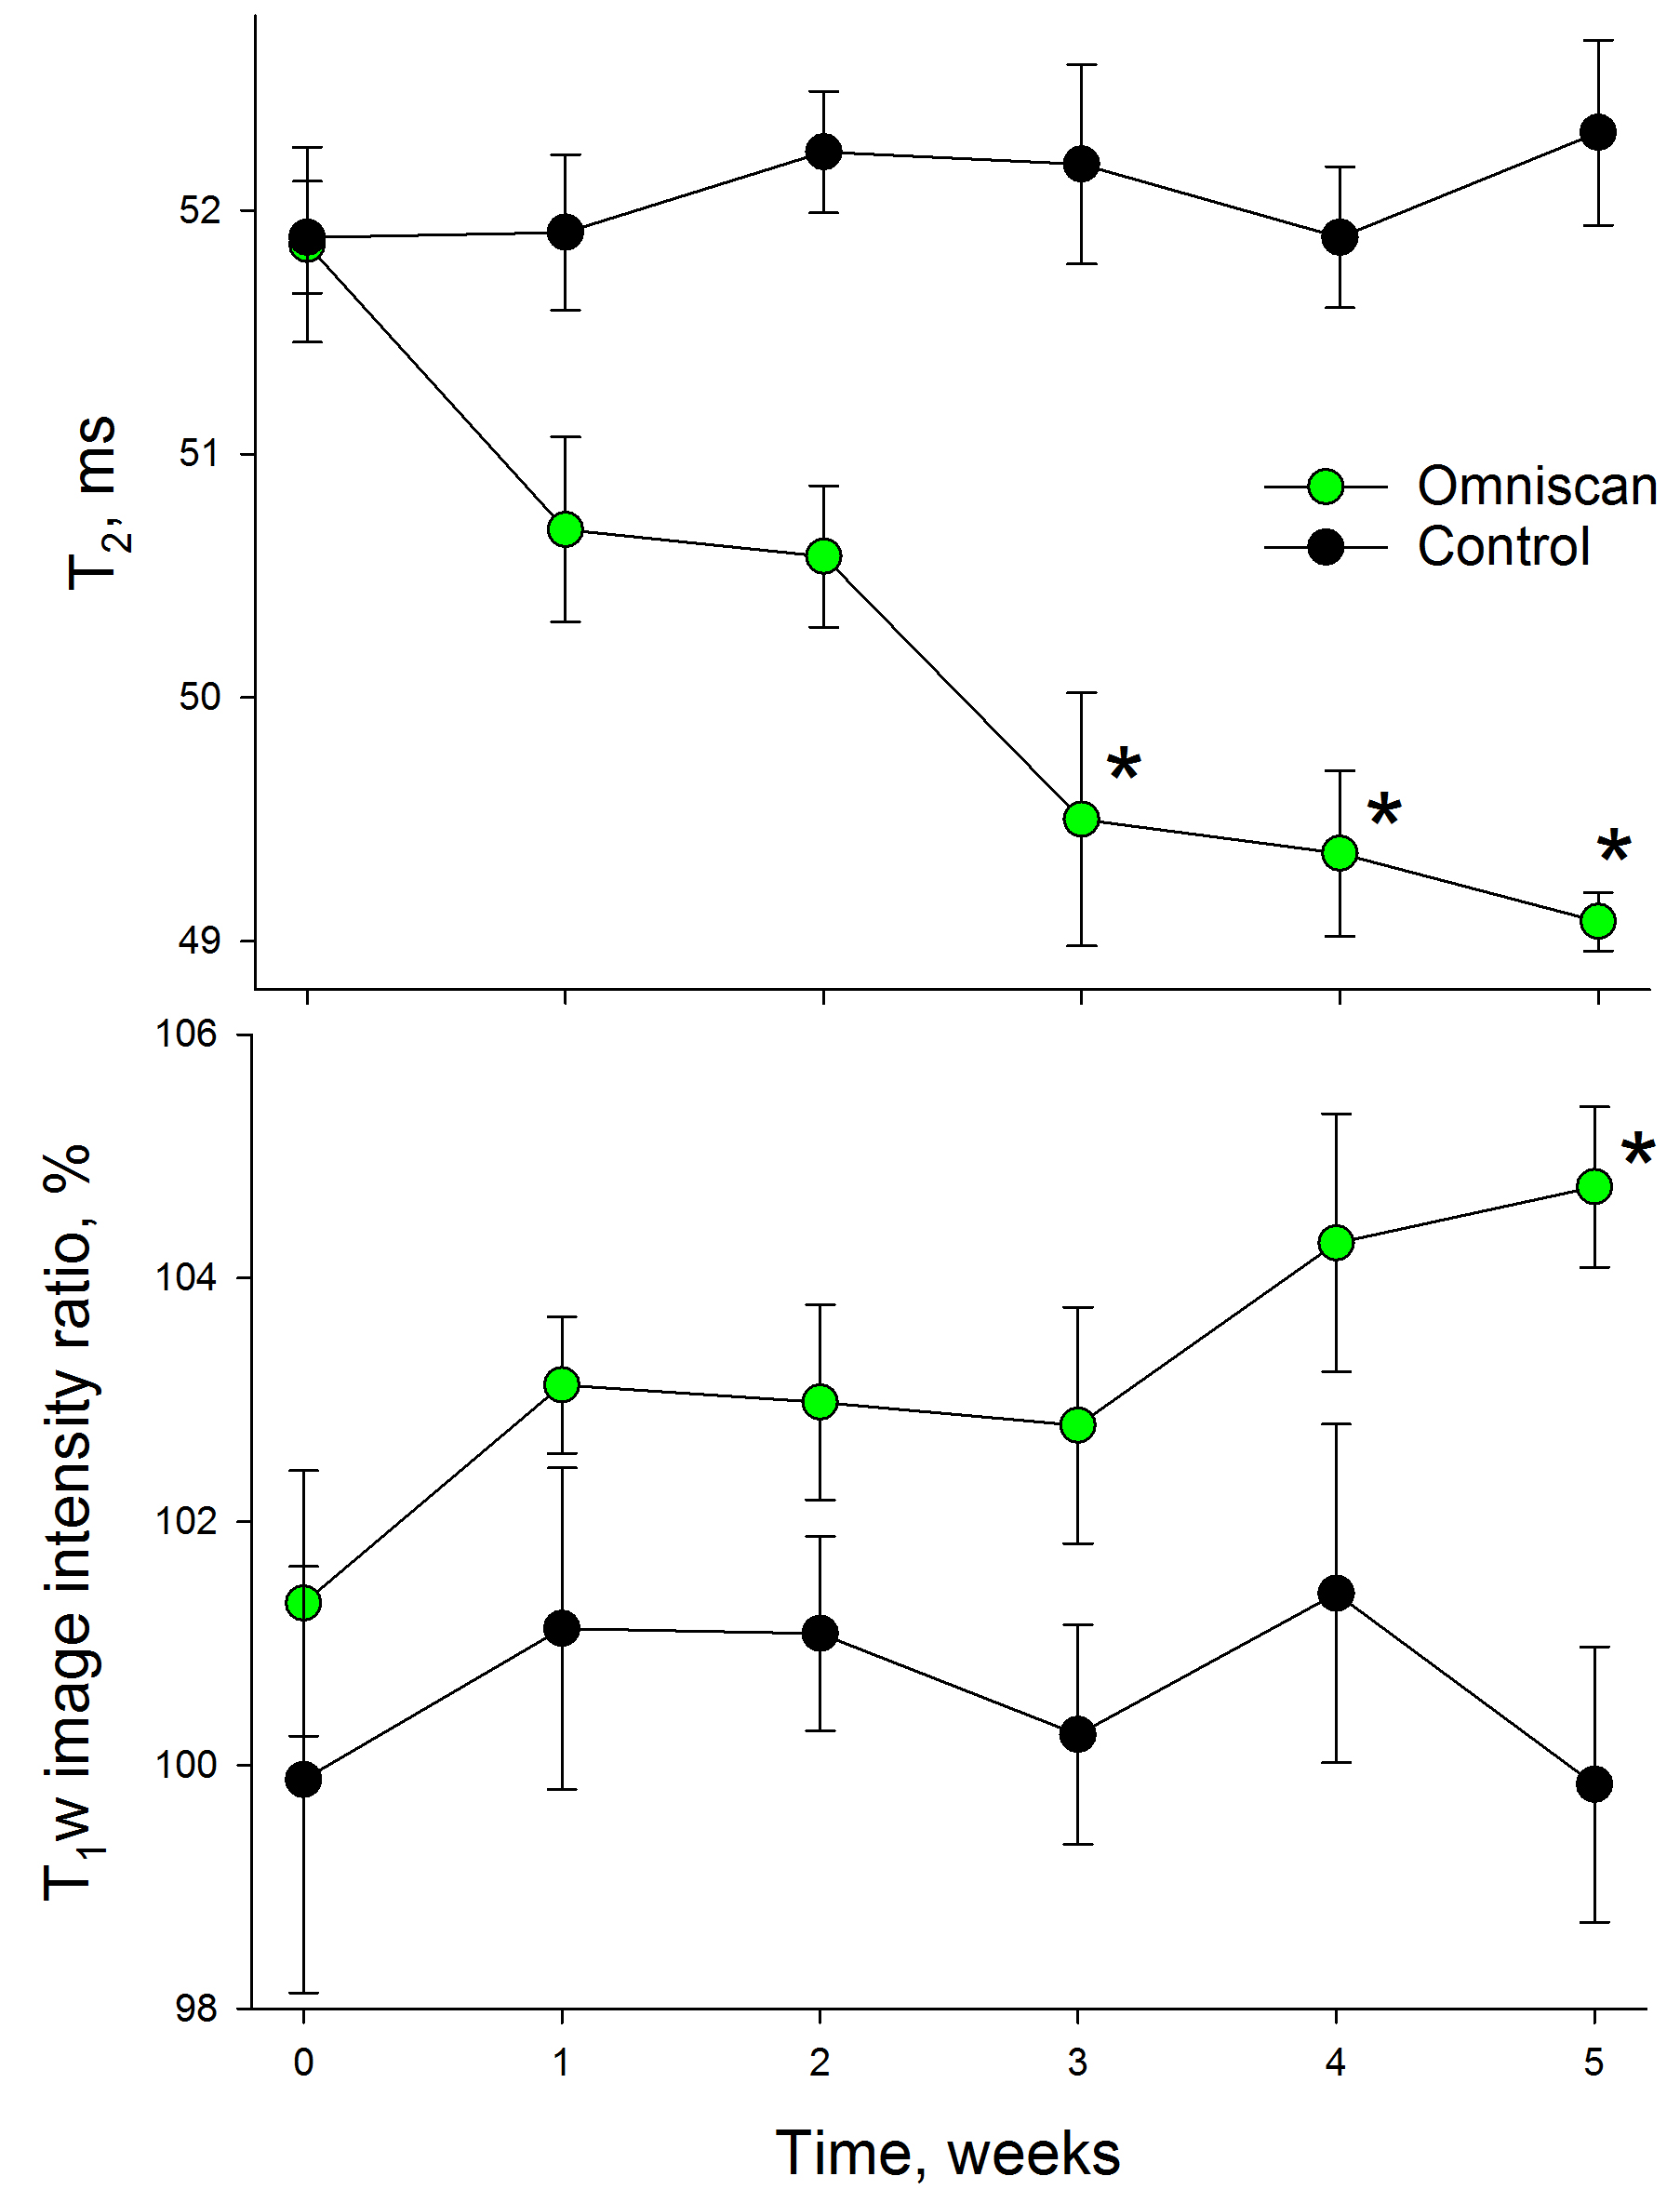
Figure 2. * - statistically significant difference between groups.