2102
Thin Slab Cerebral Quantitative Susceptibility Mapping1Institute of Medical Informatics, National Cheng Kung University, Tainan, Taiwan, 2Department of Computer Science and Information Engineering, National Cheng Kung University, Tainan, Taiwan, 3Department of Automatic Control Engineering, Feng-Chia University, Taichung, Taiwan
Synopsis
Quantitative susceptibility mapping has been a useful tool to monitor magnetic properties of the tissues. Conventional QSM uses thick slab volumetric scan to ensure accurate deconvolution of the dipole kernel for susceptibility estimation. The requirement of large volume coverage and appropriate resolution lead to very long scan time, which has limited QSM’s integration in a clinical protocol. After inspecting dipole kernel’s property, the present work hypothesized QSM should still be performed with a thinner slab to reduce scan time. The results suggest that the reconstructed susceptibility from a whole brain and a thin-slab scan is highly correlated with conventional QSM and the scan time can be reduced up to 4 times.
Purpose:
Quantitative susceptibility mapping has been exploited to discover cerebral tissue properties and to reflect pathologies especially when iron deposition is involved such as parkinson’s disease and multiple sclerosis 1,2. Conventional cerebral QSM requires a 3D whole brain coverage to ensure accurate estimation of local field and the dipole deconvolution. When both spatial coverage and spatial resolution are on demand, long scan time can be expected, which also limits its application in clinical practice. In some cases, the lesion that requires investigation with QSM may only occupy small space. Therefore if a thin slab scan can also retain fair QSM value, it will shorten scan time and makes QSM more favorable to the clinical use.
After investigating the spatial influence of a magnetic dipole, we hypothesized that a thin slab may be feasible due to fast decay of the field from a dipole. The present study aimed at investigating how QSM would be altered in a thin slab scan and to examine its feasibility.
Material & Methods:
The volunteer experiments (N=3) to compare different volumetric coverage for QSM were scanned by an IRB-approved protocol on a 3.0T scanner (GE Discovery MR750) following informed consent. The sequence parameters for the 3D multi-echo gradient echo sequence were FOV = 224 mm, slice thickness =0.7 mm, matrix size = 224*224*200, FA = 15°, 6 echoes with 4ms echo spacing from 3.5 ms. Thin slab acquisition was simulated by replacing zeros in the voxels on the two sides along SI direction. Three conditions, 100%, 50% and 25% of volumetric coverage, are compared.
The QSM reconstruction was conducted following these steps. The background field is removed by Projection onto Dipole Field3 after phase unwrapping was applied to the field map. Subsequently the susceptibility map was calculated according to the local field by $$\chi = min_\chi |F^HDF\chi -B|^2 +\lambda^2 |\Psi B|^2 $$ ,where $$$\chi$$$ is the estimated susceptibility, F is the Fourier operator, D is the dipole kernel in k-space and $$$\Psi$$$ is the estimated image boundaries from the magnitude information, and B is the PDF reconstructed local field4. For the results in the present abstract, $$$\lambda$$$ was set to 10-0.9 for all the reconstructions. The QSM from 100% volume coverage of each subject is regarded as a reference standard. Discrepancies are quantified by the difference and cross correlation of the thin slab QSM with its reference counterpart.
Results:
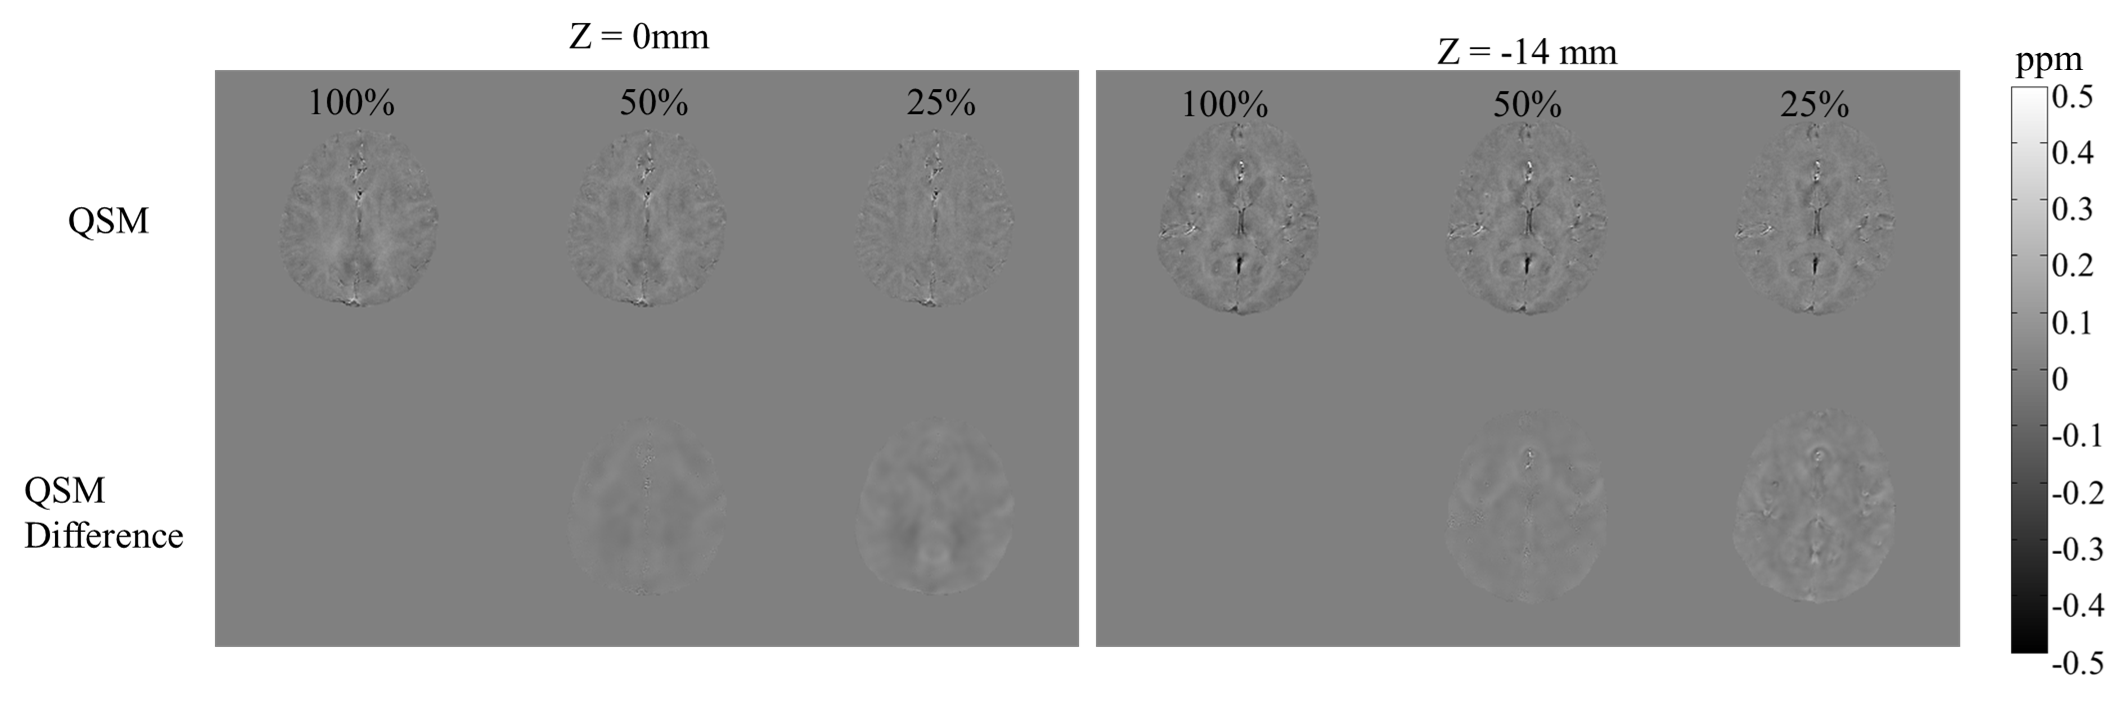
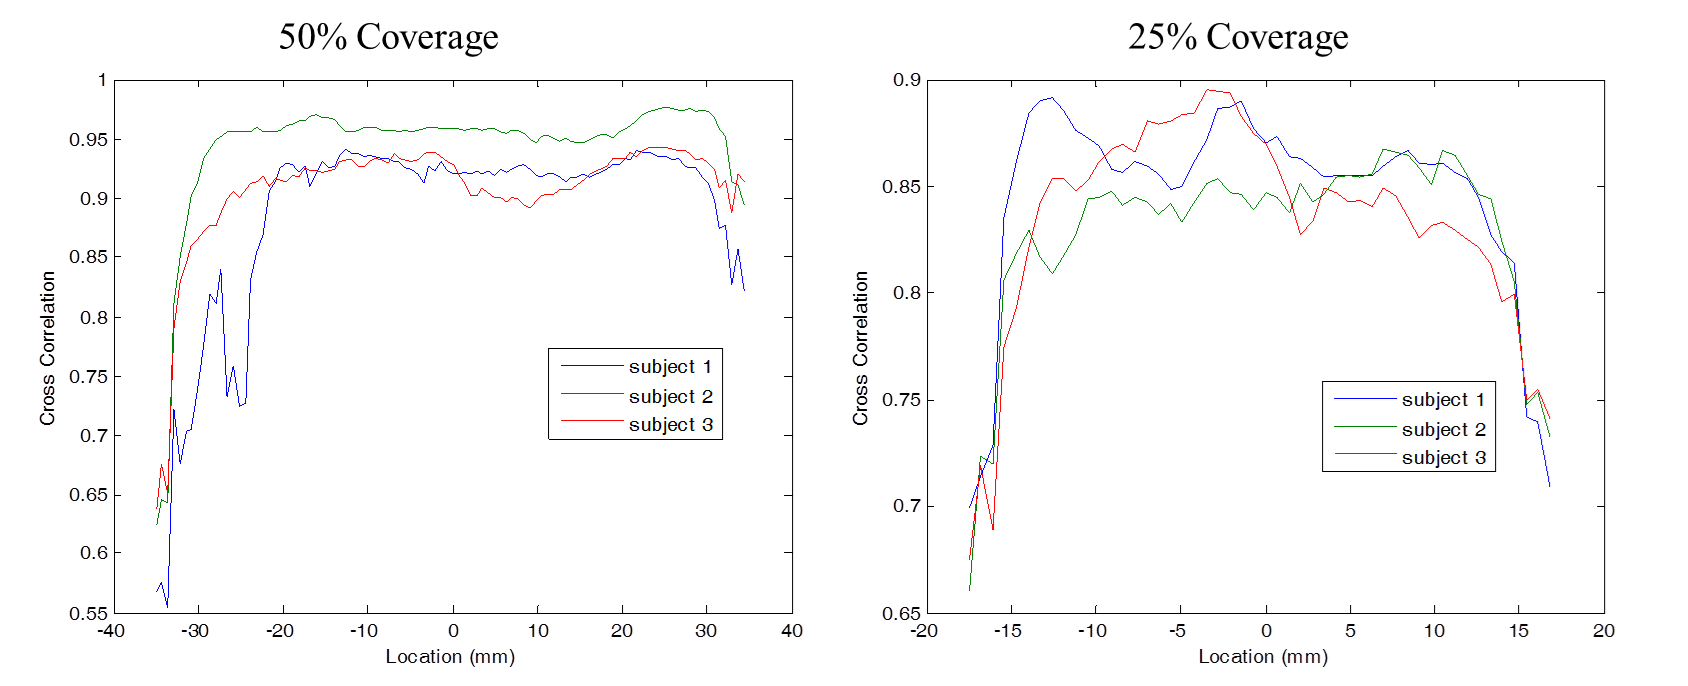
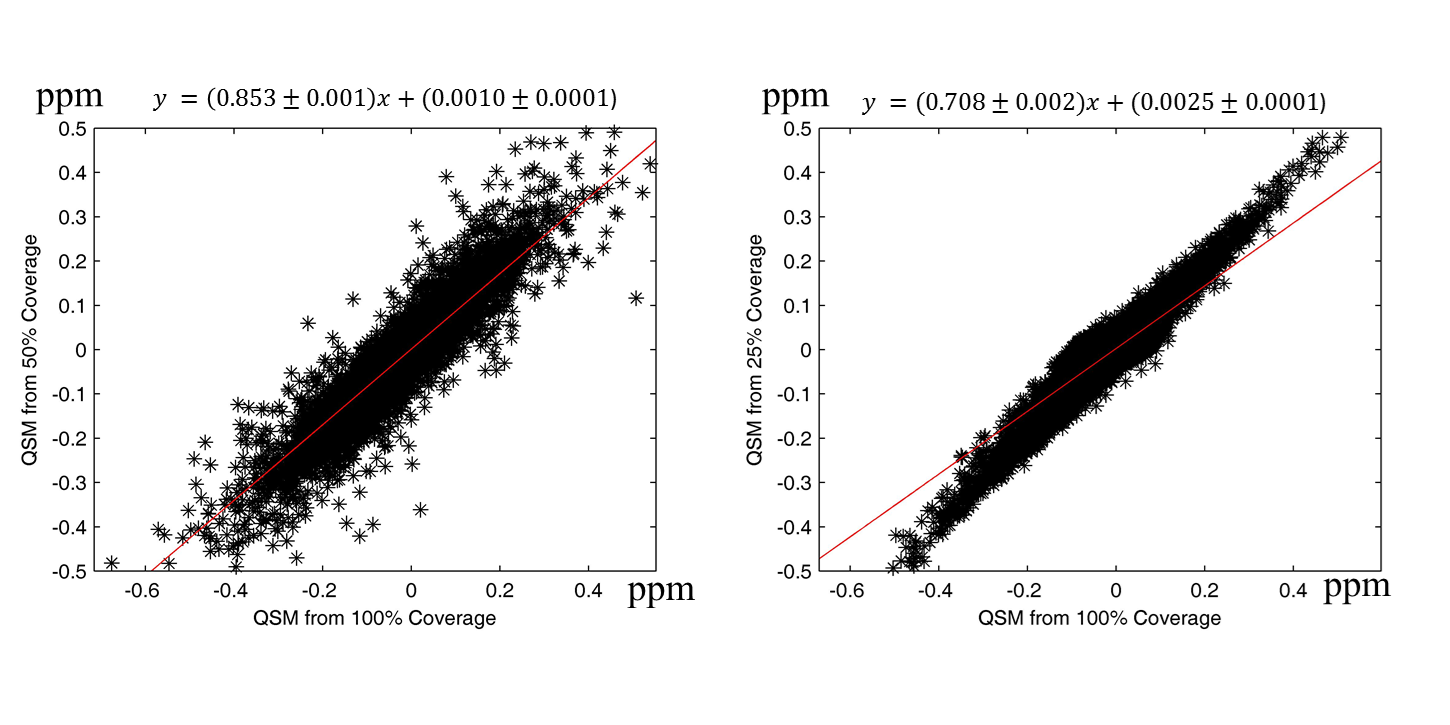
The location of the central slice was set as the reference coordinate. Fig 1. shows the reconstructed QSM at different conditions and their differences comparing to the reference standard. At z=-14mm, the slice in the 25% was at the boundary of the volume leading to severe tissue dependent discrepancies. On the other hand the slices away from the boundary shows little tissue dependent structure in the error map. The cross correlation coefficients of the slices comparing volumetric coverage of 50% vs 100% and 25% vs 100% for the test subjects are plotted in Fig.2 . It can be noticed that regardless of the slice coverage, volume around 1cm near the boundary of each slice should be ignored. A voxel-wise comparison among the thin slab acquisition and the reference is plotted in Fig 3 with boundary slices discarded. The fitted equation having little intercept with a slope close to 1.Discussion and Conclusions:
The present study compares the reconstructed QSM estimated from the whole brain data and its thin slab simulations. The results demonstrated good linear correspondence among the thin slab acquisitions and the whole brain QSM. Based on the findings, the thin slab QSM is expected to have similar quality to the whole brain QSM after appropriate linear correction. In conclusion, thin slab QSM can be scanned in much smaller time than conventional QSM acquisition and it also has good linear correspondence to the whole brain QSM.Acknowledgements
Support from MOST grants, 105-2314-B-006 -044 -MY2, 106-2221-E-006-068, and 105-2221-E-035 -049 -MY2 and Mind Research and Imaging Center is acknowledged.References
1. Langkammer, C., et al., Quantitative susceptibility mapping (QSM) as a means to measure brain iron? A post mortem validation study. Neuroimage, 2012. 62(3): p. 1593-9.
2. Zheng, W.L., et al., Measuring iron in the brain using quantitative susceptibility mapping and X-ray fluorescence imaging. Neuroimage, 2013. 78: p. 68-74.
3. Liu, T., et al., A novel background field removal method for MRI using projection onto dipole fields (PDF). NMR Biomed, 2011. 24(9): p. 1129-1136.
4. Lin, P.Y., T.C. Chao, and M.L. Wu, Quantitative susceptibility mapping of human brain at 3T: a multisite reproducibility study. AJNR Am J Neuroradiol, 2015. 36(3): p. 467-74.
Figures