2101
DCE-MRI texture analysis based on whole tumor volume for differentiating atypical from typical pituitary adenomas1Radiology department, First Affiliated Hospital of Dalian Medical University, Dalian, China
Synopsis
The angiogenesis and microvascular permeability of atypical pituitary adenomas were quantitatively analyzed using DCE-MRI texture analysis based on whole tumor volume.
Introduction
The WHO classification system for pituitary endocrine tumors categorizes them as typical adenomas, atypical adenomas and pituitary carcinomas[1]. Patients with atypical pituitary adenoma might require closer clinical and radiological surveillance and postoperative chemoradiotherapy than typical ones[2]. Although angiogenesis is an essential process in tumor growth and aggressiveness has been confirmed, and several biomarkers have been published[3-4], but so far, no markers can provide an accurate correlation between radiological and histopathological findings. A number of investigators have demonstrated that DCE-MRI can aid in observing the microvascular permeability. Texture analysis providing textural features, results in the quantification of gray-level intensity and spatial variation, that characterize the intrinsic structure of the tumors.Methods
Thirty-seven patients with pituitary tumor confirmed pathologically were divided into typical (n=14) and atypical group (n=24) according to the classification criteria of endocrine tumors of WHO in 2004. MR Imaging was performed on a 3.0T GE scanner, including DCE-MRI scanned with LAVA-Flex of 30 phases.
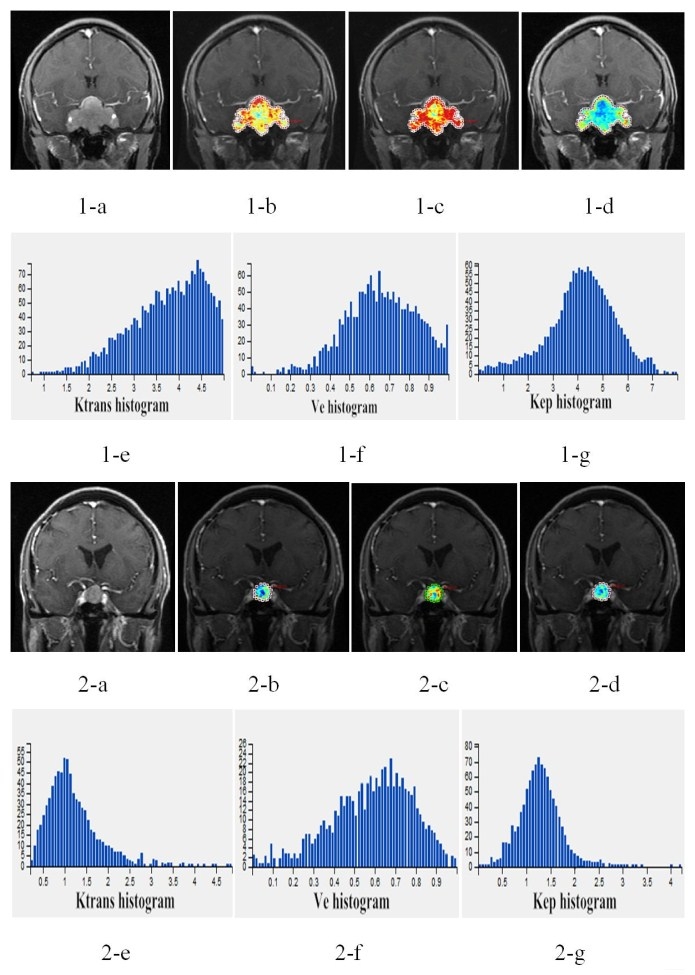
DCE-MRI Data were processed with Omni-Kinetics software. 3D ROIs containing the entire tumor were drawn in each slice. All texture parameters were measured by two neuroradiologists.
Two independent samples t-test and ANOVA, and Mann-Whitney U test were used to analyze the difference of DCE-MRI texture parameters between the two groups. ROC curve was used to assess the differential diagnostic ability of all significant parameters between two groups. Logistic regression analysis was used to obtain the best joint variables for distinguishing them.
Results
Max intensity, mean value, the 50th, 75th, 90th and 95th percentiles, range and uniformity of Ktrans of atypical group were significantly increased than typical group(all P<0.05).The mean value is best parameters of Ktrans for distinguishing atypical from typical ones with AUC of 0.817.
Relative deviation of Ve were higher in atypical group than typical one(P=0.004), whiles entropy was significantly decreased in typical group(P=0.025).The relative deviation is best parameters of Ve for distinguishing atypical from typical ones with AUC of 0.786.
Max intensity, the 90th and 95th percentiles, range and relative deviation of Kep of atypical group were also higher than typical group(all P<0.05);The relative deviation is best parameters of Kep for distinguishing atypical from typical adenomas with AUC of 0.767.
With logistic regression, we obtained the joint variable as a result of the combination by the mean value of Ktrans, relative deviation of Ve and Kep with AUC of 0.941.
Discussion
In our study,Max intensity, mean value, the 50th, 75th, 90th and 95th percentiles of Ktrans has significantly difference between atypical and typical adenomas, which illustrate that Ktrans in high zone is more meaningful. In addition, the range of Ktrans and Kep, and uniformity of Ktrans of atypical adenomas was increased demonstrate the permeability of vascular in atypical adenomas were variety, the extent of vascular wall maturation varies greatly. Relative deviation is used to describe the degree of data dispersion, atypical adenomas has greater discrete degree because of the heterogeneity of vasculity.Conclusion
DCE-MRI texture analysis reflects the vascular heterogeneity and proliferation of pituitary adenoma, and is helpful in differentiating typical and atypical pituitary adenomas. Combination of DCE-MRI texture parameters improve the diagnostic ability of atypical pituitary adenomas.Acknowledgements
No acknowledgement found.References
[1]Pollard RE, Reilly CM, Uerling MR, et al. Cross-sectional imaging characteristics of pituitary adenomas, invasive adenomas and adenocarcinomas in dogs: 33 cases (1988-2006). J Vet Intern Med, 2010, 24(1): 160-165.
[2]Di Ieva A, Rotondo F, Syro LV, et al. Aggressive pituitary adenomas--diagnosis and emerging treatments. Nat Rev Endocrinol, 2014,10(7):423-435.
[3]Mazerkina N, TruniY, GorelyshevS,et al. Thyrotropin-secreting pituitary adenoma in an 11-year-old boy with type 1 autoimmune polyglandular syndrome. J Pediatr Endocrinol Metab,2015,20(4):689-698.
[4]Bengtsso D, Schroder HD, Andersen M,et al. Long-term outcome and MGMT as a predictive marker in 24 patients with a typical pituitary adenomas and pituitary carcinomas given treatment with temozolomide. J Clin Endocrinol Metab,2015,100(4):1689-1698.
Figures