2099
Visualizing the effects of ultrasound-based peripheral neuromodulation in the brain1GE Global Research Center, Niskayuna, NY, United States, 2GE Global Research Center, Bangalore, India
Synopsis
We have demonstrated visualization of functional brain changes caused by non-invasive, ultrasound-based stimulation of specific axonal projections within the liver. Following lipopolysaccharide (LPS) injections in a rat animal model, the site-specific liver ultrasound (US) stimulation affected blood glucose levels. The glucose concentration changes were accompanied by increases in the apparent diffusion coefficients (ADC’s) in the paraventricular nucleus (PVN), a known center of afferent nerve pathway termination for integration of outgoing systemic signaling. The local sites of neuronal de-activation (as highlighted by diffusion fMRI) were confirmed by reduced hypothalamic cFOS staining (a marker of neuronal activation).
Introduction
Tools for non-invasively stimulating specific groups of axons in peripheral organs could facilitate the study of local nerve circuits; visualizing how focal, peripheral nervous system (PNS) actions translate into central nervous system (CNS) changes could aid understand the mechanism through which local changes prompt global, systemic effects.
We have demonstrated a non-invasive method to stimulate specific axonal projections within organs using ultrasound (US). Following a lipopolysaccharide (LPS) injection in a rat animal model, inducing a state of hyperglycemia and hyperinsulinemia similar to that seen in Type 2 diabetes, site-specific hepatic US stimulation was shown to regulate blood glucose. Changes in blood glucose concentration were accompanied by increases in the apparent diffusion coefficients (ADC’s) in the paraventricular nucleus (PVN), a known center of afferent nerve pathway termination for integration of outgoing systemic signaling. The locations of neuronal de-activation were confirmed by both visualization of reduced cFOS staining (a marker of neuronal activation) and associated changes in excitatory and inhibitory neurotransmitters (e.g. GABA, Glutamate) in the hypothalamus .
Methods
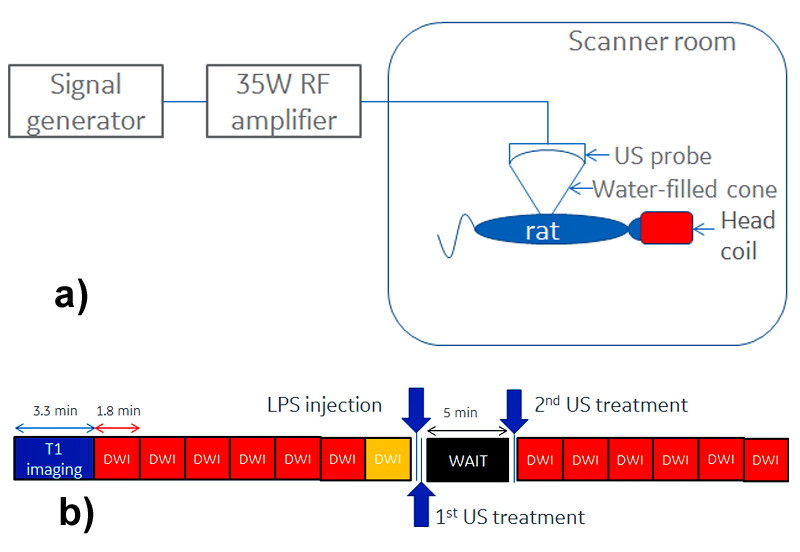
Ten Sprague-Dawley rats were anesthetized using 3% Isoflurane and placed supine, with their heads inserted in a birdcage coil. The abdomen region was coupled through gel/water filled cone to a MR-compatible US probe (f=1.47MHz), focusing on the porta hepatis, a liver region previously shown to contain glucose sensitive neurons1. Figure 1a depicts a schematic of the experimental setup, including the US probe connected to RF amplifier/signal generator.
Data were acquired on a 3T (GE MR750) scanner. A SPGR T1 acquisition was followed by six blocks of DWI images, with a TE/TR of 82/3400ms, using 3/4 averages for the b=0/b=1000 s/mm2 and 0.6/1mm in-plane/out-of-plane spatial resolution. An additional reverse polarity DWI acquisition was acquired for distortion correction purposes2. Following the LPS injection, the 1st US treatment, a wait time and the second US treatment, other 6 blocks of DWI images were acquired. Each ultrasound treatment lasted 60 seconds, during which square wave pulses were applied at 150/350ms on/off periods. The sound pressure at the focal point was approximately 3.2MPa. Figure 1b depicts a summary of the experiment timing. This protocol was applied to 6 rats; for the remaining 4, the last DWI blocks immediately followed the LPS injection, with no ultrasound treatment. A cross-correlation coefficient (ccc) between the T1 and the (distortion-corrected) b=0 DWI images of at least 0.5 decided the slices to be kept for further analysis. ADC’s were calculated for the pre-/post-imaging volumes; pre/post data was pooled together for statistical analysis. A rigid registration between the T1 images and a rat atlas was used to determine regions in which pixel-by-pixel t-tests indicated significant changes; the same transformation was applied to the distortion-corrected DWI/ADC images.
Results
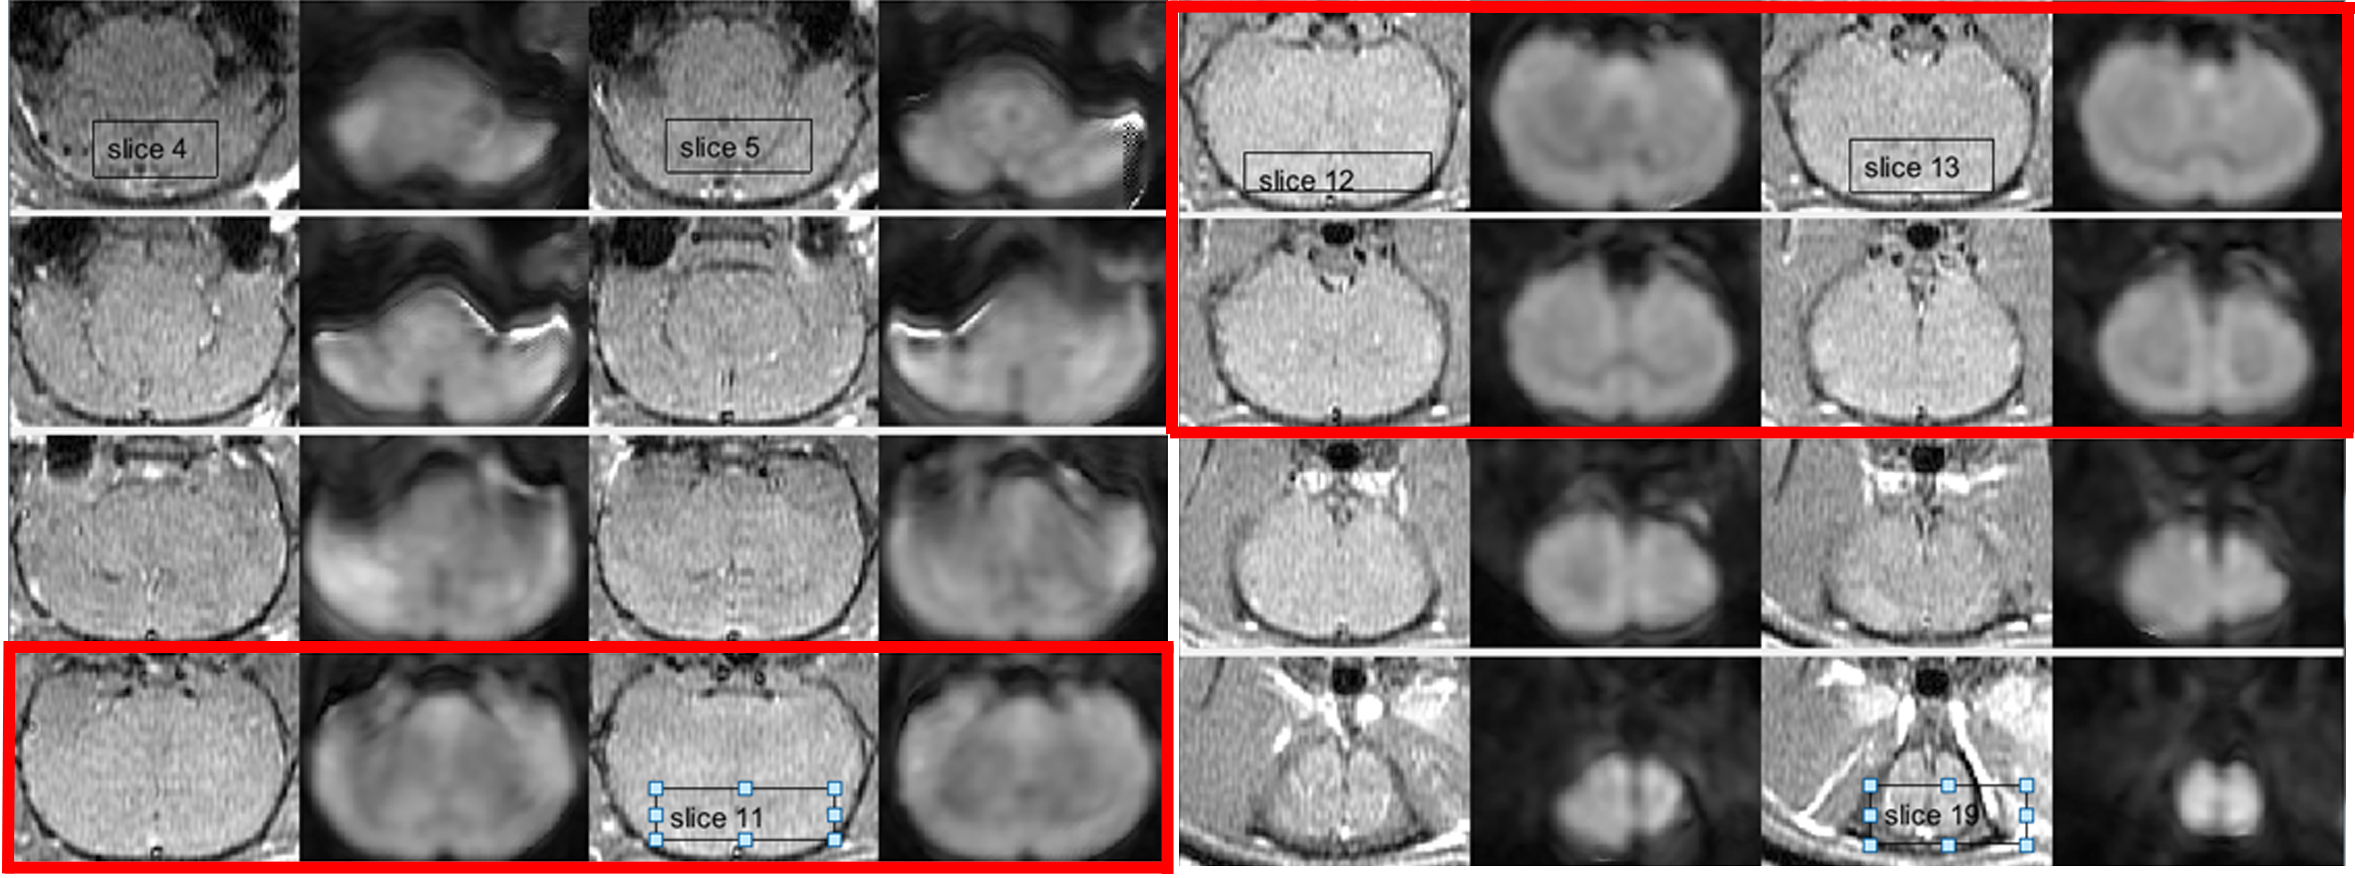
Figure 2 displays an example of the T1/b=0 DWI acquisition in one rat after distortion correction; only red-highlighted slices met ccc>0.5 and were kept for statistical analysis.
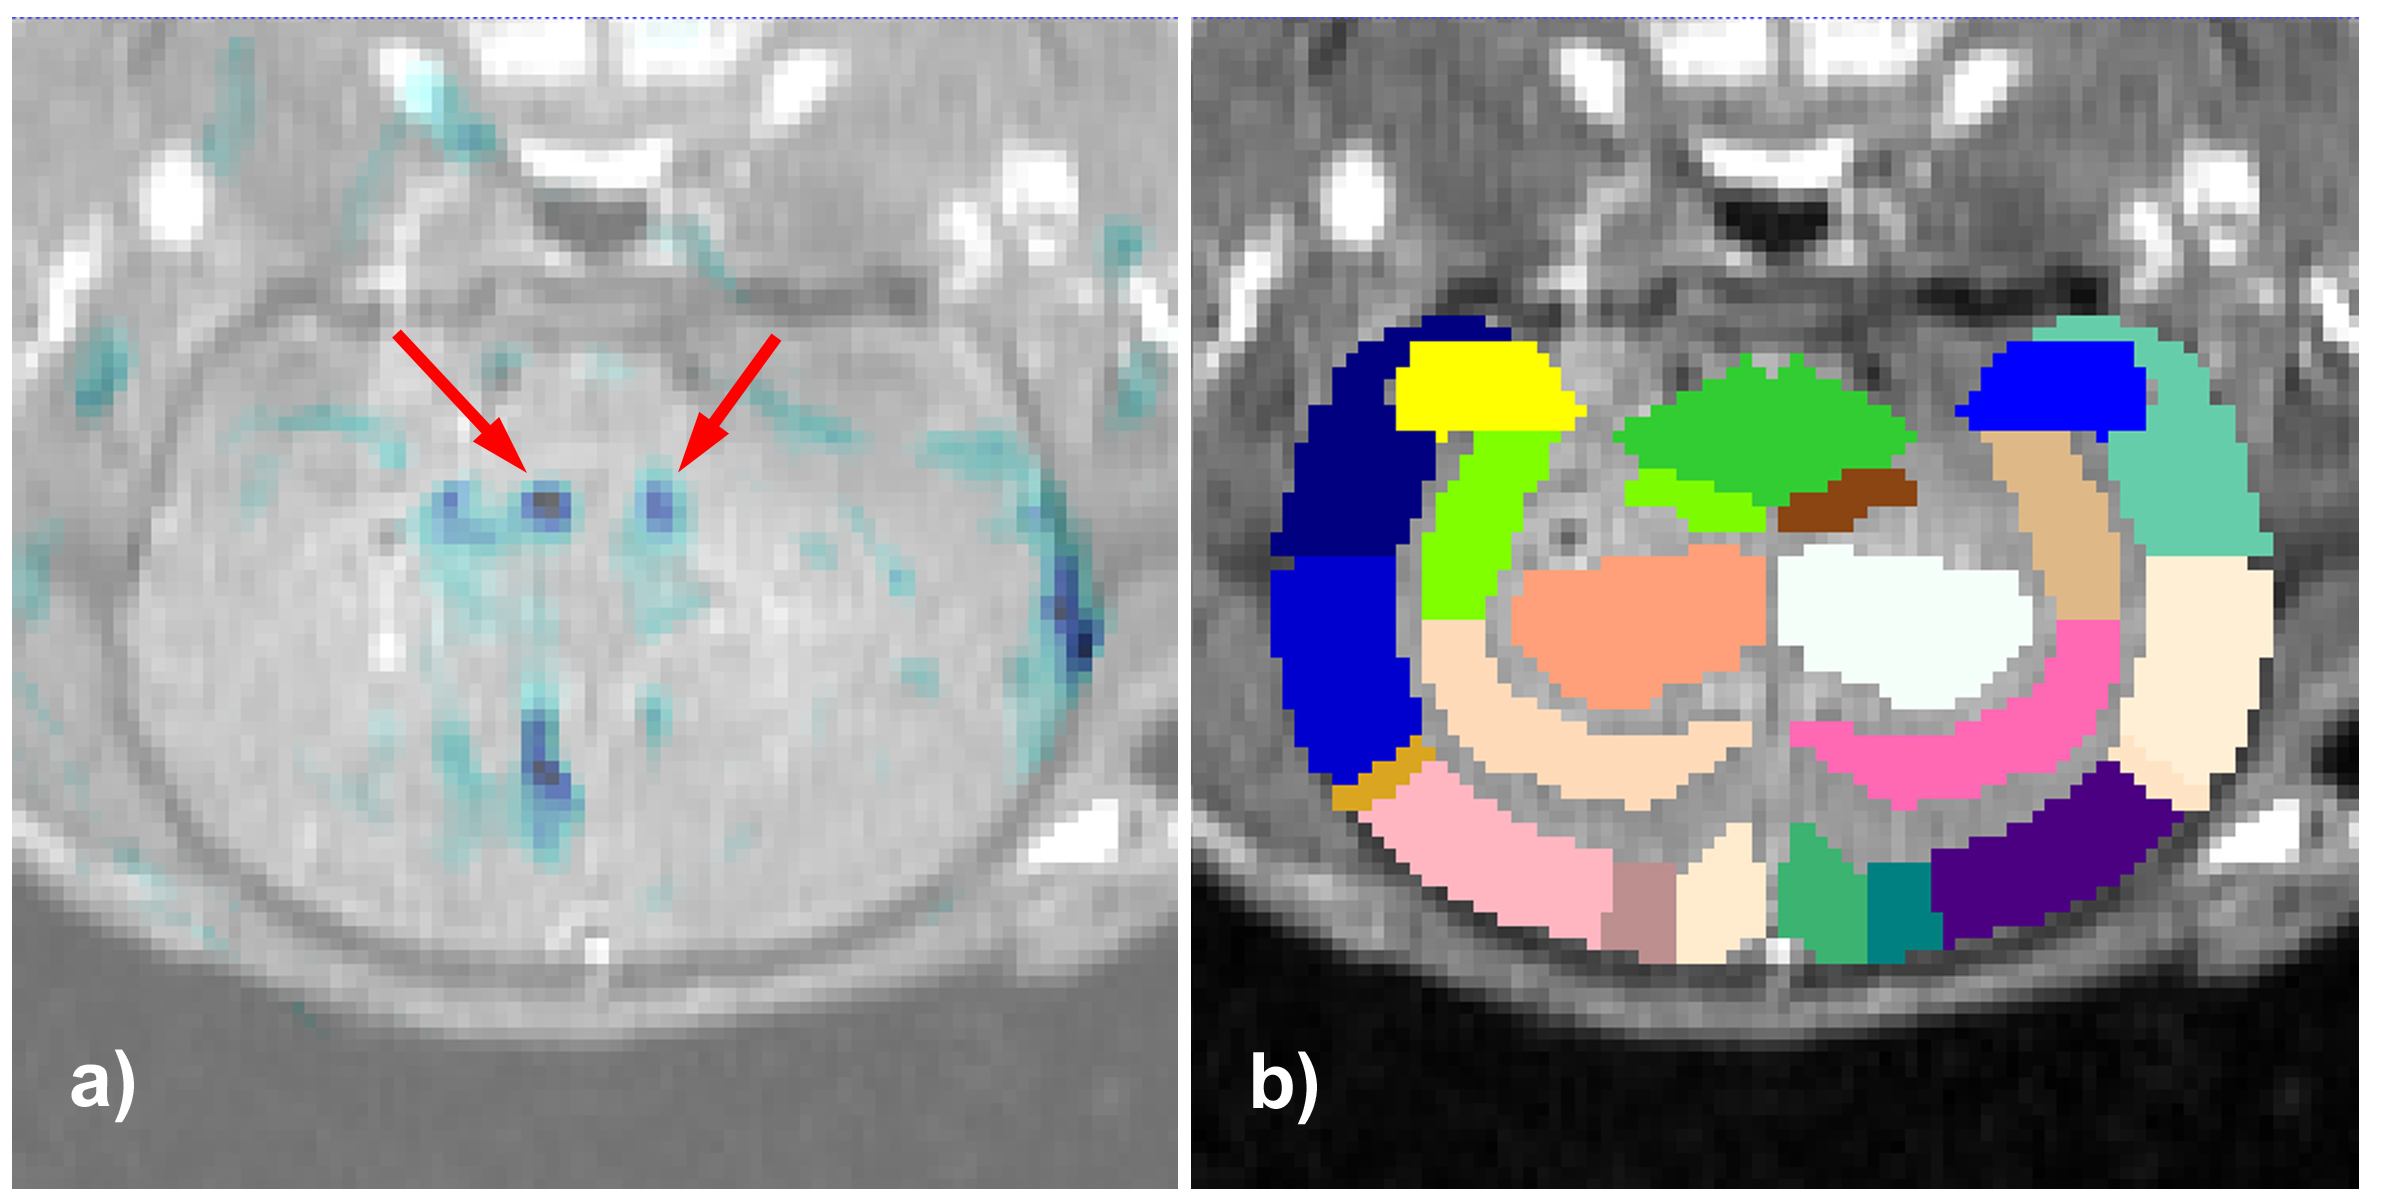
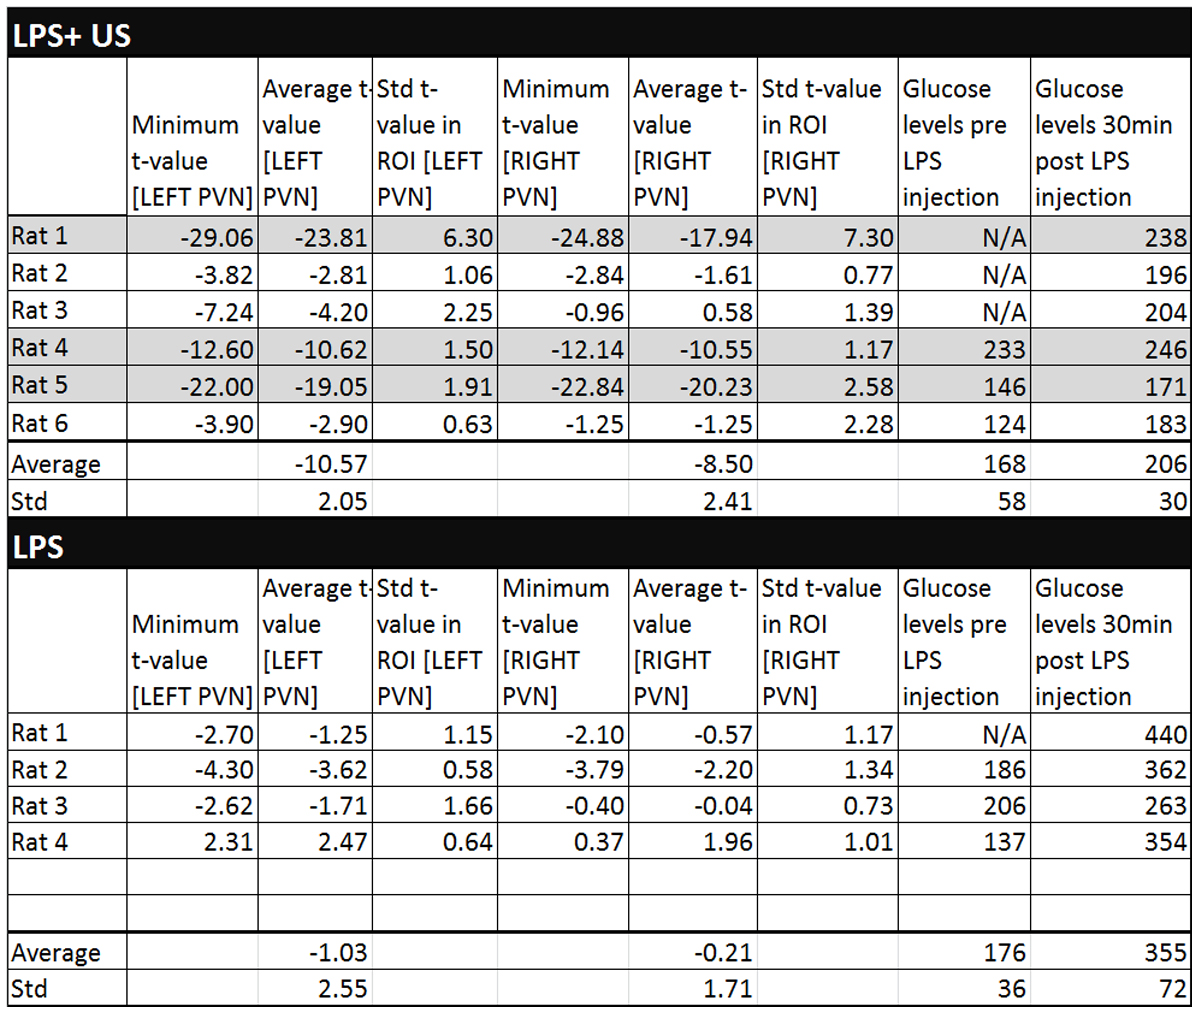
Figures 3a/3b display an example overlay between the activation maps/SPGR volume and atlas/SPGR volume, respectively. Note the ADC increase in both PVN’s (red arrows), consistent with neuronal de-activation3. 3/6 rats showed significant de-activation in the PVN’s; none of the control animals showed such de-activation (Figure 4). At the same time, the significant hyperglycemia of the LPS-treated animals was not observed in the LPS+US animals.
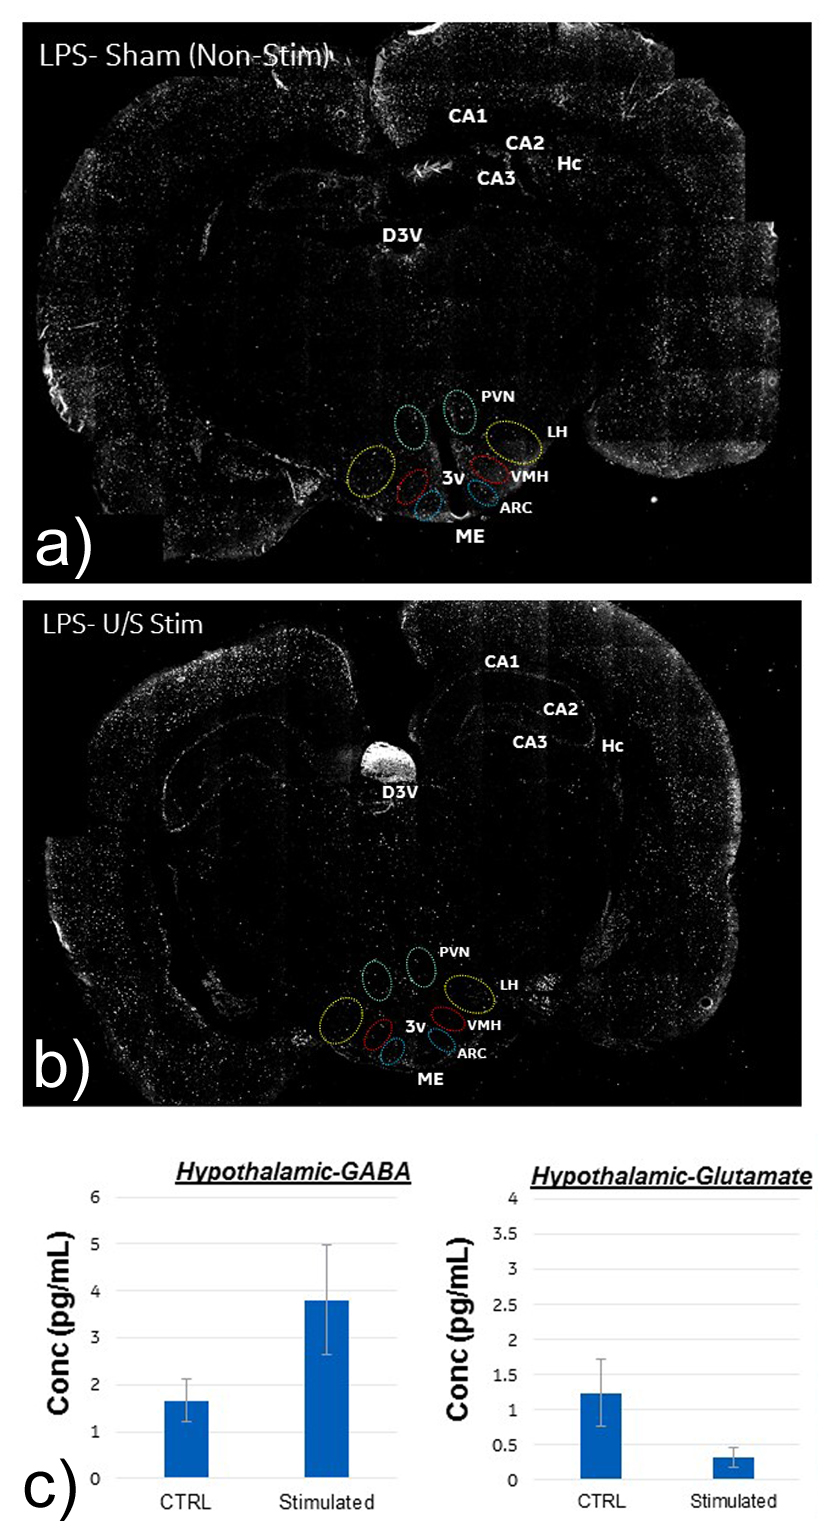
Figure 5 displays the cFOS staining obtained from 2 rats treated with LPS and LPS+US. Compared to the controls, there was a significant decrease in cFOS positive cells within the arcuate nucleus (ARC) (both medial and lateral regions), lateral hypothalamic area (LHA) and PVN, suggesting a US induced correction of LPS-induced neural signaling. This is consistent with the fact that the ARC contains two major populations of neurons that regulate food intake and glucose4. Figure 5c) confirms the associated changes in excitatory and inhibitory neurotransmitters (e.g. GABA, Glutamate) in the hypothalamus.
Discussion and Conclusion
The PVN ADC increases seen in 3/6 rats in response to the US stimulus were generally consistent with the cFOS expression data, demonstrating US induced inactivation of LPS-activated pathways communicating with the hypothalamus. Interestingly, it was only a fraction of the LPS+US animals that exhibited this effect (greyed-out lines of Figure 4). It is to be confirmed by consecutive imaging/cFOS verification in the same animals whether this effect is predominantly seen in animals with a particularly positive US response as indicated by their glucose levels (rats 4/5), becoming less visible in animals whose glucose level increases significantly (rat 6). Note that response is site specific; a slight miss of the porta hepatis (possible in our experiments due to blind US probe placement) results in higher blood glucose levels.Acknowledgements
No acknowledgement found.References
[1] Chun-Xia, Yi et. al., 2010 Apr, 1802(4):416-431, Biochimica et Biophysica Acta, The role of the autonomic nervous liver innervation in the control of energy metabolism
[2] D. Holland, J.M. Kuperman, A.M. Dale, Efficient correction of inhomogeneous static magnetic field-induced distortion in Echo Planar Imaging, Neuroimage, 50 (2010) 175-183.
[3] Abe Y et al, Apr 2017, PLoS Biology, 15(4):e2001494, Water diffusion closely reveals neural activity status in rat brain loci affected by anesthesia
[4] Routh VH, Hao L, Zhou C. 2014. Hypothalamic glucose sensing: making ends meet. Frontiers in System Neuro. 8: (236): 1-13.
Figures