2098
Simultaneous assessment of tDCS-induced neuronal responses with oxygen metabolic MRI1Radiology, New York University School of Medicine, New York City, NY, United States, 2Soterix Medical, New York City, NY, United States, 3New York University School of Medicine, New York City, NY, United States
Synopsis
Although transcranial direct current stimulation (tDCS) offers a therapeutic solution in many neurological diseases, it is still poorly understood how tDCS works underlying neuronal activity in real time. This work was to investigate the real-time tDCS (during stimulation) neuronal response measured with oxygen metabolic MRI. We found cerebral metabolic rate of oxygen (CMRO2) increased during tDCS as compared to sham and immediately reduced when tDCS was turned off but remained at slightly higher level than pre-tDCS. The results strongly support our hypothesis that electric current stimulation can induce neuronal activity and CMRO2 increase.
Introduction
Transcranial direct current stimulation (tDCS) is a safe, well-tolerated, and noninvasive brain stimulation that modulates cortical excitability by applying a weak electrical current via electrodes placed on the scalp 1. Despite its positive clinical findings as a treatment approach 2, the underlying mechanism of tDCS remains largely unclear. Given that tDCS can modify the polarization of neuronal membranes by altering the neuronal firing rate and excitability 3, we propose to use advanced, noninvasive O2 metabolic MRI techniques to quantify excitability-associated O2 consumption change during and after tDCS stimulation. The human brain has a high rate of cerebral O2 consumption which is proportional to neuronal and synaptic activity. This pilot study is to determine whether and how real-time tDCS-induced changes in cortical excitability promote neuronal O2 consumption as measured by the cerebral metabolic rate of oxygen (CMRO2) using MRI.Materials and Methods
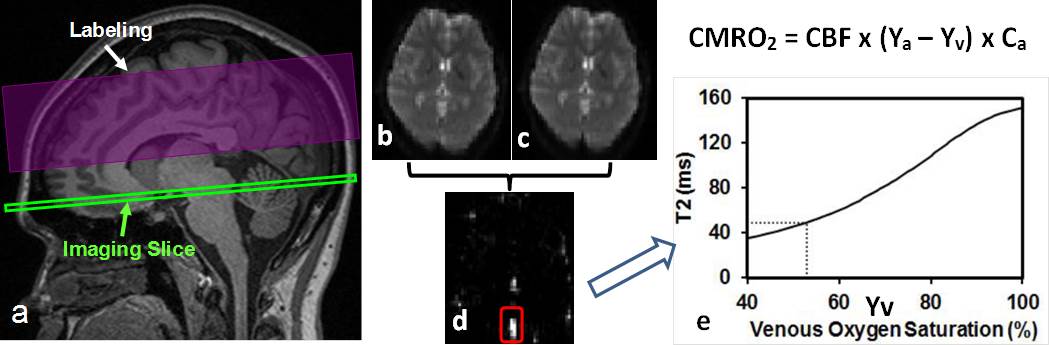
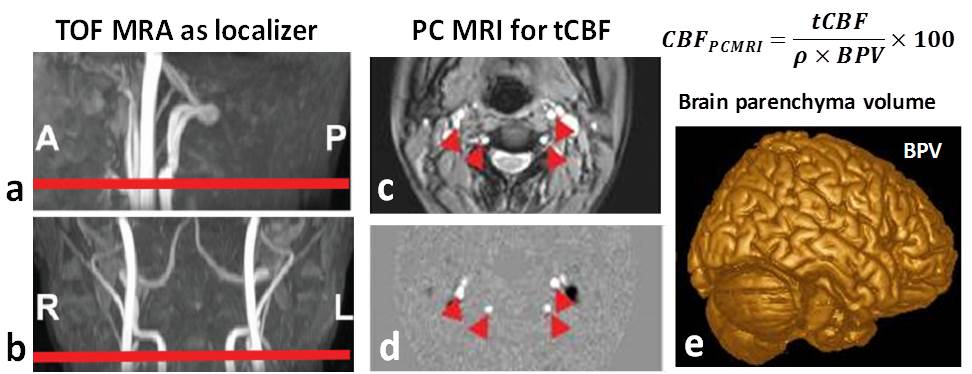
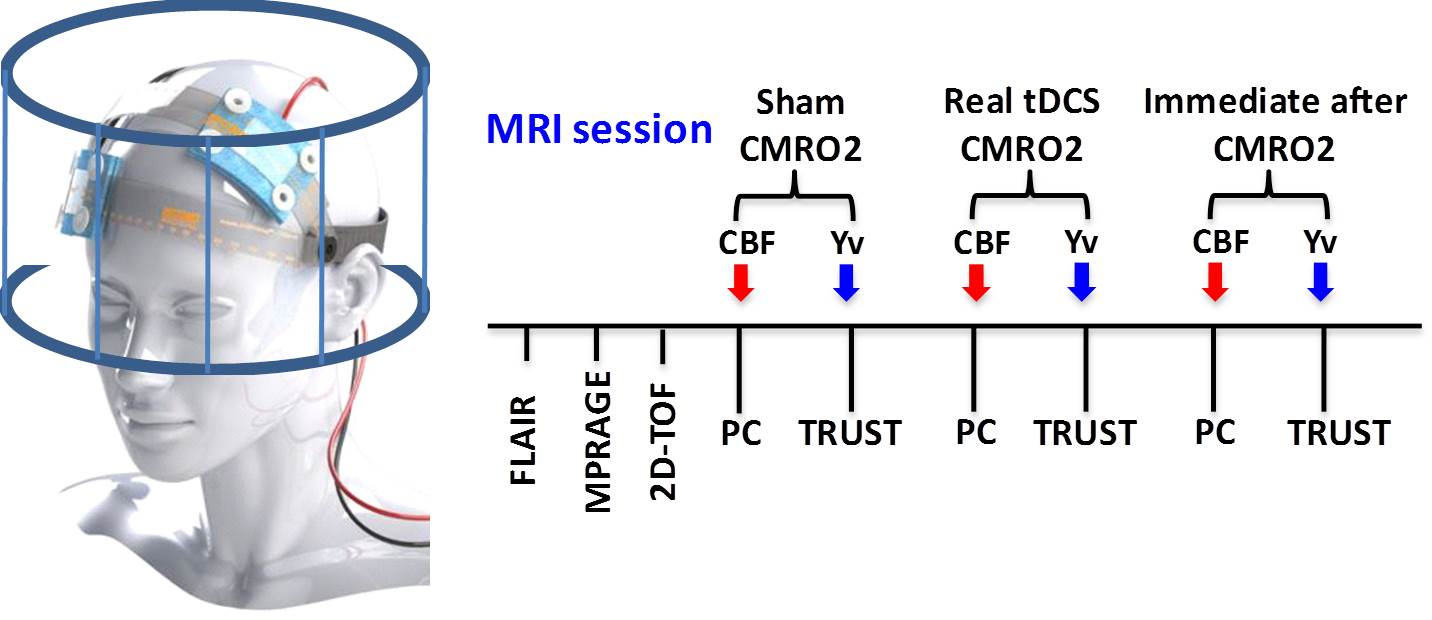
An MRI-compatible tDCS device (Soterix Medical) was used with simultaneous MRI acquisition at a 3T MRI (Prisma, Siemens) in four healthy volunteers. CMRO2 is the amount of O2 the brain consumes per unit time (μmol O2/100g tissue per minute) and can be quantified using a well-established T2-relaxation-under-spin-tagging (TRUST) MRI technique 4, 5, which measures venous oxygenation level (Yv) (Figure 1). In this study, Yv is quantified at the lower portion of the superior sagittal sinus, a major venous sinus that drains the most cerebral cortex blood. CMRO2 is then computed using Yv and brain parenchyma cerebral blood flow (CBF) measured with phase contrast MRI in the neck (Figure 2). CMRO2 scans were performed before, during, and immediately after tDCS modulation in four healthy volunteers, and the scan time for each CMRO2 session was 6 minutes. Stimulation was administered for 2 mA x 6 minutes using 7 x 5 cm size electrodes with anode at left side C3 and cathode at contralateral supra-orbital location (Figure 3). The electrodes were connected to the tDCS device outside the magnet room via cables running through a RF filter installed on a patch panel (between the magnet and the control room).Results
The image quality of CMRO2 scans was not affected by the introduction of tDCS (Figure 4A). Figure 4B shows the CMRO2 levels measured at baseline (sham-tDCS), real or during tDCS, and immediate after tDCS in four participants. All participants showed similar patterns of tDCS-induced CMRO2 changes with average of 15.1% increase during tDCS when compared to sham condition. The CMRO2 decreased immediately after tDCS but remained at a slightly higher level than sham indicating the residual effect. These results strongly support our hypothesis that tDCS can induce CMRO2 increase, which can be used to better understand and estimate the tDCS-induced neuronal response.Conclusion
The real time effects of tDCS can now be quantified and validated using the advanced CMRO2 MRI. This technique will also allow us determine the neuronal reactivity (NR); i.e., percent increase of CMRO2 from sham to simultaneous tDCS is applied as a neuronal stimulus. NR represents a potential biomarker of brain reserve that is important to predict tDCS outcome (i.e., responders vs. non-responders). Higher NR indicates higher neuroplastic potential 6 and cell viability and is critical for neuronal function recovery after tDCS.Acknowledgements
NIH grant R01 NS076588 and National MS Society Pilot Research Grant (PP-1512-07037). This work was also performed under the rubric of the Center for Advanced Imaging Innovation and Research (CAI2R,www.cai2r.net), a NIBIB Biomedical Technology ResourceCenter (NIH P41 EB017183).
References
1. Nitsche MA, Cohen LG, Wassermann EM, Priori A, Lang N, Antal A, Paulus W, Hummel F, Boggio PS, Fregni F, Pascual-Leone A: Transcranial direct current stimulation: State of the art 2008. Brain stimulation 2008, 1:206-23.
2. Floel A: tDCS-enhanced motor and cognitive function in neurological diseases. NeuroImage 2014, 85 Pt 3:934-47.
3. Nitsche MA, Liebetanz D, Antal A, Lang N, Tergau F, Paulus W: Modulation of cortical excitability by weak direct current stimulation--technical, safety and functional aspects. Suppl Clin Neurophysiol 2003, 56:255-76.
4. Lu H, Ge Y: Quantitative evaluation of oxygenation in venous vessels using T2-Relaxation-Under-Spin-Tagging MRI. Magnetic resonance in medicine 2008, 60:357-63.
5. Xu F, Ge Y, Lu H: Noninvasive quantification of whole-brain cerebral metabolic rate of oxygen (CMRO2) by MRI. Magnetic resonance in medicine 2009, 62:141-8.
6. Flachenecker P: Clinical implications of neuroplasticity - the role of rehabilitation in multiple sclerosis. Frontiers in neurology 2015, 6:36.
Figures
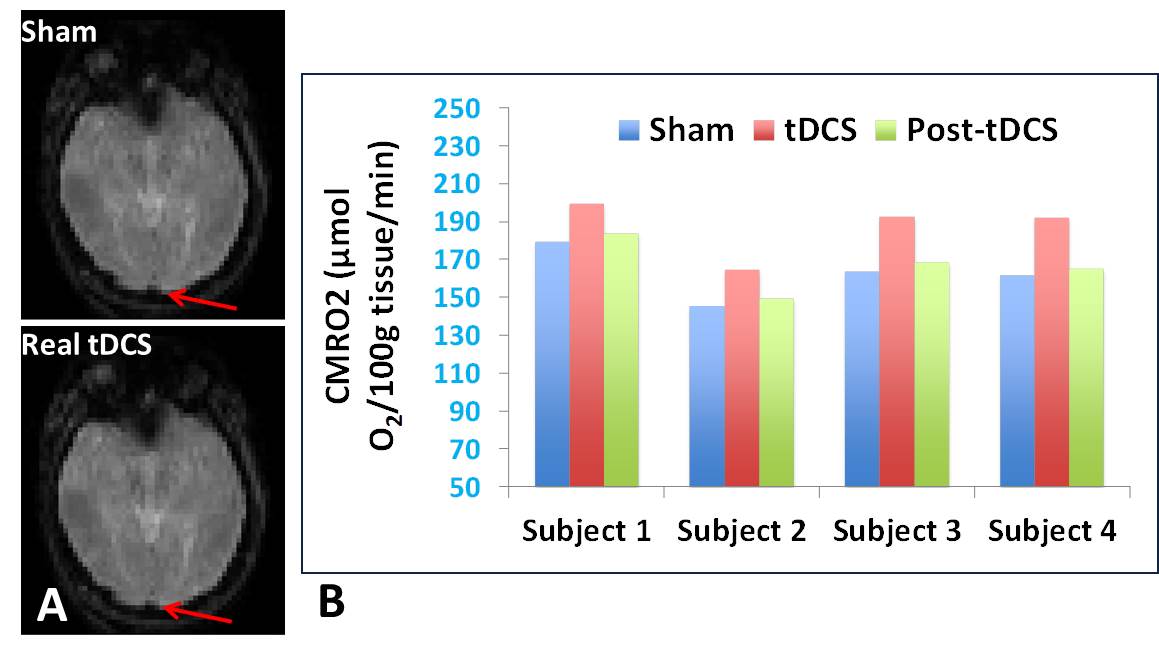
A. The image quality for CMRO2 measurements in the superior sagittal sinus (arrow) is not affected after introduction of tDCS during TRUST MRI scan.B. Measurements of CMRO2 at sham, during tDCS, and immediately after tDCS (post-tDCS) in four participants showing average of 15.1% CMRO2 increase during real tDCS compared to sham.