2096
Chemical exchange saturation transfer imaging for neurodegenerative diseases1Department of Radiology and Radiation Oncology, Institute of Biomedical Sciences, Tokushima-shi, Japan, 2Institute of Biomedical Sciences, Tokushima University Graduate School, Tokushima-shi, Japan, 3Global MR Applications and Workflow, GE Healthcare Japan, Hino-shi, Japan
Synopsis
The purpose of this study is to investigate the relationship between CEST imaging and several neurodegenerative diseases to verify the feasibility of an estimation parameter derived from the CEST approach. For this study, patients with Parkinson’s disease, progressive supranuclear palsy and multiple system atrophy as well as healthy volunteers were examined. Region-of-interest analysis was performed in the substantia nigra and red nucleus area. As the results, the CEST parameters were significantly different for each of the neurodegenerative diseases and healthy volunteers. CEST imaging might have the ability to obtain more detailed information concerning neurodegenerative disease.
Introduction and Purpose
Chemical exchange saturation transfer (CEST) imaging has been established as an important molecular imaging tool for magnetic resonance imaging (MRI) [2]. CEST imaging has been applied as detecting unique information concerning neurodegenerative diseases such as Parkinson’s disease (PD) [2,3]. CEST imaging enables us to obtain several types of mobile protein information such as amide proton transfer (APT) in brain tissue. These applications are expected to be used as a biomarker for neurodegenerative disease [3]. While there are reports concerning the feasibility of APT imaging of PD, few reports have been published about the relationship between PD and other neurodegenerative diseases in the CEST effect. The purpose of our study is to investigate the relationship among several neurodegenerative diseases using an estimated parameter derived from CEST imaging.Materials and Methods
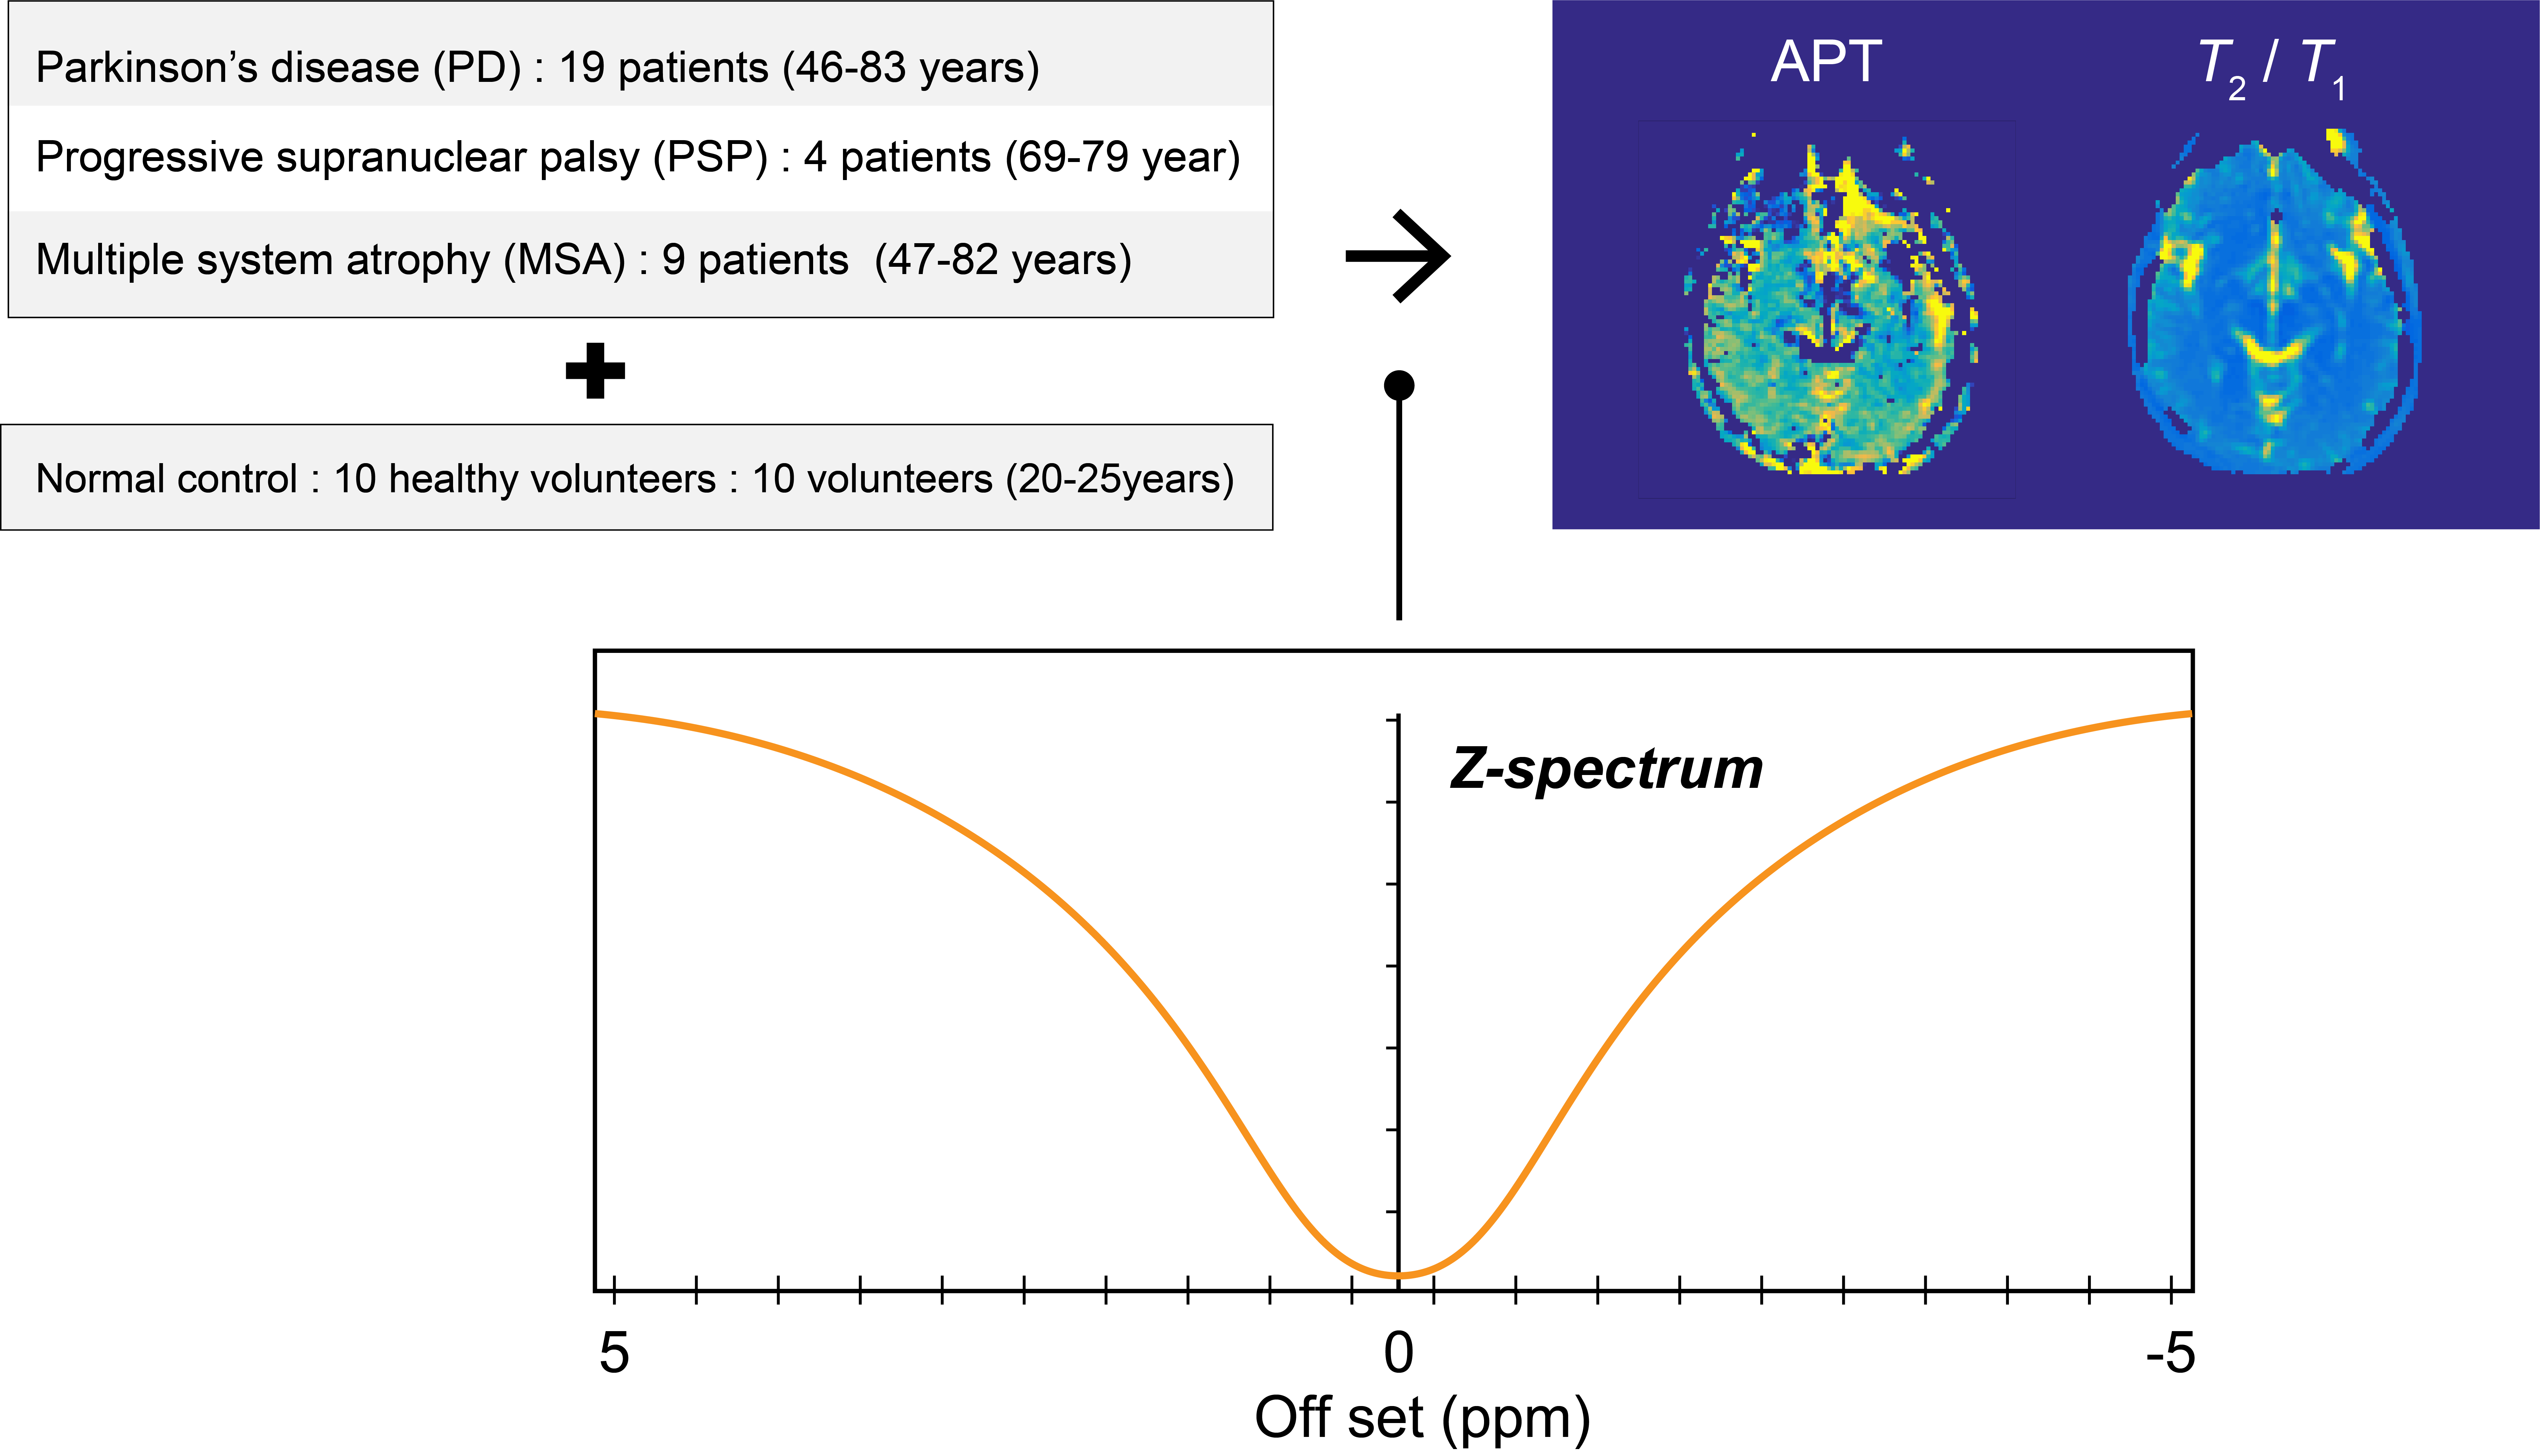
This study was approved by the local institution review board. CEST imaging was performed on patients with PD, progressive supranuclear palsy (PSP), and multiple system atrophy (MSA) as well as healthy volunteers (see Fig.1). All imaging data were acquired on a 3.0 T MR system (Discovery 750, GE Healthcare) with a specialized echo-planner imaging sequence. The imaging parameters for CEST images were echo time, 20.3 ms; repetition time, 3000 ms; bandwidth, 3906 Hz/pixel; field of view, 22 cm; matrix size, 128× 128; slice thickness, 5 mm; phase cycle radio frequency (RF) preparation (mean B1, 2μT); off set frequency equivalent to ±7 ppm per 32 steps. One transverse slice of the midbrain-level was obtained. After acquiring imaging data, APT and the ratio of T2 and T1 values were calculated from the CEST peak extraction (CPE) –spectrum [4]. Then, region-of-interest (ROI) analysis was performed on the substantia nigra and red nucleus area. A multiple comparison test was carried out to compare whether there is a difference among each of the neurodegenerative diseases and the healthy volunteers. In the calculated images a P < 0.05 was considered statistically significant.Results and Discussion
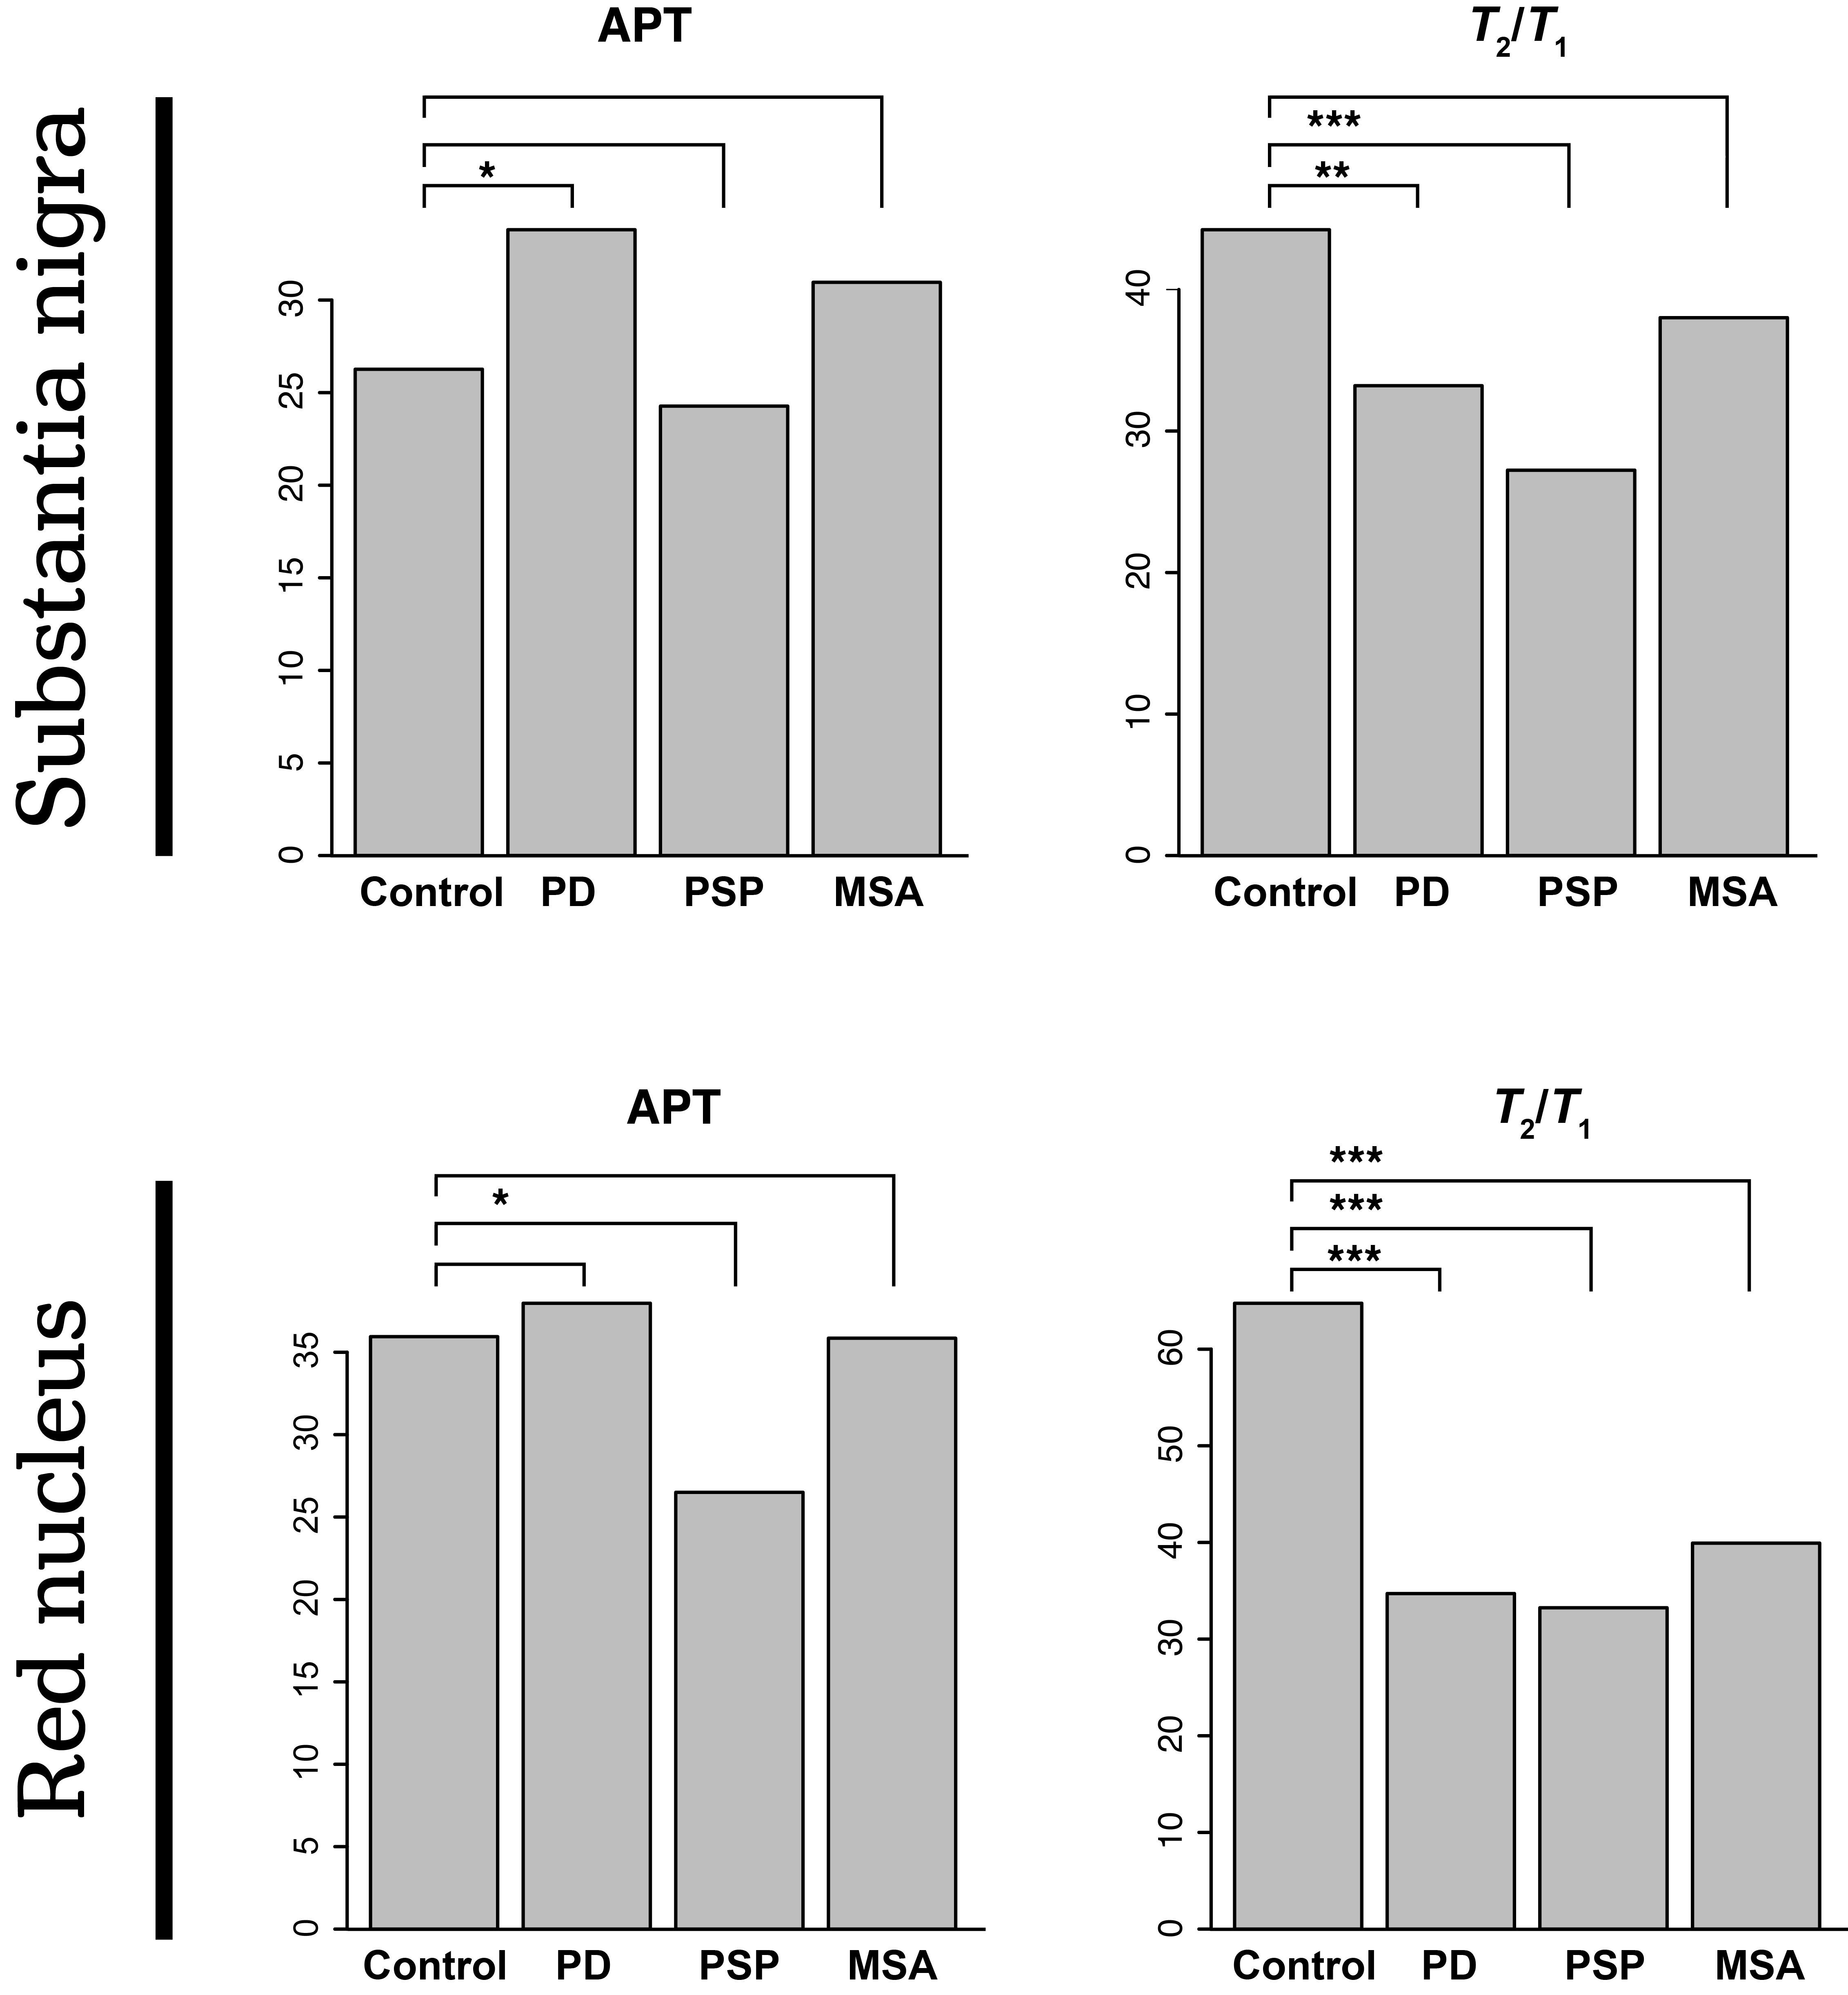
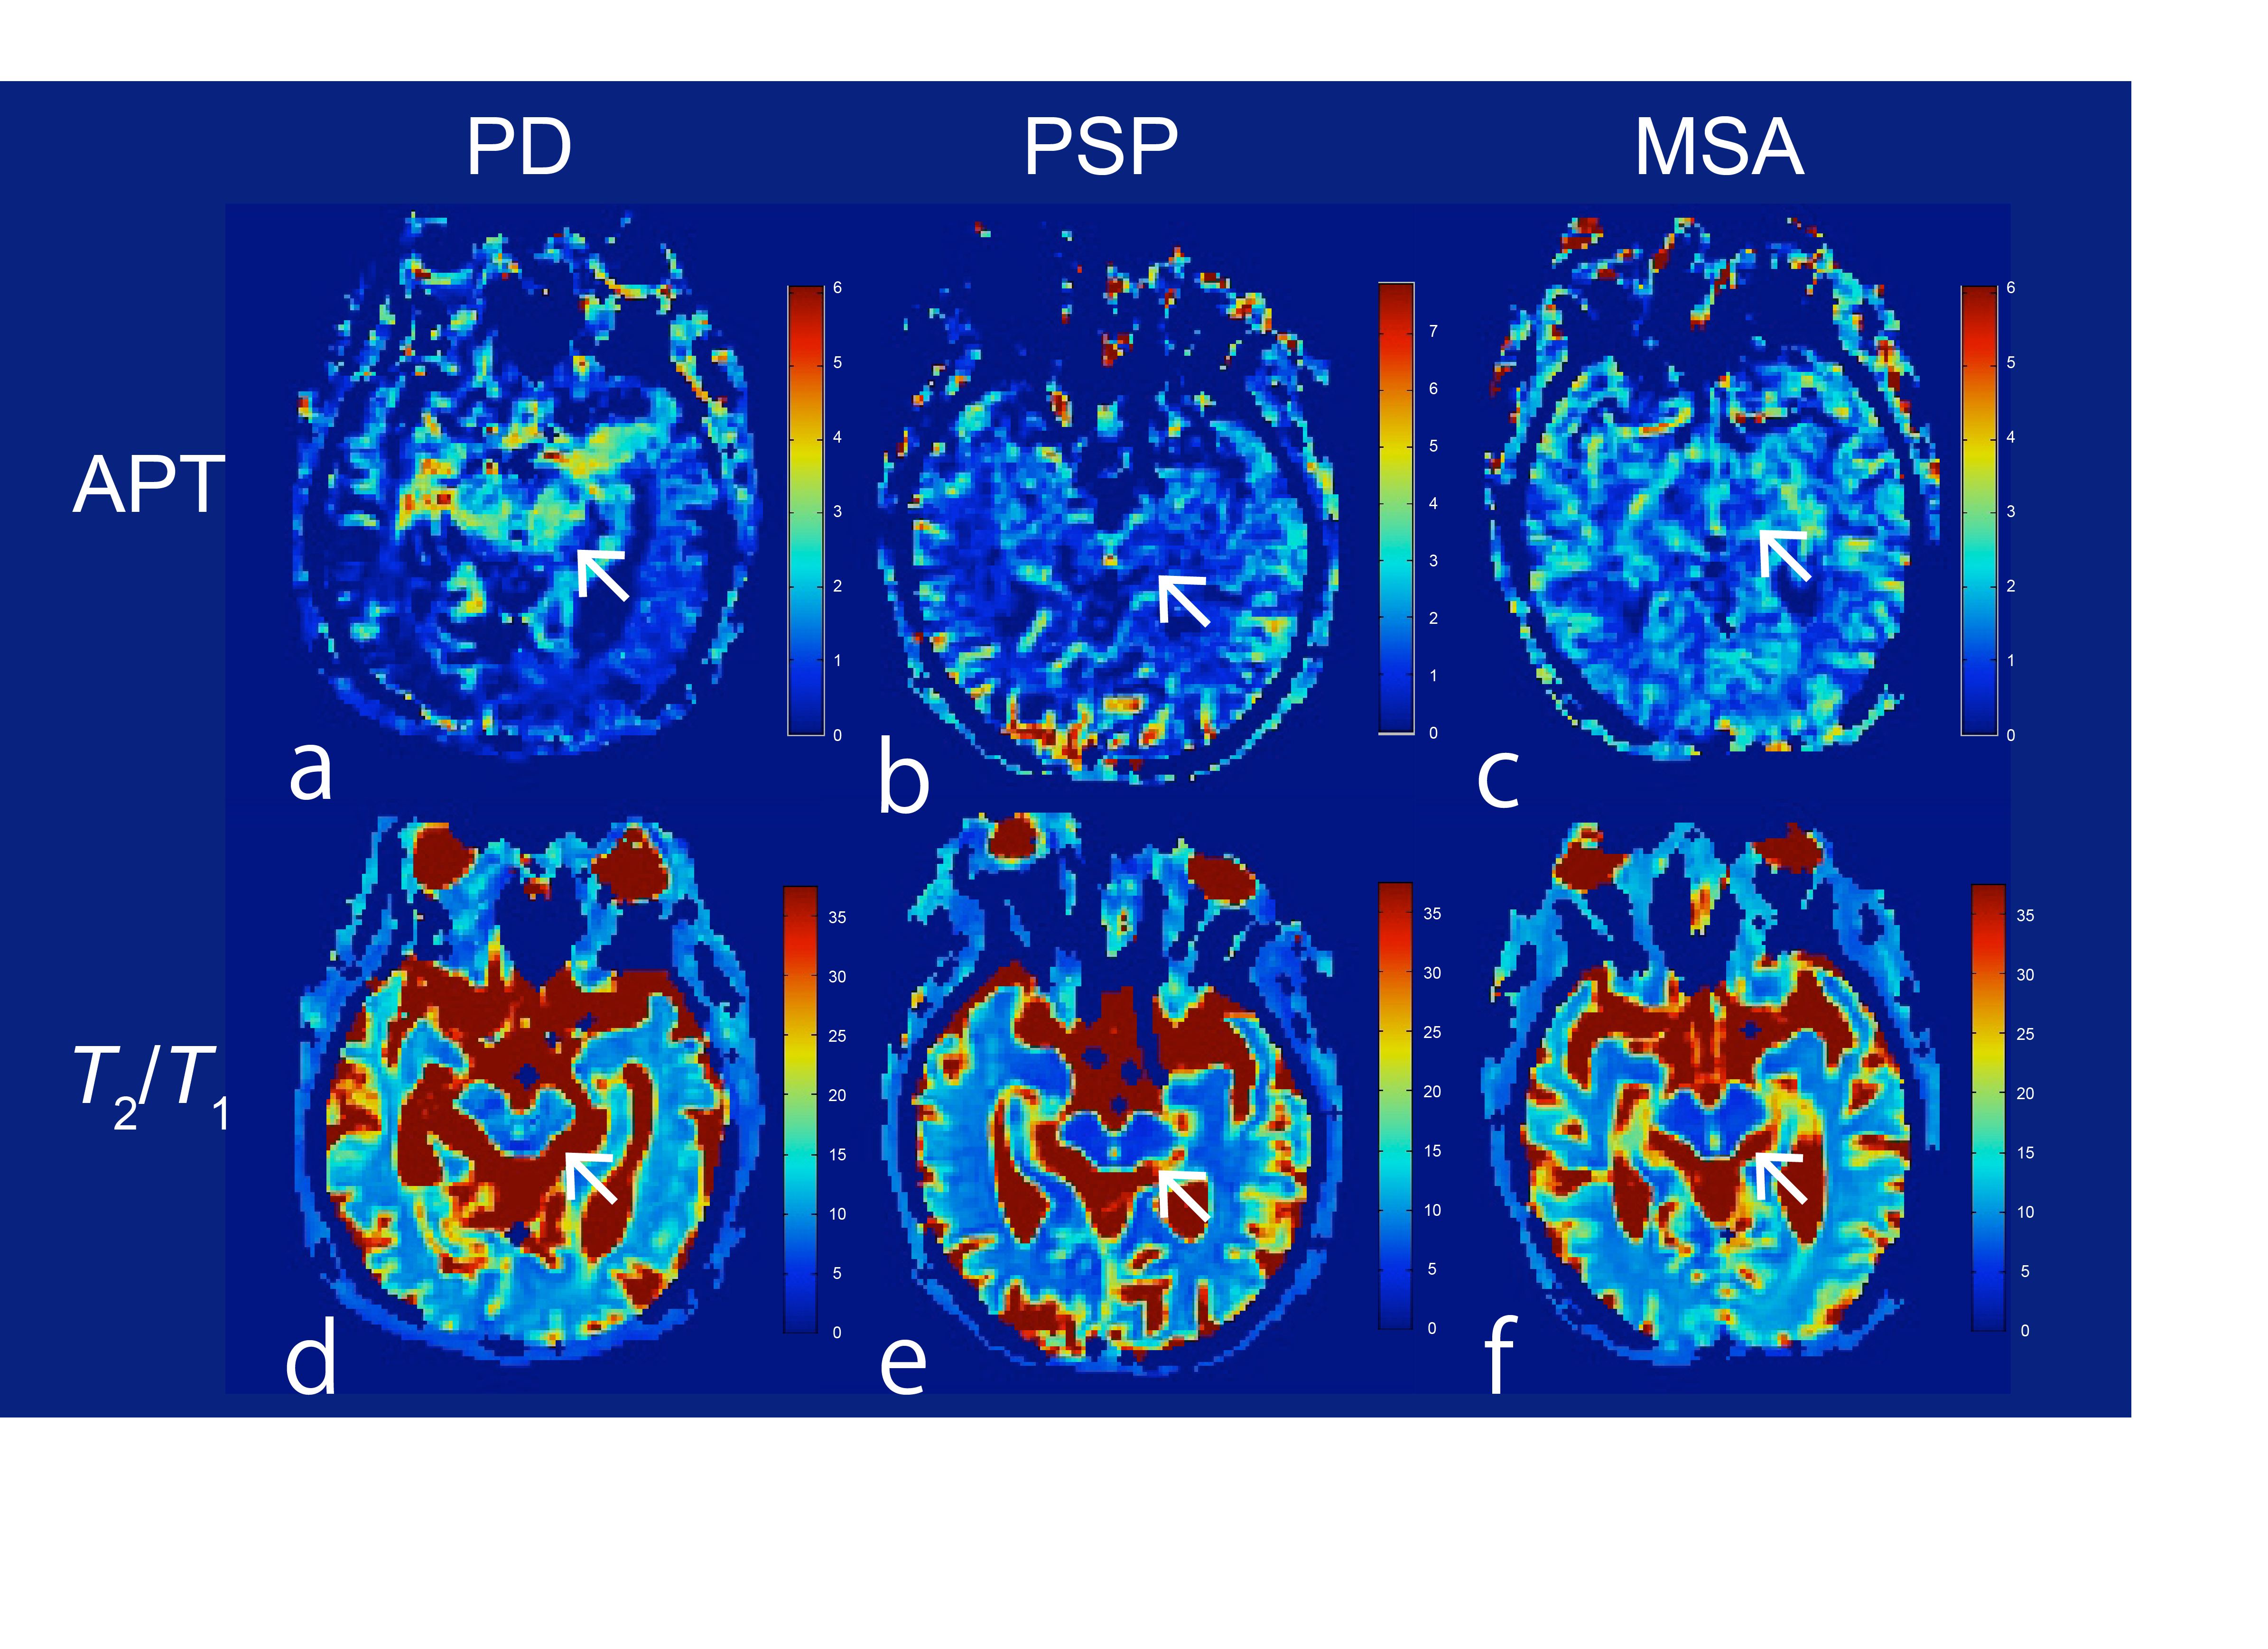
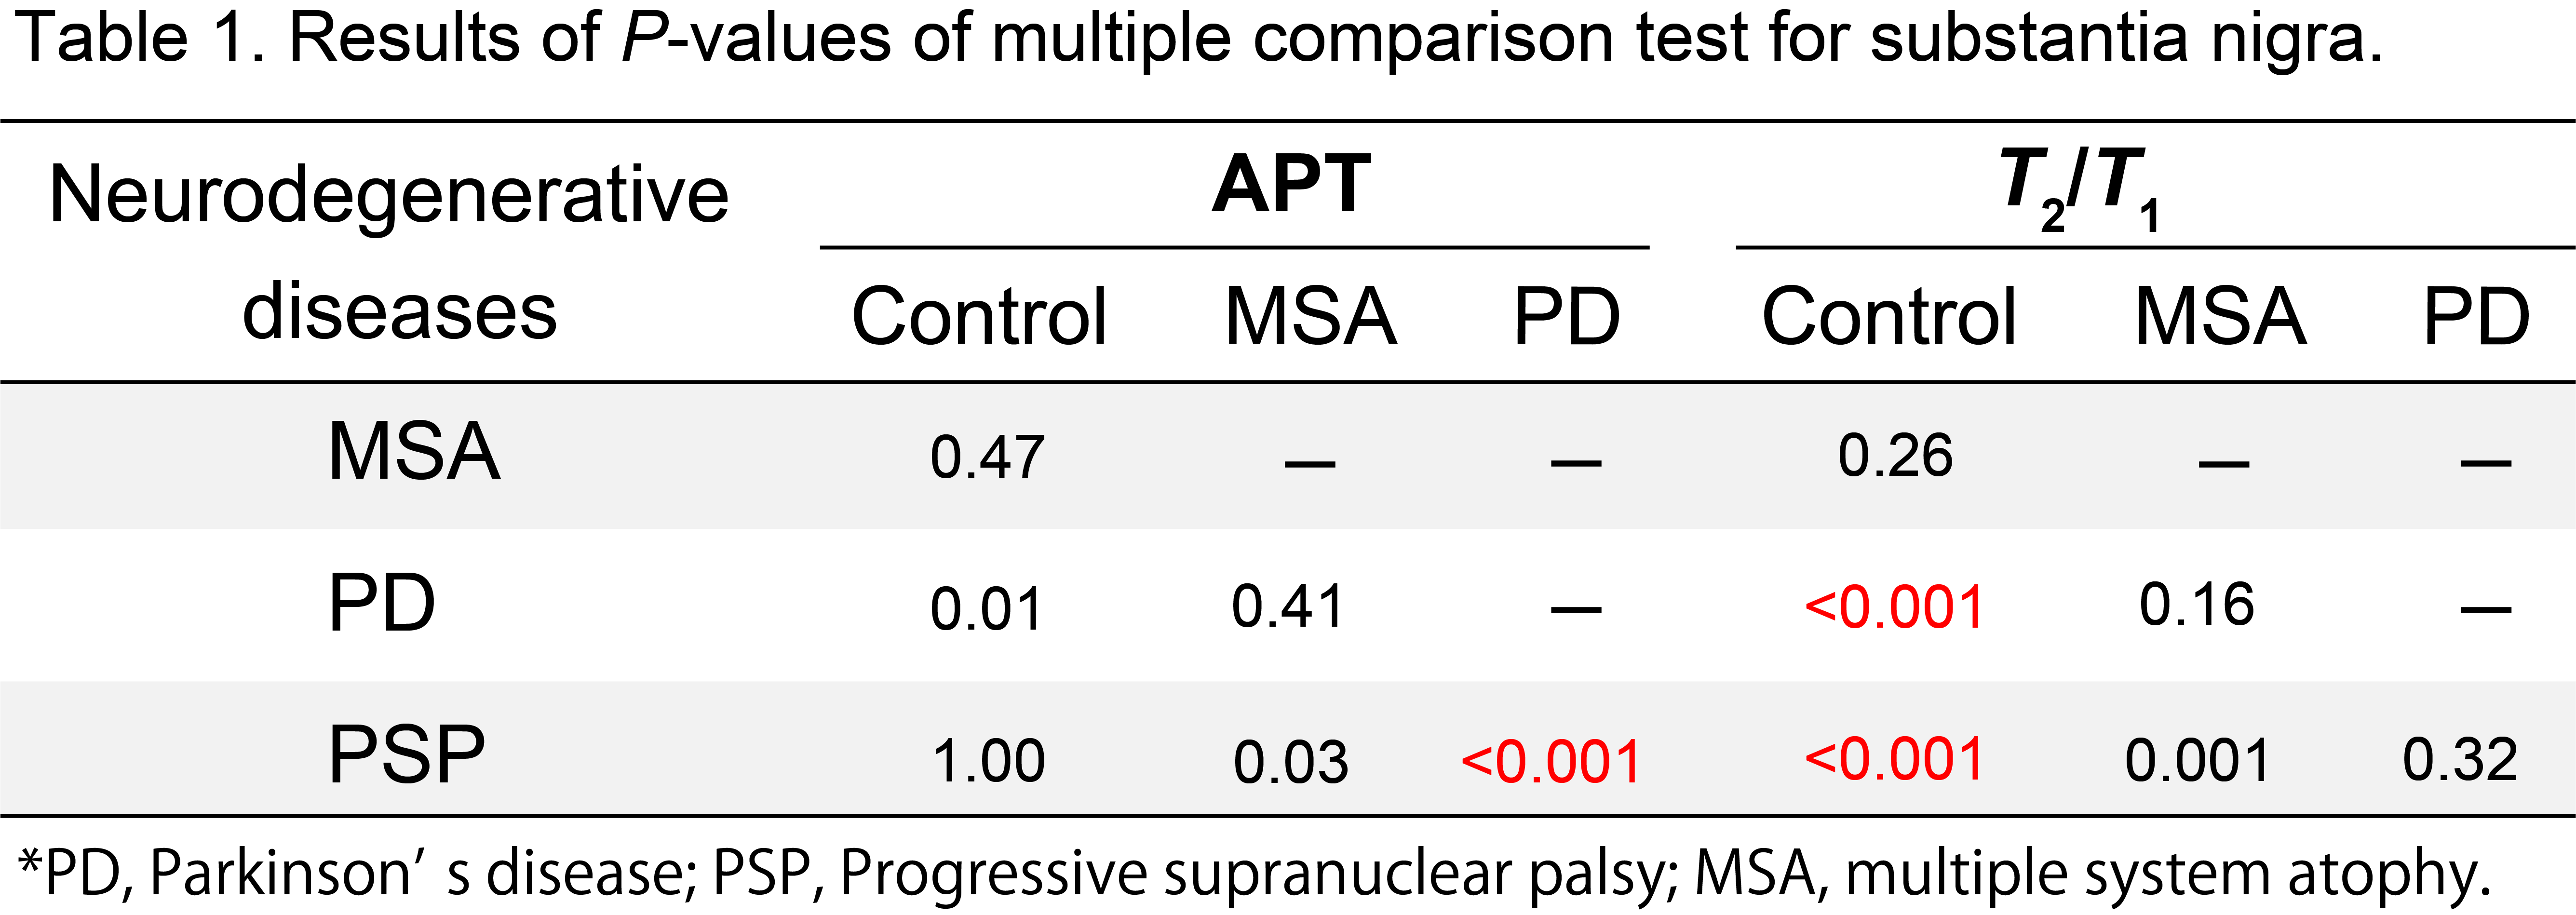
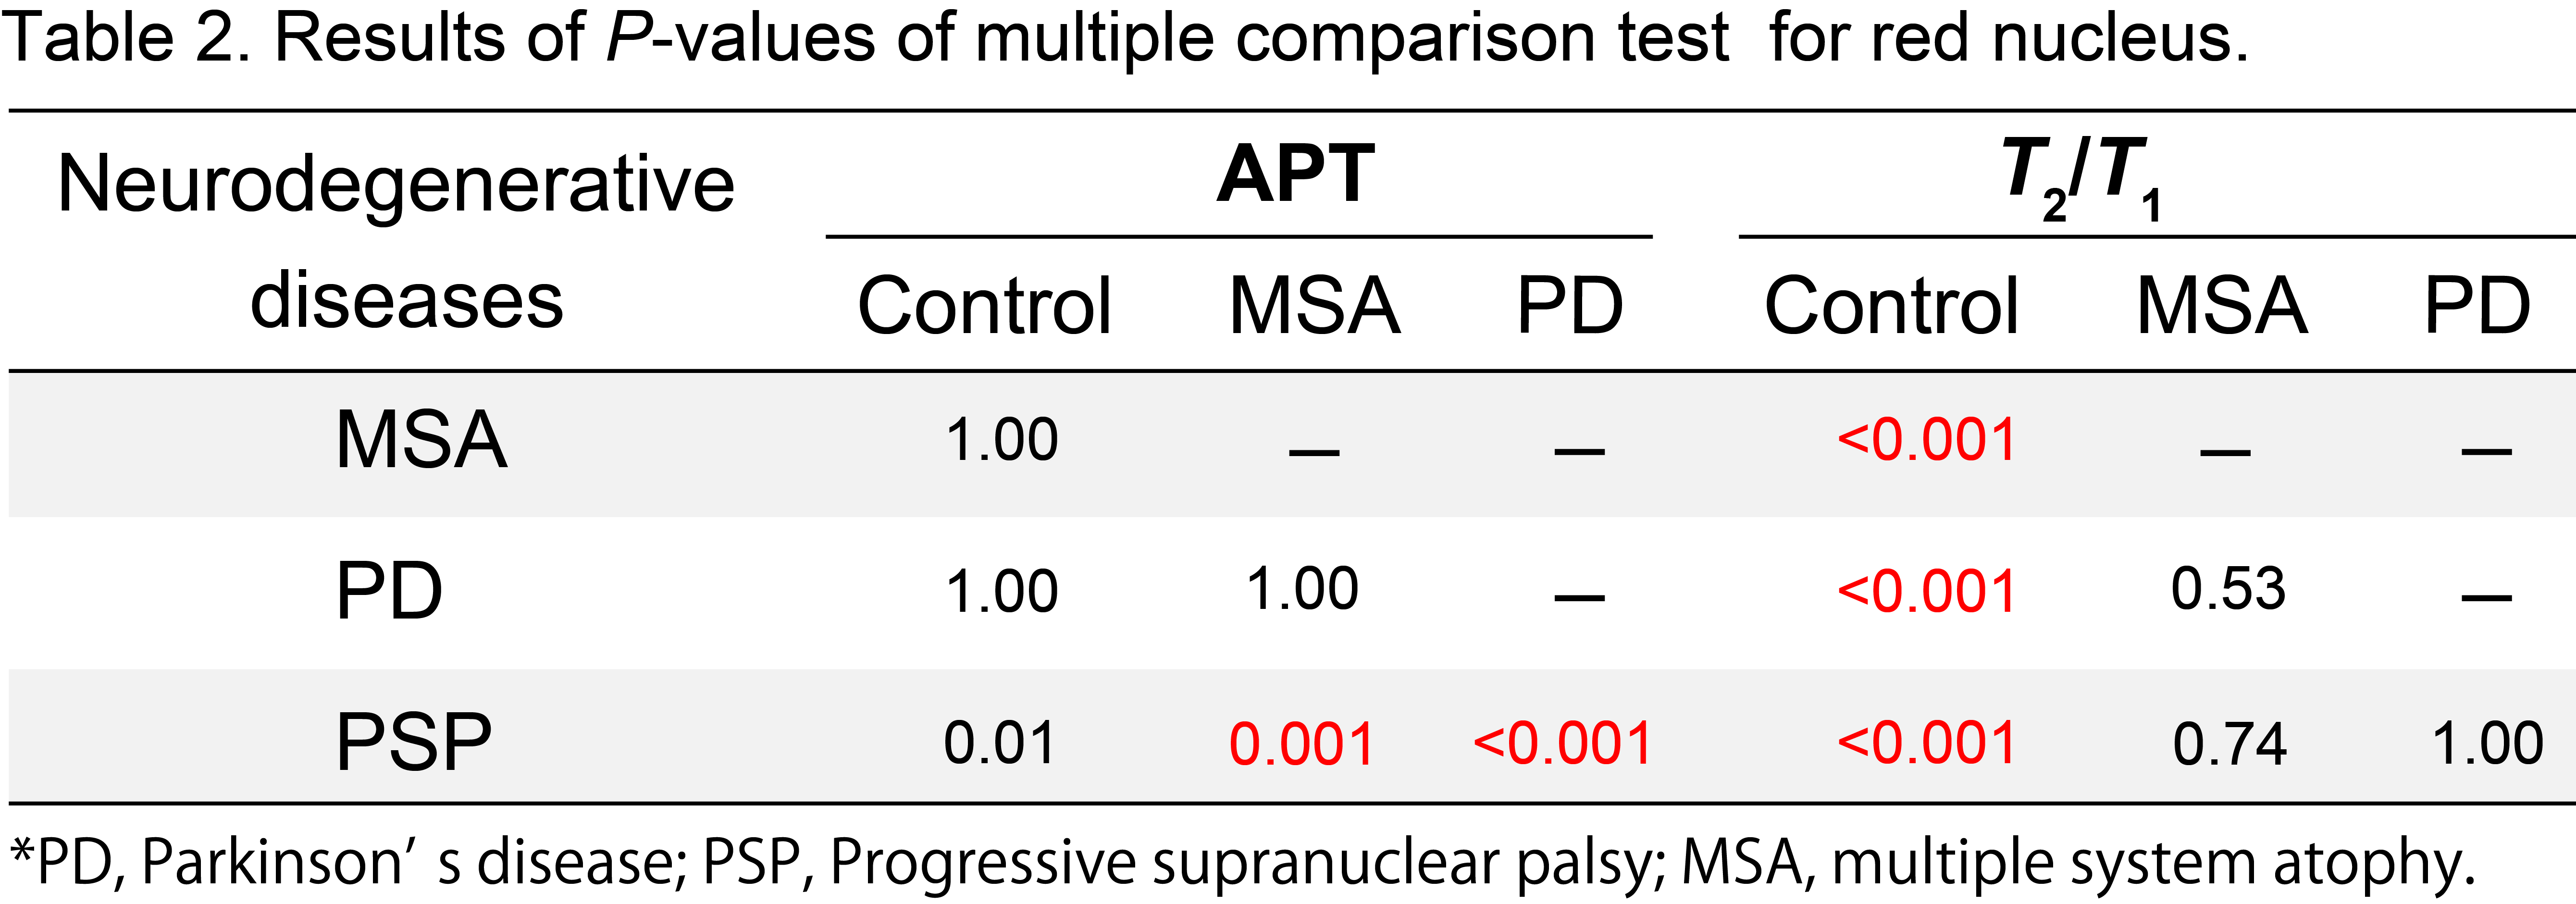
Figure 2 shows plots of the mean APT and the T2/T1 ratio values for the substantia nigra and red nucleus areas for PD patients (n = 19), PSP patients (n = 4), MSA patients (n = 9), and healthy volunteers (n = 10) from the ROI analysis. Figure 3 shows represented CEST images. Table 1 and 2 show the results of P values from the multiple comparison test for the substantia nigra and the red nucleus area. In substantia nigra region, the mean APT value for the PD patients was significantly higher than that of the PSP patients (P < 0.001). Moreover, mean T2/T1 ratio in the PD patients was significantly different when compared with the PSP patients and healthy volunteers (P < 0.001). On the other hand, the mean APT value of the MSA patients was not significantly different compared to other patients. In the red nucleus region, the mean APT value of the PD patients was significantly higher than that of the PSP and the MSA patients (P < 0.001). For T2/T1 ratio there was a significant difference among PD patients and other groups (P < 0.001). From the results, we hypothesized that each neurodegenerative disease has unique properties that are different from each other. The APT image depends on mobile proteins and peptides in biomaterials, and T2/T1 ratio reflects free water in biomaterials. Our results may lead us to detect unique properties of various neurodegenerative diseases in the substantia nigra and red nucleus area.Conclusion
CEST images derived from CPR-fitting might give us the ability to obtain unique information concerning neurodegenerative disease in the future.Acknowledgements
No acknowledgement found.References
[1] Zhou J, van Zijl PC (2006) Chemical exchange saturation transfer imaging and spectroscopy. Progr NMR Spectr 48:109–136.
[2] DauerW, Przedborski S (2003) Parkinson’s disease: mechanisms and models. Neuron 39:889–909.
[3] Li C1, Peng S, Wang R, Chen H, Su W, Zhao X, Zhou J, Chen M. Chemical exchange saturation transfer MR imaging of Parkinson's disease at 3 Tesla. Eur Radiol. 2014 Oct;24(10):2631-9.
[4] Miyoshi M, Matsuda T, and Kabasawa H. CEST Peak Extraction method for multi peak fitting. Proceedings of the 23th Annual Meeting of ISMRM. 2015;3346.
Figures