2095
The hMRI analysis toolbox for quantitative MRI and in vivo histology using MRI (hMRI)1University of Liege, Liege, Belgium, 2Max Planck Institute for Human Cognitive and Brain Sciences, Leipzig, Germany, 3LREN, DNC - CHUV, University Lausanne, Lausanne, Switzerland, 4University of Lausanne, Lausanne, Switzerland, 5University College London, London, United Kingdom, 6Emory University, Atlanta, GA, United States, 7University of Zurich, Zurich, Switzerland, 8Otto-von-Guericke-University Magdeburg, Magdeburg, Germany, 9Medical Center Hamburg-Eppendorf, Hamburg, Germany, 10Weierstrass Institute for Applied Analysis and Stochastics, Berlin, Germany
Synopsis
Quantitative MRI finds increasing application in neuroscience and clinical research due to its greater specificity and its sensitivity to microstructural properties of brain tissue - myelin, iron and water concentration. We introduce the
Introduction
Multi-parameter mapping (MPM) is comprehensive quantitative MRI protocol, including an acquisition, modeling, and processing framework that ultimately provides high-resolution maps of the magnetization transfer saturation (MT), proton density (PD), longitudinal (R1 = 1/T1) and apparent transverse (R2* = 1/T2*) relaxation rate. Here, we present the hMRI toolbox for neuroscience research, an easy-to-use open-source tool for data creating and processing these quantitative MRI data. This toolbox is embedded in the SPM framework, profiting from the high accuracy spatial registration in common space and the variety of available statistical analyses. The hMRI toolbox also offers flexibility for calculation of novel MRI biomarkers of tissue microstructure.Methods
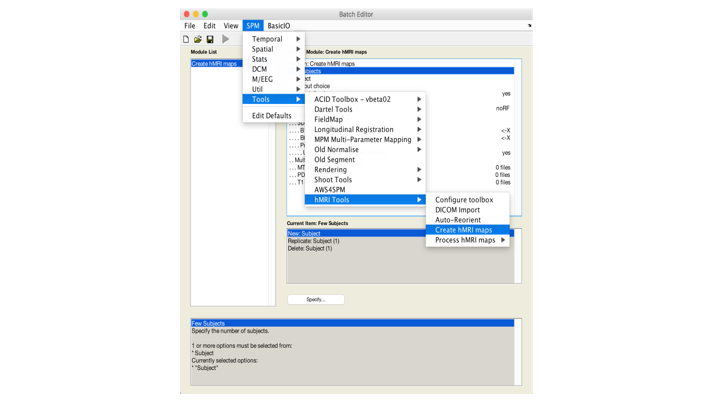
The hMRI toolbox is implemented in MATLAB 1 and can be downloaded from www.hmri.info. It is organized in five parts (Fig. 1):
- Configure toolbox. A set of standard default processing parameters are provided. The configuration module allows the user to define site- or protocol-specific default parameters to be used across the following data processing modules.
- DICOM import. A tool to convert DICOM data into NIfTI files, storing the whole DICOM header as JSON-encoded metadata. By enabling the storage of data acquisition and processing parameters alongside the brain imaging data sets, the hMRI toolbox follows the BIDS recommendations 2.
- Auto-reorient. A simple tool for rigid-body reorientation of all images to the MNI space prior to data processing, in order to ensure the stability of spatial processing steps (mainly segmentation 3).
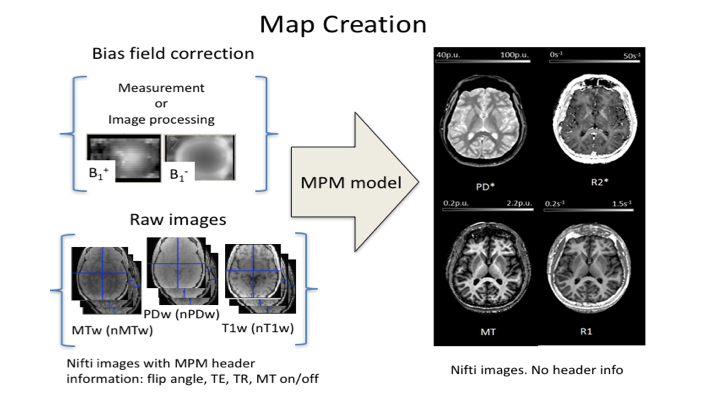
- Map creation (Fig. 2). Computes quantitative estimates of R2*, R1, PD, and MT from unprocessed multi-echo T1-, PD-, and MT-weighted FLASH acquisitions (stored as NIfTI volumes) 4–7. The Map creation module corrects the qMRI estimates for spatial receive and transmit field inhomogeneities based on additional reference data 8–10 or using image processing methods 6,11. Note that there are different methods for PD calculation implemented in the toolbox – there will be an additional abstract, introducing and comparing these methods (Balteau et al., submitted).
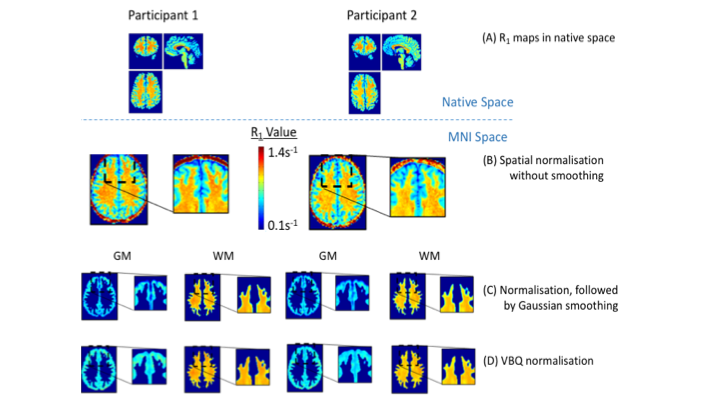
- Process hMRI maps. This module provides dedicated tools and tissue probability maps 12,13 for the spatial processing of the qMRI data based on the SPM spatial processing framework. In particular, spatial registration of the qMRI parameters in standardised space is implemented using the voxel-based quantification approach 12, taking a weighted sum of the qMRI estimates over the spatial extent of the smoothing kernel in native space, and incorporating the Jacobian determinant of the deformation into the weighting (Fig. 3). The weighting is carried out in a tissue-specific manner, producing sets of qMRI maps separately for each tissue class, while reducing partial volume effects on parameter estimates 12.
Usage of qMRI maps computed with the hMRI toolbox
Acknowledgements
EB received funding from the European Structural and Investment Fund / European Regional Development Fund & the Belgian Walloon Government, project BIOMED-HUB (programme 2014-2020). The research leading to these results has received funding from the European Research Council under the European Union's Seventh Framework Programme (FP7/2007-2013) / ERC grant agreement n° 616905. This project has received funding from the European Union's Horizon 2020 research and innovation programme under the grant agreement No 681094, and is supported by the Swiss State Secretariat for Education, Research and Innovation (SERI) under contract number 15.0137. SM received funding from the European Union's Horizon 2020 research and innovation programme under the Marie Sklodowska-Curie grant agreement No 658589. NW and SM received funding from the BMBF (01EW1711A and B) in the framework of ERA-NET NEURON. BD is supported by the Swiss National Science Foundation (NCCR Synapsy, project grant Nr 32003B_159780) and Foundation Synapsis. LREN is very grateful to the Roger De Spoelberch and Partridge Foundations for their generous financial support. MFC is supported by the MRC and Spinal Research Charity through the ERA-NET Neuron joint call (MR/R000050/1). The Wellcome Centre for Human Neuroimaging is supported by core funding from the Wellcome [203147/Z/16/Z]. CP is supported by the F.R.S.-FNRS, BelgiumReferences
1. MathWorks - Makers of MATLAB and Simulink. Available at: https://www.mathworks.com/. (Accessed: 4th November 2017)
2. Gorgolewski, K. J. et al. The brain imaging data structure, a format for organizing and describing outputs of neuroimaging experiments. Sci Data 3, 160044 (2016).
3. Ashburner, J. & Friston, K. J. Unified segmentation. Neuroimage 26, 839–851 (2005).
4. Helms, G., Dathe, H. & Dechent, P. Quantitative FLASH MRI at 3T using a rational approximation of the Ernst equation. Magn Reson Med 59, 667–672 (2008).
5. Helms, G., Dathe, H., Kallenberg, K. & Dechent, P. High-resolution maps of magnetization transfer with inherent correction for RF inhomogeneity and T1 relaxation obtained from 3D FLASH MRI. Magn Reson Med 60, 1396–1407 (2008).
6. Weiskopf, N. et al. Quantitative multi-parameter mapping of R1, PD*, MT and R2* at 3T: a multi-center validation. Front. Neurosci.
7:, 95 (2013).7. Weiskopf, N., Callaghan, M. F., Josephs, O., Lutti, A. & Mohammadi, S. Estimating the apparent transverse relaxation time (R2*) from images with different contrasts (ESTATICS) reduces motion artifacts. Front. Neurosci 8, 278 (2014).
8. Lutti, A., Hutton, C., Finsterbusch, J., Helms, G. & Weiskopf, N. Optimization and validation of methods for mapping of the radiofrequency transmit field at 3T. Magn Reson Med 64, 229–238 (2010).
9. Lutti, A. et al. Robust and fast whole brain mapping of the RF transmit field B1 at 7T. PLoS ONE 7, e32379 (2012).
10. Papp, D., Callaghan, M. F., Meyer, H., Buckley, C. & Weiskopf, N. Correction of inter-scan motion artifacts in quantitative R1 mapping by accounting for receive coil sensitivity effects. Magn Reson Med 76, 1478–1485 (2016).
11. Weiskopf, N. et al. Unified segmentation based correction of R1 brain maps for RF transmit field inhomogeneities (UNICORT). Neuroimage 54, 2116–2124 (2011).
12. Draganski, B. et al. Regional specificity of MRI contrast parameter changes in normal ageing revealed by voxel-based quantification (VBQ). Neuroimage 55, 1423–1434 (2011).
13. Lorio, S. et al. New tissue priors for improved automated classification of subcortical brain structures on MRI. Neuroimage 130, 157–166 (2016).
14. Freund, P. et al. MRI investigation of the sensorimotor cortex and the corticospinal tract after acute spinal cord injury: a prospective longitudinal study. Lancet Neurol 12, 873–881 (2013).
15. Callaghan, M. F. et al. Widespread age-related differences in the human brain microstructure revealed by quantitative magnetic resonance imaging. Neurobiology of Aging 35, 1862–1872 (2014).
16. Lorio, S. et al. Disentangling in vivo the effects of iron content and atrophy on the ageing human brain. Neuroimage 103, 280–289 (2014).
17. Lutti, A., Dick, F., Sereno, M. I. & Weiskopf, N. Using high-resolution quantitative mapping of R1 as an index of cortical myelination. NeuroImage 93, Part 2, 176–188 (2014).
18. Callaghan, M. F. et al. An evaluation of prospective motion correction (PMC) for high resolution quantitative MRI. Front Neurosci 9, 97 (2015).
19. Trampel, R., Bazin, P.-L., Pine, K. & Weiskopf, N. In-vivo magnetic resonance imaging (MRI) of laminae in the human cortex. Neuroimage (2017). doi:10.1016/j.neuroimage.2017.09.037
20. Helms, G., Draganski, B., Frackowiak, R., Ashburner, J. & Weiskopf, N. Improved segmentation of deep brain grey matter structures using magnetization transfer (MT) parameter maps. Neuroimage 47, 194–198 (2009).
21. Callaghan, M. F., Mohammadi, S. & Weiskopf, N. Synthetic quantitative MRI through relaxometry modelling. NMR Biomed 29, 1729–1738 (2016).
22. Lambert, C., Lutti, A., Helms, G., Frackowiak, R. & Ashburner, J. Multiparametric brainstem segmentation using a modified multivariate mixture of Gaussians. Neuroimage Clin 2, 684–694 (2013).
23. Mohammadi, S. et al. Whole-Brain In-vivo Measurements of the Axonal G-Ratio in a Group of 37 Healthy Volunteers. Front Neurosci 9, 441 (2015).
24. Ellerbrock, I. & Mohammadi, S. Four in vivo g-ratio-weighted imaging methods: Comparability and repeatability at the group level. Hum. Brain Mapp. (in press). doi:10.1002/hbm.23858
25. Ashburner, J. A fast diffeomorphic image registration algorithm. NeuroImage 38, 95–113 (2007).
26. Mohammadi, S. & Callaghan, M. Image Analysis In M. Cercignani, N. Dowell; P. Tofts (2nd edition). Quantitative MRI of the Brain: Principles of Physical Measurement. (Taylor and Francis, in press).
Figures