2094
Visualizing healthy aging: A comparative study of quantitative T1 and T2 relaxometry with standard and MR fingerprinting techniques1Department of Radiology, University Hospital Bonn, Bonn, Germany, 2Philips Research, Hamburg, Germany, 3Philips Healthcare, Bonn, Germany
Synopsis
Relaxometry aims at an absolute quantification of T1 and T2 times explained by physicochemical properties in the brain. MR Fingerprinting can be used for quantitative relaxometry, e.g. to explore the effect of age on brain structure. This study examined young and old age (n=26 each) volunteers with standard and MRF mapping techniques. We found that MRF and standard technique multiecho-derived T1 and T2 maps do not identify the same brain structures as affected by age-related relaxometric changes and show in part contradictory relationships between age and especially T1 relaxation. This limited comparability has strong clinical implications for the interpretation of relaxometric studies beyond the topic "aging".
Introduction
MR Fingerprinting (MRF) is a new and still evolving concept of MR imaging1. It has the potential to deliver a non-invasive assessment of the physicochemical properties of the tissue under investigation. The standard MR techniques with probably the closest resemblance to MRF concerning the extraction of tissue-intrisic information are quantitative T1 or T2 relaxometric mapping. Indeed, relaxometric maps can also be reconstructed from MRF data. Over the course of life the human brain changes its composition and structure: Water and myelin contents alter, connectivity changes2. This has an effect on the relaxometric properties of the brain. For both standard T1 and T2 mapping (s-qT1 and s-qT2) as well as MRF-derived T1 and T2 maps (MRF-qT1 and MRF-qT2) age-related differences could be documented2-4.
MR biomarkers of brain aging are valuable to receive normative values but also for the comparative clinical assessment of individuals. Currently the comparability of MRF and standard relaxometry concerning the assessment of age is unclear. The present study intends to fill this gap.
Methods
This study was performed by permission of the local ethics committee. 52 volunteers without a history of cerebral disease were scanned at 3T (Achieva TX) with an 8-channel head coil (Group “young”: n=26, 20 to 40yrs, mean age 24.6 ± 3.1yrs, 11 men; Group “old”: n=26, 60 to 80 yrs, mean age 66.0 ± 4.0 yrs, 16 men, Minimal Mental Test Score all >28/30).
A 1mm³ 3D T1w sequence was acquired first. The 2D MRF sequence was FISP-based5 (TR 15ms, TE 4ms, two spiral interleaves/slice, acquisition window 7.0ms, total acceleration factor 15, voxel size 1x1x5mm, FOV 240x240x60mm; 12 slices) starting with an adiabatic inversion pulse followed by an optimized FA sequence6 with FA between 0 and 60°. MRF dictionary was computed using the EPG (extended phase graphs algorithm) for T1 between 10 and 2000 in steps of 10ms and T2 between 10 and 200 in steps of 1ms and from 210 to 600ms in steps of 10 ms. The slice profile of the RF pulse was included in the dictionary computation. MRF-qT1 and T2 maps were obtained by inner product pattern matching of the dictionary with the reconstructed temporal signals for each pixel.
s-qT1 maps were generated based on an isotropic inversion recovery (IR) sequence (shortest TR 4.81–5.07msec, TE 2.49–2.59msec, FA 15°, 5 inversion time delays of 150, 350, 750, 1200 and 2300msec, FOV 240×220x70mm, 28 slices). Maps were generated with an in- house script in Matlab7.
s-qT2 maps were based on a multiecho sequence (TR 1s, TE 15, 30, 45, 60, 75, 90, 105 and 120 msec, FOV 240x212x66mm; 12 slices). s-qT2 maps were generated by industry-delivered software.
Coregistration and segmentation of substructural compartments was done with FSL8 and visualized with ITK-SNAP (cortical gray matter, deep white matter, thalamus, hippocampus, caudate, pallidum, putamen; Fig. 1)9. Independent and paired t-tests were applied after testing for normal distribution.
Results
The cortical gray matter was identified as affected by age-related relaxometric alterations by MRF and s-qT1 and s-qT2 mapping (p<.05 all; Fig. 2). Both standard and MRF T2 relaxometries showed age-related relaxation difference in the putamen (p=.0001 both). MRF-T1 times were longer in the old cohort, but shorter in the old when using s-qT1 mapping (Fig. 3). This inverse observation between methods did not apply to the putamen and T2 mapping (Fig. 3). Only MRF-qT1 and s-qT2 identified age-related differences in the hippocampus (p=.0001 both), while only s-qT1 identified differences in the pallidum (p=.001) and only s-qT2 maps revealed differences for white matter and thalamic structures (p=.001 both). MRF-T2 times were lower than s-T2 time calculations. No sex-specific differences were observed.Discussion and Conclusion
Main finding of this study is that standard and MRF relaxometries did mainly not identify the same age-related relaxometric brain changes. Even in cases where MRF and standard relaxometry identified age-related trends in the same structure, the direction of this correlation was inconsistent between MRF and standard relaxometry in some cases. Regarding MRF relaxometry, our findings are consistent with previously published results4. However, contradictory relationships identified by s-qT1 are not implausible and e.g. explainable by increased cortical iron decomposition during aging10. Reasons for these complex inconsistencies between standard and MRF mapping can only be speculated upon. Future studies should however focus on the effect of B1 inhomogeneities and magnetization transfer in the reconstruction process of MRF data.
Findings of this study are relevant for diagnostic imaging studies and MRF technique alike.
Acknowledgements
No acknowledgement found.References
1. Ma D, Gulani V, Seiberlich N, et al. Magnetic resonance fingerprinting. Nature. 2013;495(7440):187-192.
2. Callaghan MF, Freund P, Draganski B, et al. Widespread age-related differences in the human brain microstructure revealed by quantitative magnetic resonance imaging. Neurobiol Aging. 2014;35(8):1862-1872.
3. Suzuki S, Sakai O, Jara H. Combined volumetric T1, T2 and secular-T2 quantitative MRI of the brain: age-related global changes (preliminary results). Magn Reson Imaging. 2006;24(7):877-887.
4. Badve C, Yu A, Rogers M, et al. Simultaneous T1 and T2 Brain Relaxometry in Asymptomatic Volunteers using Magnetic Resonance Fingerprinting. Tomography. 2015;1(2):136-144.
5. Jiang Y, Ma D, Seiberlich N, et al. MR fingerprinting using fast imaging with steady state precession (FISP) with spiral readout. Magn Reson Med. 2015;74(6):1621-1631.
6. Sommer K, Amthor T, Doneva M, et al. Towards predicting the encoding capability of MR fingerprinting sequences. Magn Reson Imaging. 2017;41:7-14.
7. Hattingen E, Muller A, Jurcoane A, et al. Value of quantitative magnetic resonance imaging T1-relaxometry in predicting contrast-enhancement in glioblastoma patients. Oncotarget. 2017;8(32):53542-53551.
8. FSL. http://fsl.fmrib.ox.ac.uk. Accessed Nov 3, 2017.
9.Yushkevich PA, Piven J, Hazlett HC, et al. User-guided 3D active contour segmentation of anatomical structures: significantly improved efficiency and reliability. Neuroimage. 2006;31(3):1116-1128.
10. Hocq A, Luhmer M, Saussez S, et al. Effect of magnetic field and iron content on NMR proton relaxation of liver, spleen and brain tissues. Contrast Media Mol Imaging. 2015;10(2):144-152.
Figures
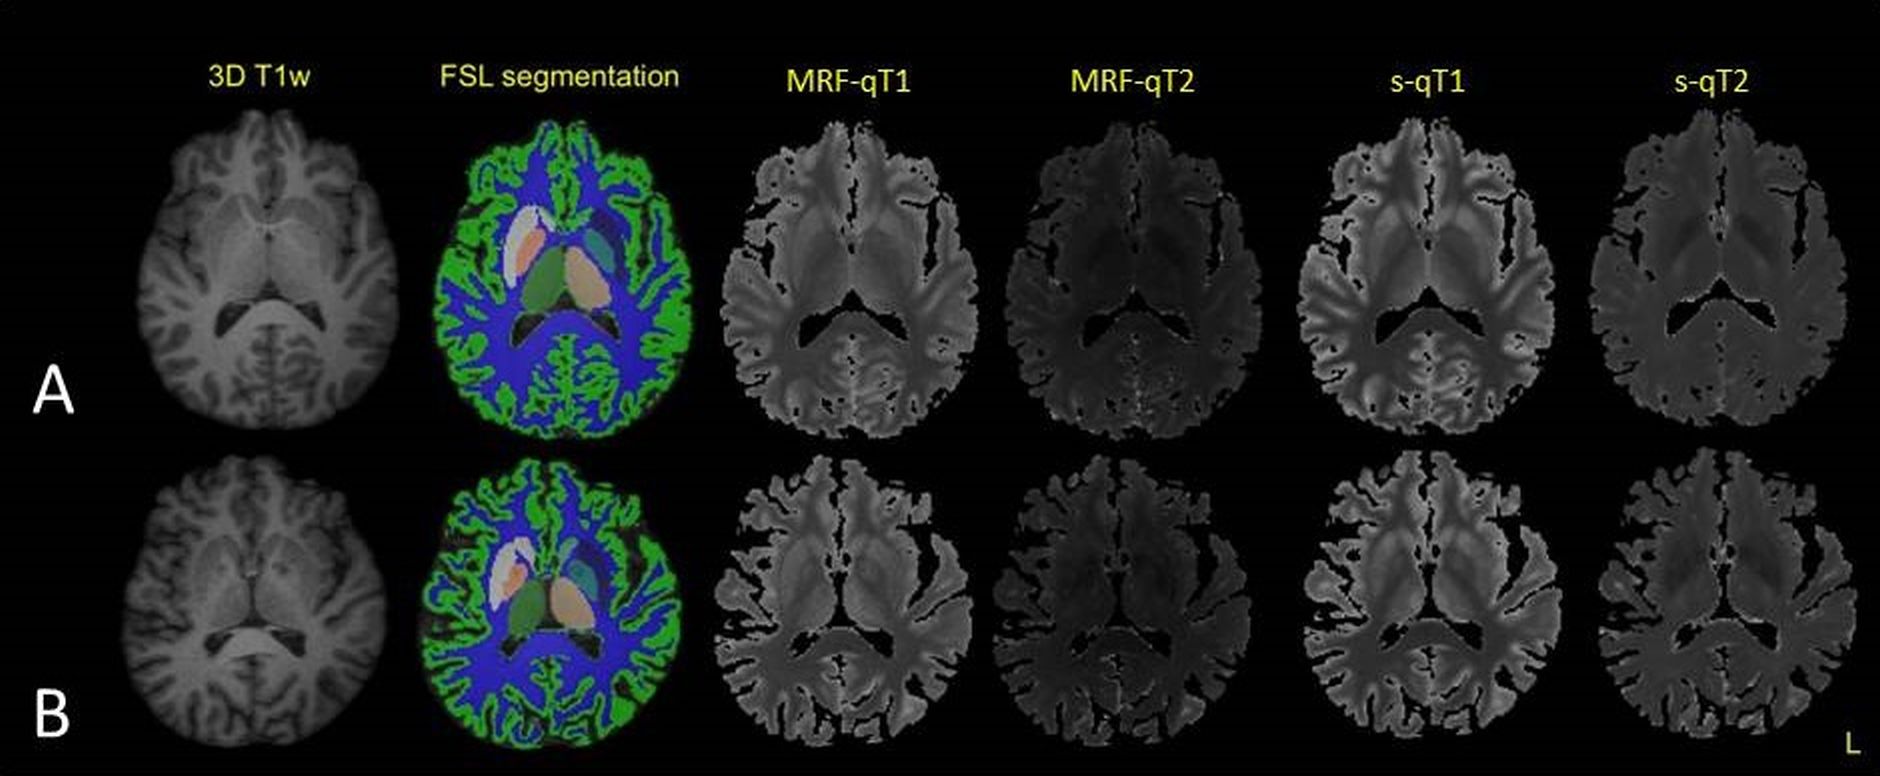
Fig. 1 Example of segmentation and relaxometric maps
A: Young healthy subject. B: Old healthy subject. The substructures analyzed were cortical gray matter, deep white matter, the hippocampus, thalamus, putamen, pallidum and caudate.
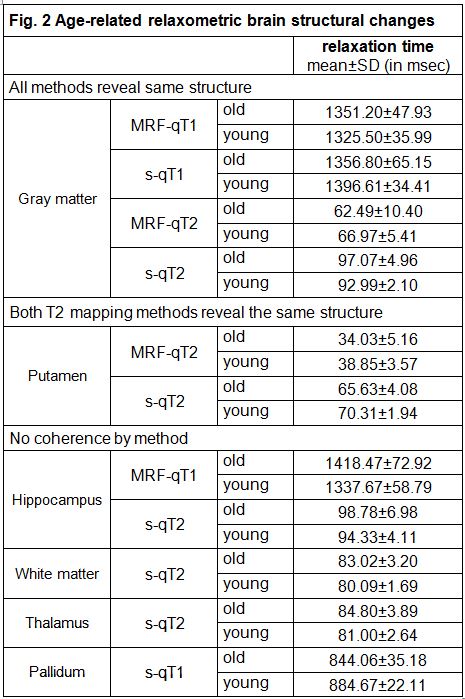
Fig. 2 Overview of relaxation times
T1 and T2 relaxation times of brain structures with significant age-related differences of relaxation times identified by standard T1 or T2 mapping (s-qT1/s-qT2) or MRF-based relaxometry (MRF-qT1/MRF-qT2). Note the inverse relationship of age and T1 relaxation in gray matter depending on whether s-qT1 or MRF-qT1 were applied and the low MRF-times in relation to s-T2 (e.g. for the putamen).
Cave. All non-significant differences between "young" and "old" are not listed.
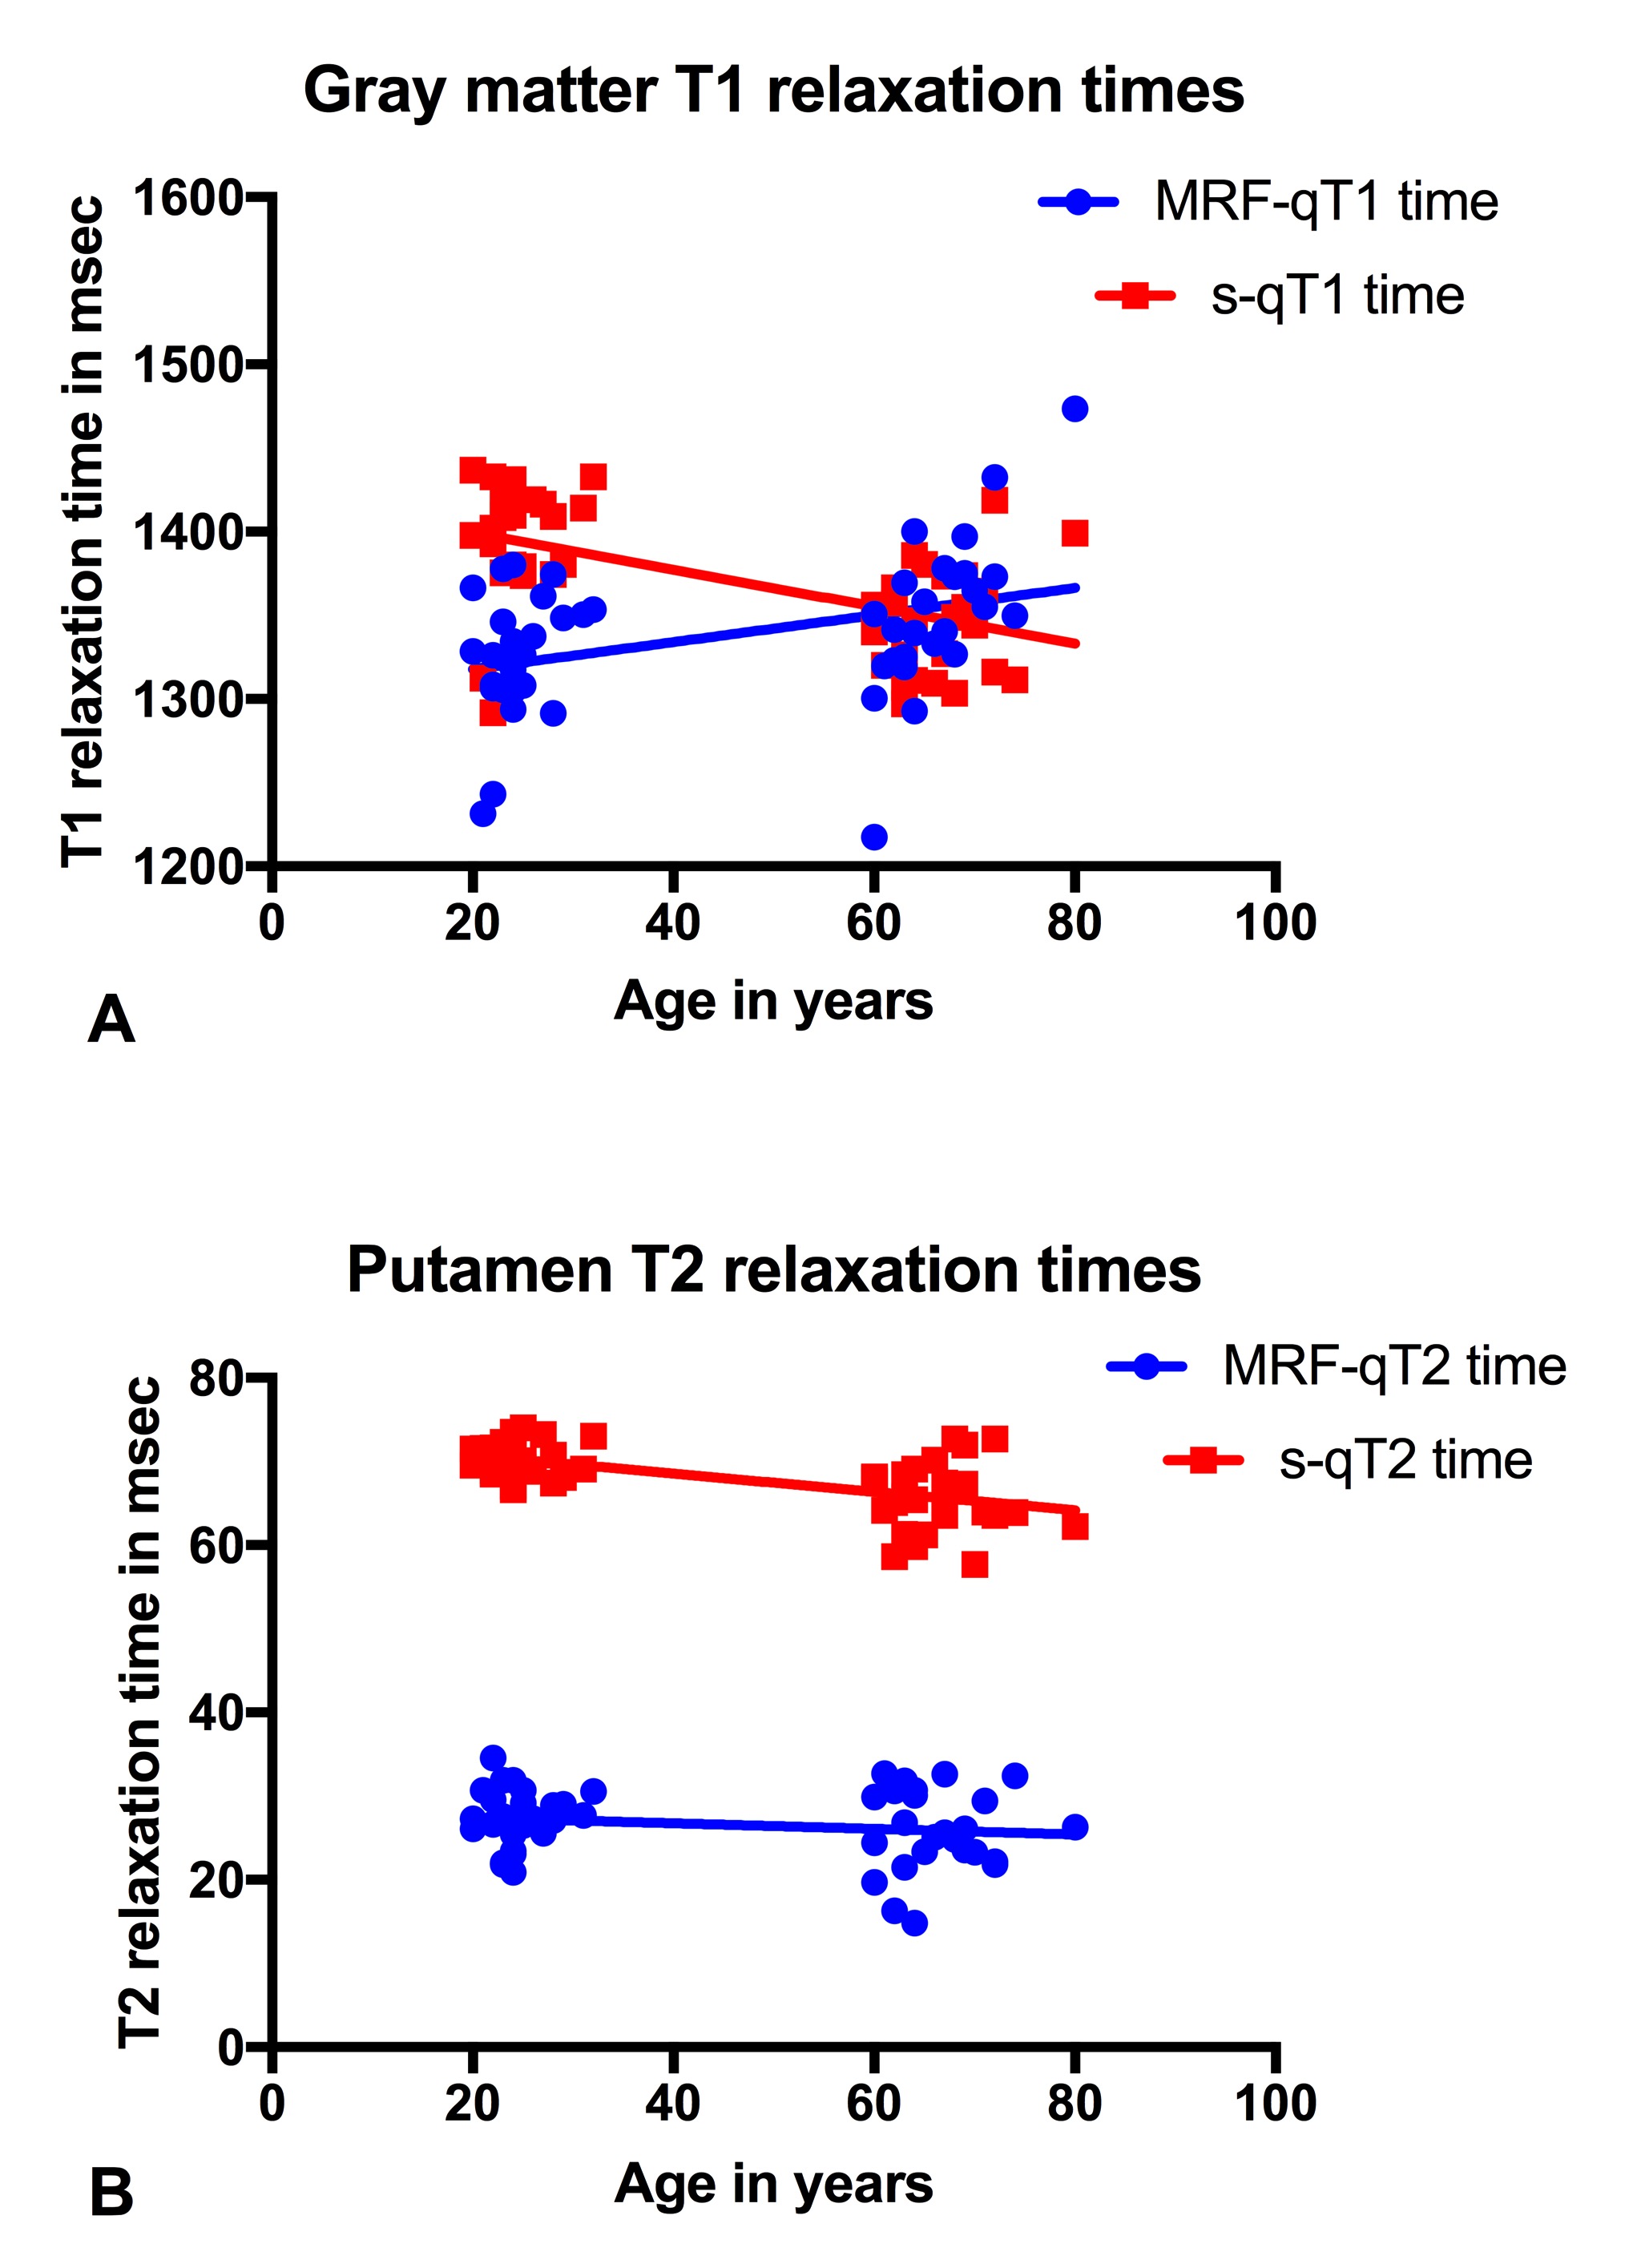
Fig. 3
A: The correlation of age with T1 relaxation was inconsistent between MRF (correlation) and standard (anti-correlation) T1 relaxometry in gray matter.
B: However no such inconsistency between methods was observed for T2 relaxation times in the putamen.