2089
Towards an optimized protocol for dynamic oxygen enhanced imaging of the brain.1University of Manchester, Manchester, United Kingdom
Synopsis
T1w dynamic oxygen-enhanced MRI (OE-MRI) has been shown to be a promising method for the assessment and quantification of tumour hypoxia. This work presents a comparison between two possible methods; FFE and IR-TFE based sequences. IR-TFE is shown to give greater contrast for oxygen induced signal change as well as increased SNR. Further sequence optimisation demonstrates the possibility of scanning at high resolution while maintaining contrast and SNR.
Introduction
Recent developments have demonstrated the potential of T1-weighted dynamic oxygen-enhanced MRI (dOE-MRI) in the characterization of normal and pathological tissue oxygenation in the abdomen and thorax. In this work we compare alternative protocols, focusing on the dynamic signal curve, with the aim of optimizing a protocol for dOE-MRI of brain tumours and other neurological pathology. Initially we compare an existing FFE sequence (designed for variable flip angle (VFA) T1 mapping, developed in-house for brain tumour dOE-MRI), with a modified IR-TFE (for variable inversion time (VTI) T1 mapping, developed for dOE-MRI lung imaging)1. Further, we assess the effects of spatial and temporal resolution on the signal dynamics of the IR-TFE sequence.Methods
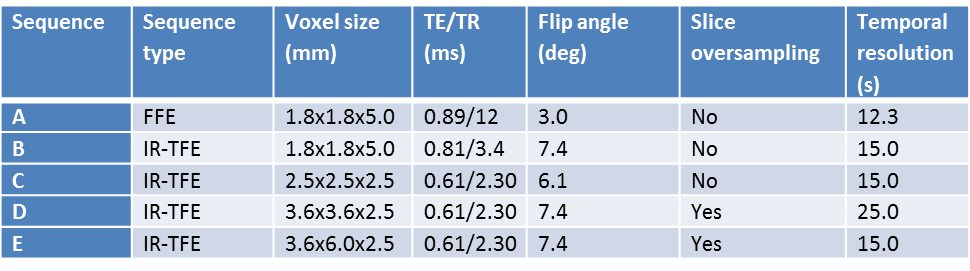
Five protocols were implemented; the FFE sequence and four instances of the IR-TFE (see Table 1). For IR-TFE, inversion time (TI) and flip angle (θ) can be optimized to maximize signal contrast for the tissue of interest2 and to minimize signal decay during readout and maintain T1 weighting3. TI was set at 950 ms and θ adjusted accordingly as an estimation of the optimum for grey matter. Data were acquired for one subject on a Philips Achieva 1.5 T MRI scanner. For each sequence, dynamic data were acquired for approximately 8 minutes, with the participant breathing medical air (21% O2) for 2.5 minutes then 100% O2 for the remaining time. A high resolution T1w scan was acquired for registration and tissue classification. Data were pre-processed using tools developed in-house and within FSL (FSL v5.0, https://fsl.fmrib.ox.ac.uk/fsl/fslwiki/). Dynamic data were brain extracted, motion corrected, and a 4D median filter applied to improve SNR. Grey matter (GM), white matter (WM) and cerebrospinal fluid (CSF) masks were created from segmentation of the high resolution T1w scan. These masks were eroded to reduce mislabelling and partial volume effects, and transformed to the space of each dynamic sequence. Mean signal was extracted from each tissue mask. To allow for comparison across sequences, each time series was normalized to the average of the first seven time points (the number of volumes of the baseline in the lowest sampled sequence). The analysis was repeated using region of interest masks of approximately 75 cm3 centred midway between the most superior and inferior slices and arbitrarily in right middle frontal gyrus (GM), anterior corona radiata (WM) and lateral ventricle (CSF).
Results
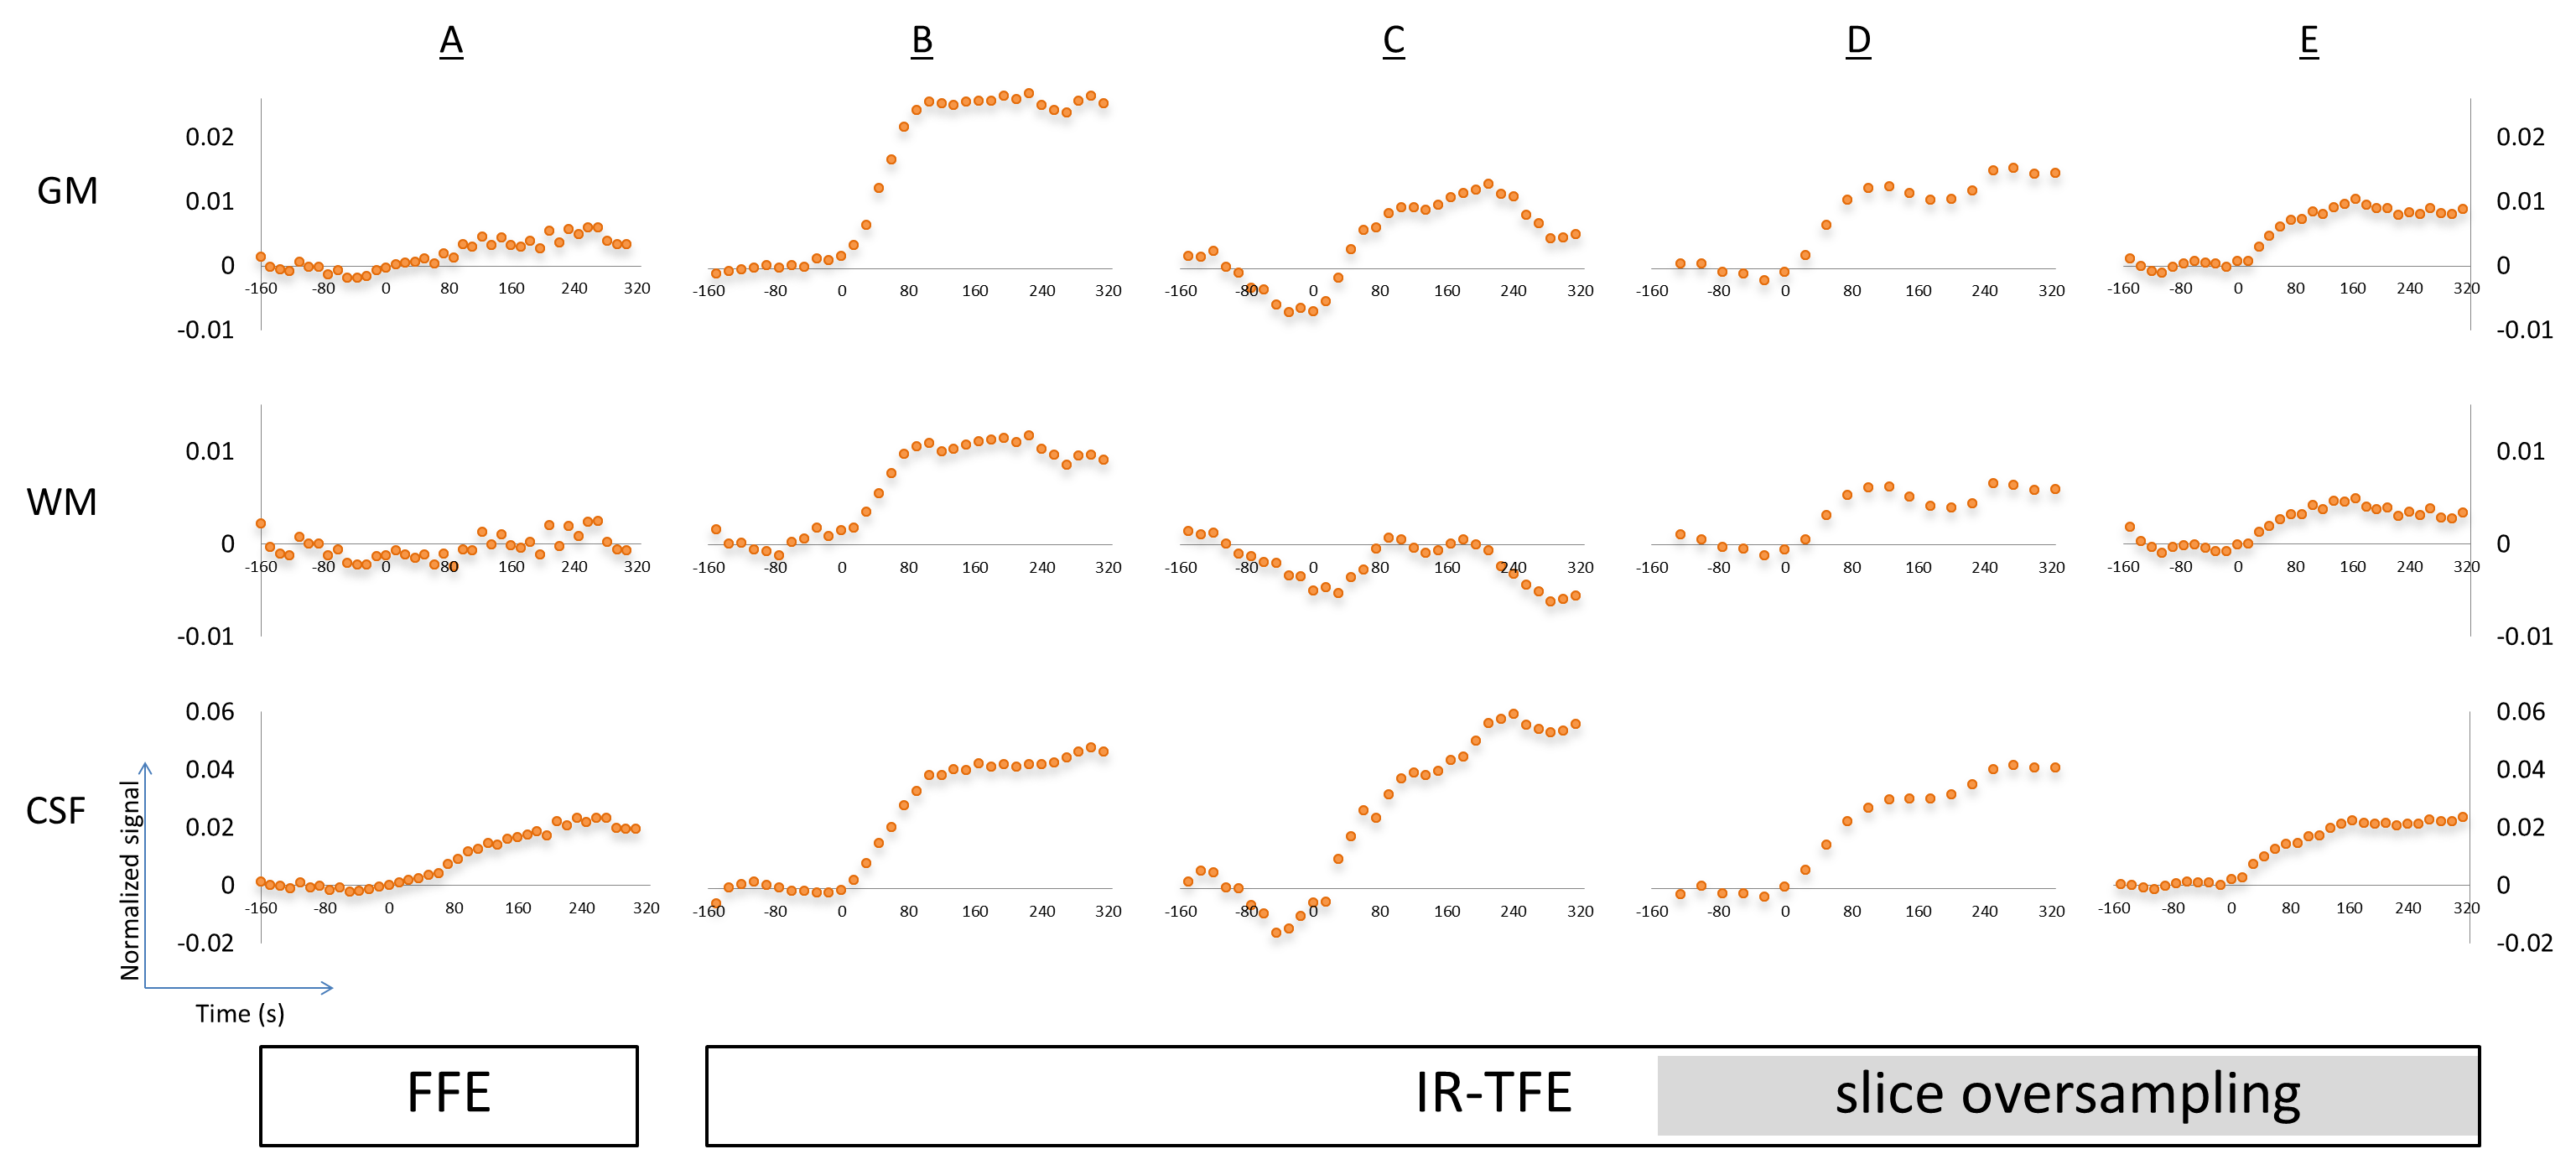
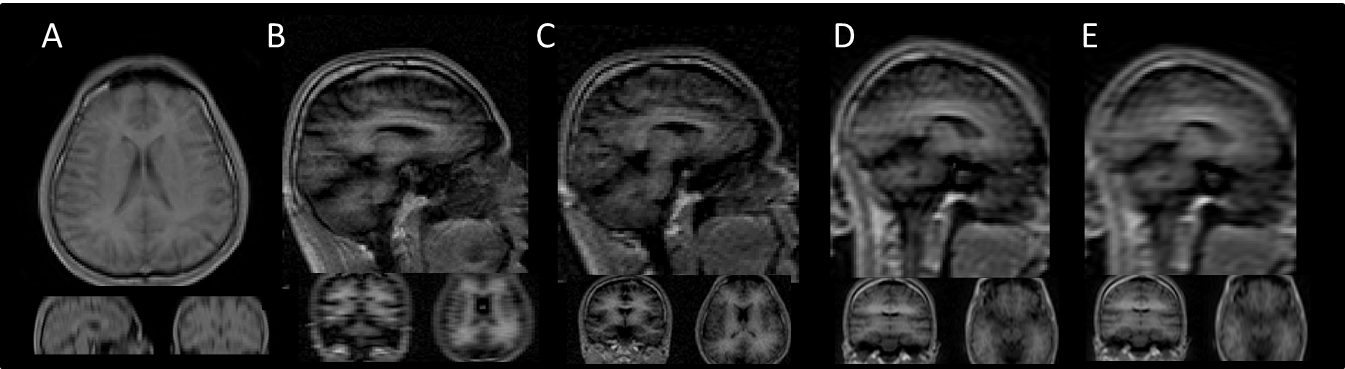
Figure 1 shows one volume from each dynamic sequence. Figure 2 shows graphs of normalized signal change over time for each sequence and tissue type for the whole brain analysis. With comparable geometry, IR-TFE demonstrates an approximately 5-fold increase in contrast between air and 100% O2 over FFE. All IR-TFE sequences demonstrate reduction in noise, particularly in grey and white matter. Smaller voxel sizes are accompanied by a decrease or total loss of oxygen induced contrast. Slice oversampling does not improve contrast at smaller voxel sizes, except for a modest increase in WM. Results from the region of interest analysis follow the same trend as the whole brain analysis. In general we expect a relatively larger increase in CSF and GM compared to WM and a quicker increase in GM and WM compared to CSF. For FFE, results are broadly as expected, with larger increases seen in CSF and GM compared to WM, although WM signal is not clearly separable from baseline. GM signal plateaus at ~100 s and CSF continues to increase up to ~270 s. For IR-TFE sequences, signal plateaus at approximately 100 s for both GM and WM, although no discernible WM signal is apparent for protocol C (isotropic, high resolution). Signal in CSF tends to rapidly increase up to 100 s, followed by a shallower but continual increase throughout the remainder of the scan. The large difference in nominal resolution and point spread function between the IR-TFE protocols is clear in Fig. 1, and this is likely to influence the specificity of the dynamic curves shown in Fig. 2.Conclusions
IR-TFE demonstrates a clear improvement over FFE for detecting oxygen induced signal changes in the brain. Signal change remains detectable in GM and CSF with 2.5 mm isotropic voxels (at 1.5 T). Signal change is still detectable in WM with smaller voxels (3.6 x 3.6 x 2.5 mm3) using slice oversampling with a loss in temporal resolution (25 s), or with slightly larger voxels (3.6 x 6.0 x 2.5 mm3) at a maintained temporal resolution of 15 s; however, these signals may be contaminated due to partial volume effects and an extended point spread function, suggesting that a high resolution IR-TFE approach is optimum, even with reduced SNR. Further work will test reproducibility and the application to measuring oxygen-induced T1 changes, particularly in brain tumours.Acknowledgements
This work was supported by CRUK [C8742/A18097]. This is a contribution from the Cancer Imaging Centre in Cambridge & Manchester, which is funded by the EPSRC and Cancer Research UK.References
1. Ulloa et al. ISMRM p3973; 2015
2. https://www.itis.ethz.ch/virtual-population/tissue-properties/database/relaxation-times/
3. Loffler et al. MRM 43:860-866 (2000)
Figures