2087
Observing the Hyaluronan Component of the Extracellular Matrix in the Brain with Quantitative MRI1NMR Unit, Max Planck Institute for Human Cognitive and Brain Sciences, Leipzig, Germany, 2Department of Neurophysics, Max Planck Institute for Human Cognitive and Brain Sciences, Leipzig, Germany, 3Paul Flechsig Institute for Brain Research, University of Leipzig, Leipzig, Germany
Synopsis
The tissue composition of the brain can be related to different contrast sources in quantitative MRI. Notably, T1 and T2* strongly correlate with myelin and iron. However, other components may play a role in contrast generation. In particular, the hyaluronan component of the extracellular matrix has been recently proposed as a possible important contributor to MRI contrast. Here, we quantify the bulk contribution of hyaluronan to quantitative relaxation maps. This is obtained by characterizing the evolution of the relevant MRI parameters over time during the enzymatic digestion of the hyaluronan.
Purpose
Quantitative MRI is a promising technique for investigating the tissue composition of the brain. In particular, myelin and iron content are related to $$$T_1$$$ and $$$T_2^*$$$ relaxation1,2,3. However, other tissue components may also influence the MR signal. Based on results from synthetic samples4 and connective tissue5,6, the hyaluronan component of the ExtraCellular Matrix (ECM) has been previously investigated for potential contributions to MRI contrast in post-mortem samples7,8. These results suggested some effects related to the hyaluronan presence. However, the intensity of these effects is comparable to the influence of confounding experimental conditions that are difficult to control (e.g. post-mortem delay, time in fixative, fixative purity, temperature, etc.) and whose effects have been documented9,10 but are poorly understood. Here, we investigate removal of the hyaluronan component of the ECM during the enzymatic digestion, with improved control over parameters that are difficult to assess.Methods
The hyaluronan component of the ECM in nervous tissue can be effectively removed by enzymatic digestion, which is believed to disassemble the macromolecular scaffold of the ECM, as shown in Fig.1.
To study the MRI effects of the hyaluronan removal, two post-mortem samples ($$$\approx40×20×5\mathrm{mm^3}$$$), obtained by splitting a specimen from the halamus of a deceased male donor (age: 49, cause-of-death: heart failure, no neuropathological abnormalities), were fixed with $$$4\;\mathrm{\%}$$$ ParaFormAldehyde (PFA) for 6 weeks and later stored in a $$$0.1\;\mathrm{M}$$$, pH $$$7.4$$$ phosphate-buffered saline (PBS) solution at $$$4\;\mathrm{°C}$$$. The two samples where arranged in two separate half-spherical sealed containers that were bundled together for the measurements. One sample was treated with with hyaluronidase from bovine testis (Sigma H3884), with up to $$$\approx{}4500\;\mathrm{units/ml}$$$, while the other one was used as control. Both samples were kept at $$$37\;\mathrm{°C}$$$ for $$$\approx{}7\;\mathrm{weeks}$$$, while being temporarily brought to room temperature (almost) daily for $$$\approx{}3\;\mathrm{hours}$$$ during the MRI measurements. Images were acquired using a MAGNETOM 7T (Siemens, Erlangen, Germany) and a circularly-polarized Rx/Tx cross coil for small samples. During each session, quantitative $$$T_1$$$ and $$$T_2^*$$$ 3D maps ($$$330\;\mathrm{\mu{}m}$$$ isotropic) were recorded using MP2RAGE and multi-echo FLASH, respectively.
Results were assessed by computing the volume mean value over the sample during the treatment. Additionally, to verify the effectiveness of the digestion, the two samples were sliced and stained for hyaluronan (with bHABP).
Results
Examples of $$$T_1$$$ and $$$T_2^*$$$ maps acquired at the beginning and at the end of the enzymatic digestions are shown in Fig.2. The evolution of the mean values over time for both contrast in the two samples and their difference is reported in Fig.3, where a chaotic pattern is observed.
The same data after a moving-average over the time dimension with a window of 11 data points (corresponding to approximately 14 days) is shown in Fig.4, where a variation in the $$$T_1$$$ and $$$T_2^*$$$ values at the two ends of the time-line is observed. The images of the hyaluronan staining reported in Fig.5 indicate that the digestion was very effective, whereas substantial amounts of hyaluronan were still present in the control specimen.
Discussion
Results from previously reported experiments7 have led to the hypothesis that significant contrast changes may be related to the hyaluronan removal, while subsequent studies8 indicated that the intensity of the effect is similar to fluctuations of the values related to the experimental conditions. This ambiguity has been resolved by the presented results, where the fluctuations over time indicate that a single measurement of both the digested and the control samples may be insufficient to conclusively detect the effects of the hyaluronan removal, and averaged results are required. In particular, the removal of hyaluronan is associated with shorter $$$T_1$$$ and $$$T_2^*$$$ values. The directionality of this result is the opposite of what the theory11 and experiments4 would predict for hyaluronan in water solutions, as higher concentrations of the relaxant are associated with shorter relaxation times, while this experiments show lower $$$T_1$$$ and $$$T_2^*$$$ values associated with hyaluronan absence. We suggest that hyaluronan in brain tissues prevents (with unknown mechanisms -- possibly related to the non-compact myelin microstructure) the energy exchange of water protons with more efficient relaxation agents like lipids, and hence its removal favor the processes responsible for $$$T_1$$$ relaxation. Note that the average relaxation times, even for the control sample, are not stable over time, suggesting the presence of additional ongoing variations at microstructural level.Conclusion
In this work, we provided substantial evidence of the effects of the hyaluronan removal on relaxation parameters in MRI. Concomitantly, the experiments indicate some instability both in the experimental conditions and in the microstructural state of post-mortem "fixed" samples that require further investigation.Acknowledgements
We would like to thank the following people for insightful discussions: Henrik Marschner, Tobias Streubel, Stefan Geyer, Katja Reimann, Andreas Schäfer, Evgeniya Kirilina and Nikolaus Weiskopf.
Funded by: EU through the 'HiMR' Marie Curie ITN (FP7-PEOPLE-2012-ITN-316716), the Max Planck Society through IMPRS NeuroCom, the Helmholtz Alliance 'ICEMED - Imaging and Curing Environmental Metabolic Diseases', the German Research Foundation (SPP 1608 Mo2249/2-1), the EU-COST Action BM1001, the Alzheimer Forschungsinitiative e.V. (AFI #11861) and the Federal State of Saxony.
References
- Stüber, C., Morawski, M., Schäfer, A., Labadie, C., Wähnert, M., Leuze, C., Streicher, M., Barapatre, N., Reimann, K., Geyer, S., Spemann, D., Turner, R., 2014. Myelin and iron concentration in the human brain: A quantitative study of MRI contrast. NeuroImage 93, Part 1, 95–106. https://doi.org/10.1016/j.neuroimage.2014.02.026
- Rooney, W.D., Johnson, G., Li, X., Cohen, E.R., Kim, S.-G., Ugurbil, K., Springer, C.S., 2007. Magnetic field and tissue dependencies of human brain longitudinal 1H2O relaxation in vivo. Magn. Reson. Med. 57, 308–318. https://doi.org/10.1002/mrm.21122
- Drayer, B., Burger, P., Darwin, R., Riederer, S., Herfkens, R., Johnson, G., 1986. MRI of brain iron. American Journal of Roentgenology 147, 103–110. https://doi.org/10.2214/ajr.147.1.103
- Laurens, E., Schneider, E., Winalski, C.S., Calabro, A., 2012. A synthetic cartilage extracellular matrix model: hyaluronan and collagen hydrogel relaxivity, impact of macromolecular concentration on dGEMRIC. Skeletal Radiol 41, 209–217. https://doi.org/10.1007/s00256-011-1331-z
- Nishioka, H., Hirose, J., Nakamura, E., Oniki, Y., Takada, K., Yamashita, Y., Mizuta, H., 2012. T-1 rho and T-2 mapping reveal the in vivo extracellular matrix of articular cartilage. J. Magn. Reson. Imaging 35, 147–155. https://doi.org/10.1002/jmri.22811
- Li, X., Majumdar, S., 2013. Quantitative MRI of articular cartilage and its clinical applications. J. Magn. Reson. Imaging 38, 991–1008. https://doi.org/10.1002/jmri.24313
- Metere, R., Morawski, M., Marschner, H., Jäger, C., Streubel, T., Geyer, S., Reimann, K., Schäfer, A., Möller, H.E., 2015. Possible Contribution of the Extracellular Matrix to the MRI Contrast in the Brain, in: Proceedings of the ISMRM 23rd Annual Meeting & Exhibition. Presented at the 23rd Annual Meeting & Exhibition of the International Society for Magnetic Resonance in Medicine, Toronto, Canada.
- Metere, R., Morawski, M., Jäger, C., Möller, H.E., 2016. Quantitative MRI Explorations of the Hyaluronan-Based Extracellular Matrix in Brain Tissues, in: Proceedings of the ISMRM 24th Annual Meeting & Exhibition. Presented at the 24th Annual Meeting & Exhibition of the International Society for Magnetic Resonance in Medicine, Singapore.
- Shepherd, T.M., Flint, J.J., Thelwall, P.E., Stanisz, G.J., Mareci, T.H., Yachnis, A.T., Blackband, S.J., 2009a. Postmortem interval alters the water relaxation and diffusion properties of rat nervous tissue — Implications for MRI studies of human autopsy samples. NeuroImage 44, 820–826. https://doi.org/10.1016/j.neuroimage.2008.09.054
- Shepherd, T.M., Thelwall, P.E., Stanisz, G.J., Blackband, S.J., 2009b. Aldehyde fixative solutions alter the water relaxation and diffusion properties of nervous tissue. Magn. Reson. Med. 62, 26–34. https://doi.org/10.1002/mrm.21977
- Solomon, I., 1955. Relaxation Processes in a System of Two Spins. Phys. Rev. 99, 559–565. https://doi.org/10.1103/PhysRev.99.559
- Morawski, M., Brückner, G., Jäger, C., Seeger, G., Matthews, R.T., Arendt, T., 2012. Involvement of Perineuronal and Perisynaptic Extracellular Matrix in Alzheimer’s Disease Neuropathology. Brain Pathol 22, 547–561. https://doi.org/10.1111/j.1750-3639.2011.00557.x
- Morawski, M., Dityatev, A., Hartlage-Rübsamen, M., Blosa, M., Holzer, M., Flach, K., Pavlica, S., Dityateva, G., Grosche, J., Brückner, G., Schachner, M., 2014. Tenascin-R promotes assembly of the extracellular matrix of perineuronal nets via clustering of aggrecan. Phil. Trans. R. Soc. B 369, 20140046. https://doi.org/10.1098/rstb.2014.0046
Figures
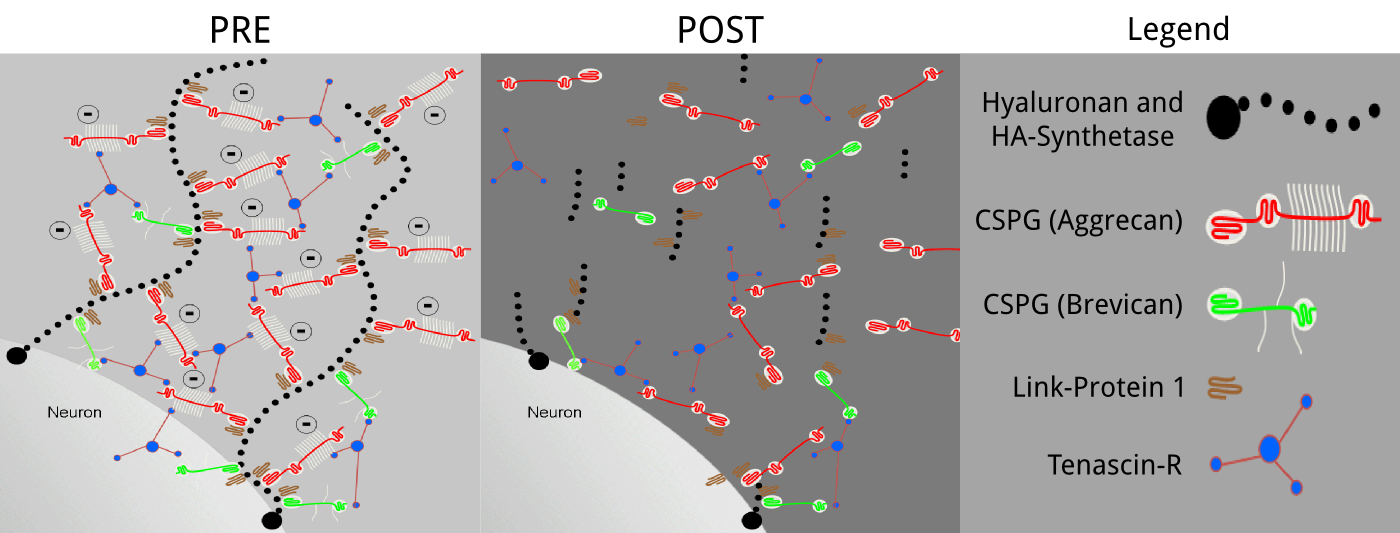
Fig.1: Diagram of the potential hyaluronan-based ECM configuration.
The ECM of brain tissues is composed primarily of hyaluronan polymer chains anchored to the membrane of the cells and provides a scaffold for proteoglycans and other specialized structures that have a strong negative charge and are believed to determine its physiological function12,13. The possible molecular arrangement of the ECM is shown before (PRE) and after (POST) the enzymatic digestion.
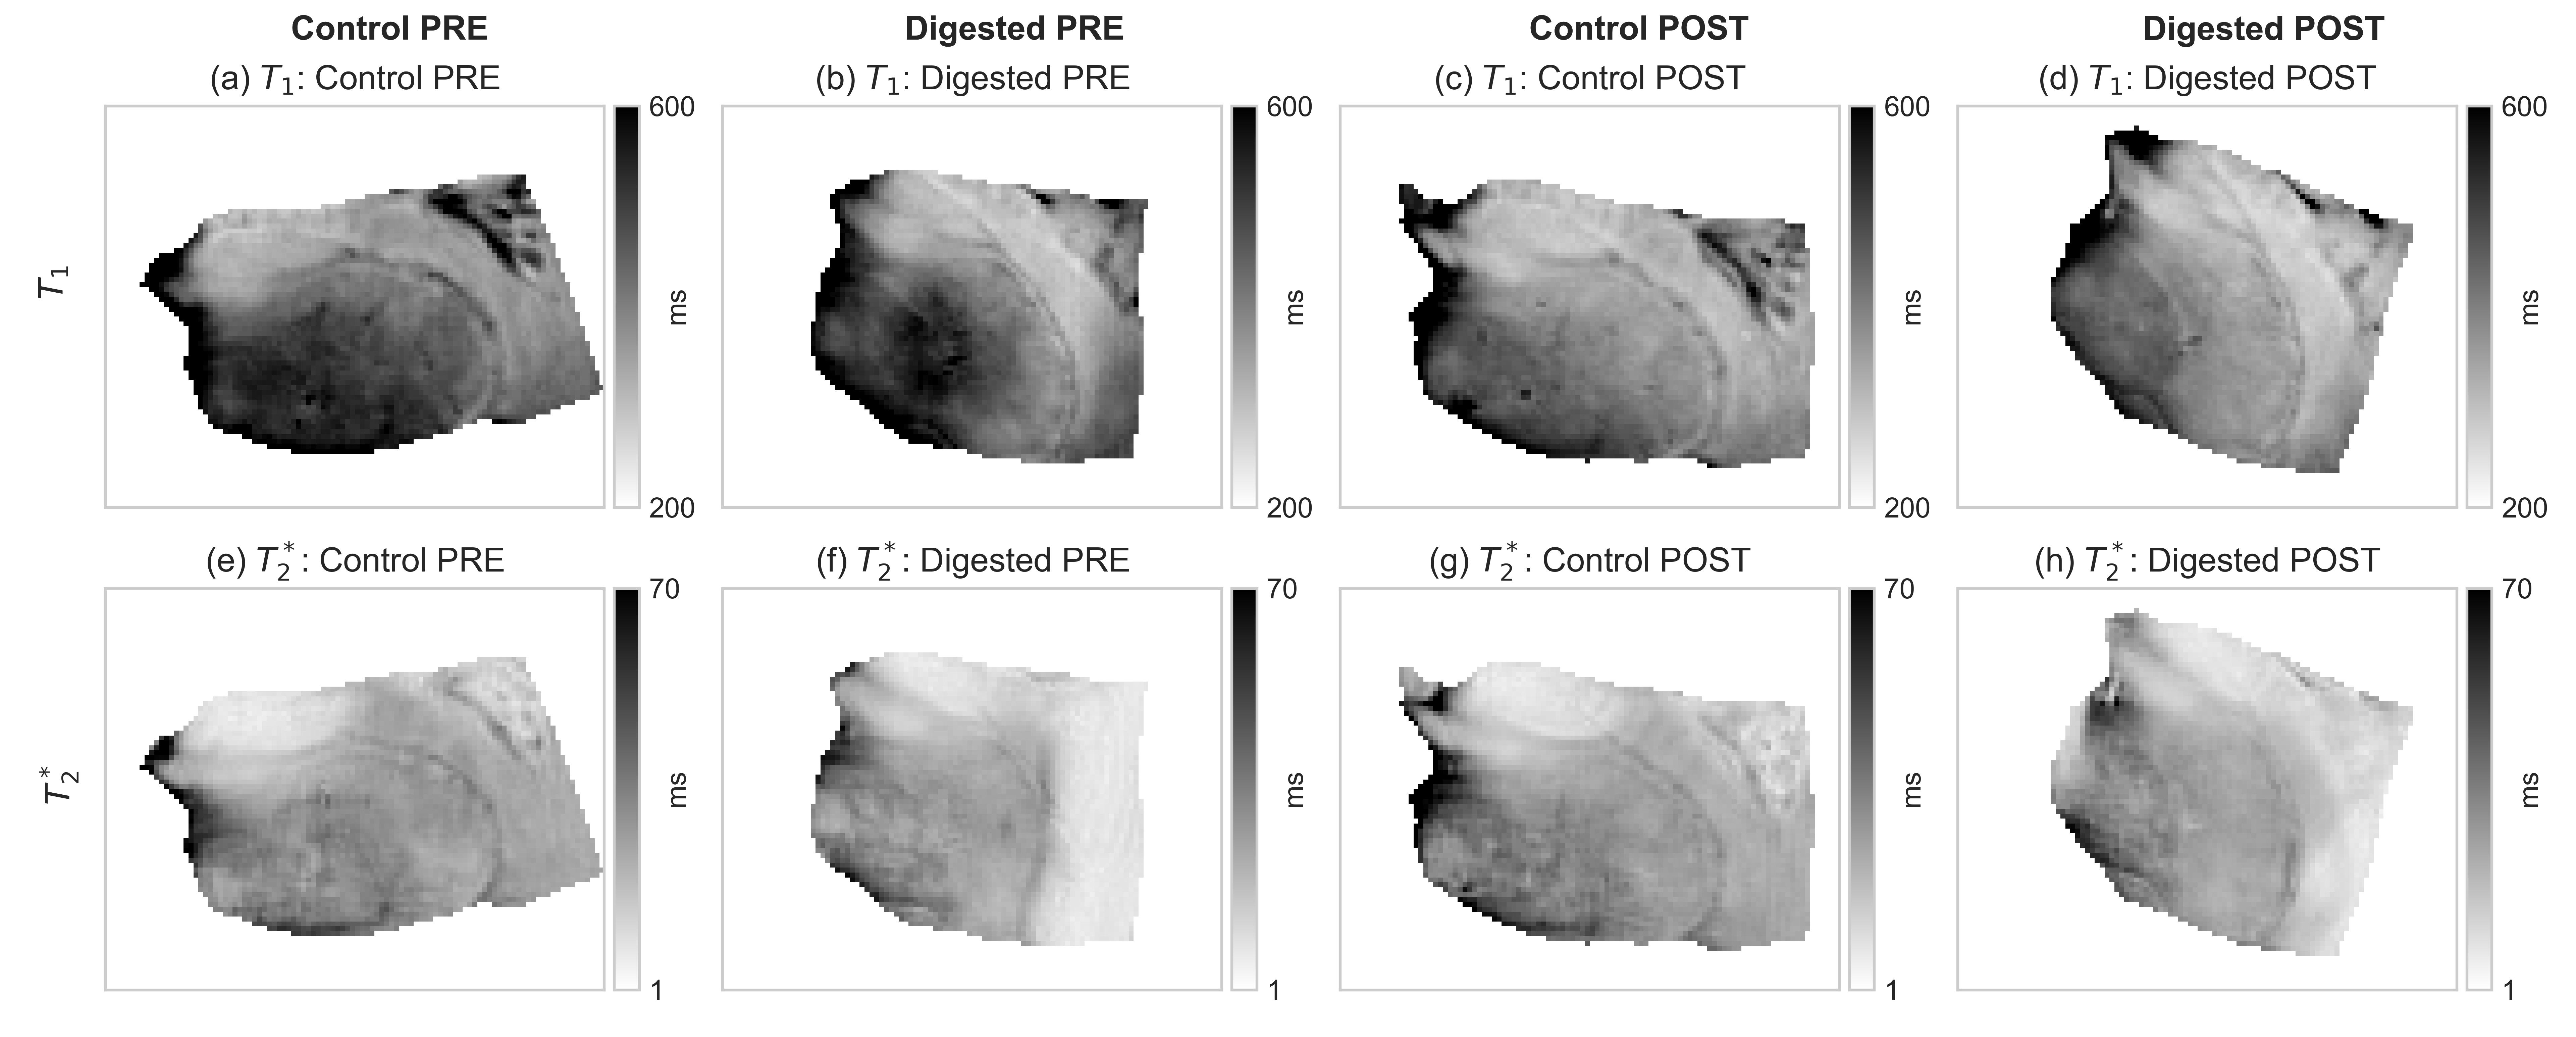
Fig.2: Relaxation maps before (PRE) and after (POST) the hyaluronan removal.
Results for $$$T_1$$$ and $$$T_2^*$$$ are reported for both the two samples (digested and control). It is difficult to assess visually the effects of the enzymatic hyaluronan removal by examining a single image (randomly selected). The PRE images correspond to 1 day before starting while, the POST images refer to 42 days after the beginning of the digestion. Note that $$$B_1^+$$$ and $$$B_0$$$ variations due to shimming and other scanner adjustments may have an effect on the observed relaxation values.
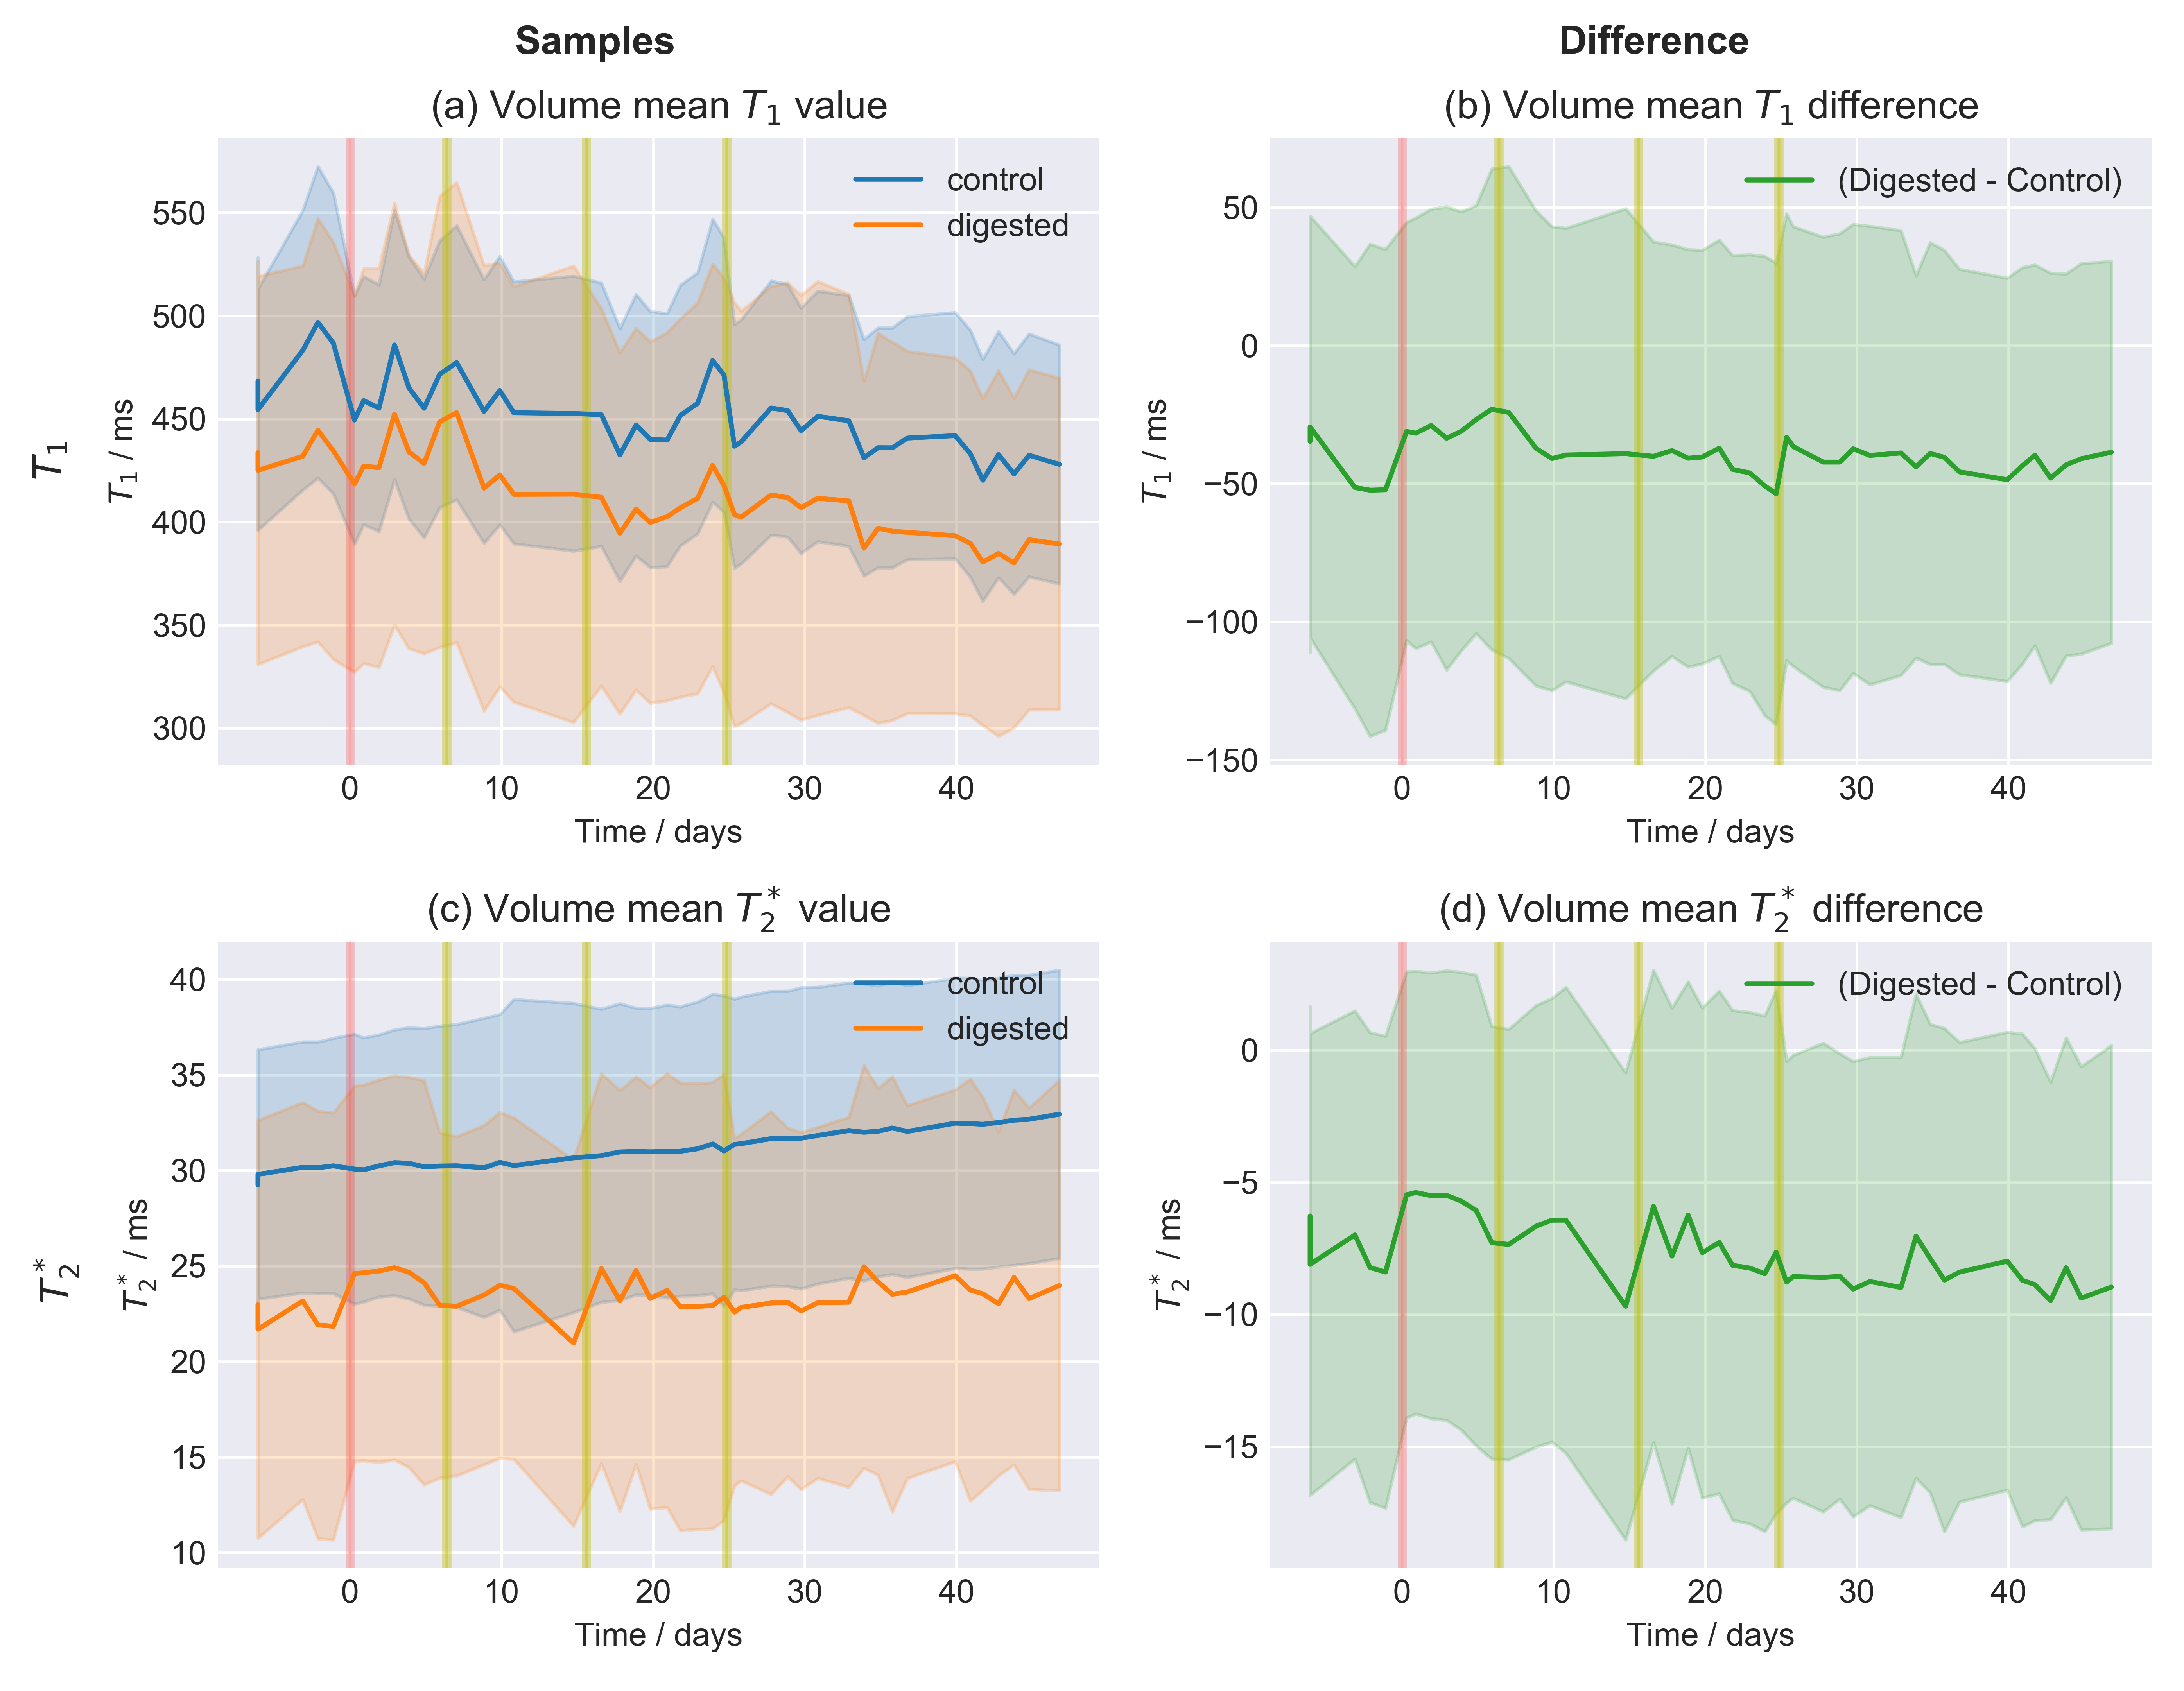
Fig.3: Time series of the relaxation values.
The reported values were average over the entire sample volume. The area around the curve indicates the volume standard deviation. Results for $$$T_1$$$ and $$$T_2^*$$$ are reported for both the two samples (digested and control) and their difference. The trend over time, accompanying the enzymatic digestion process, is unclear. Some data for which the automatic registration procedure failed were removed. The beginning of the enzymatic digestion is marked in red, while yellow lines indicate the time points at which new enzymes were introduced (to ensure high enzymatic activity).
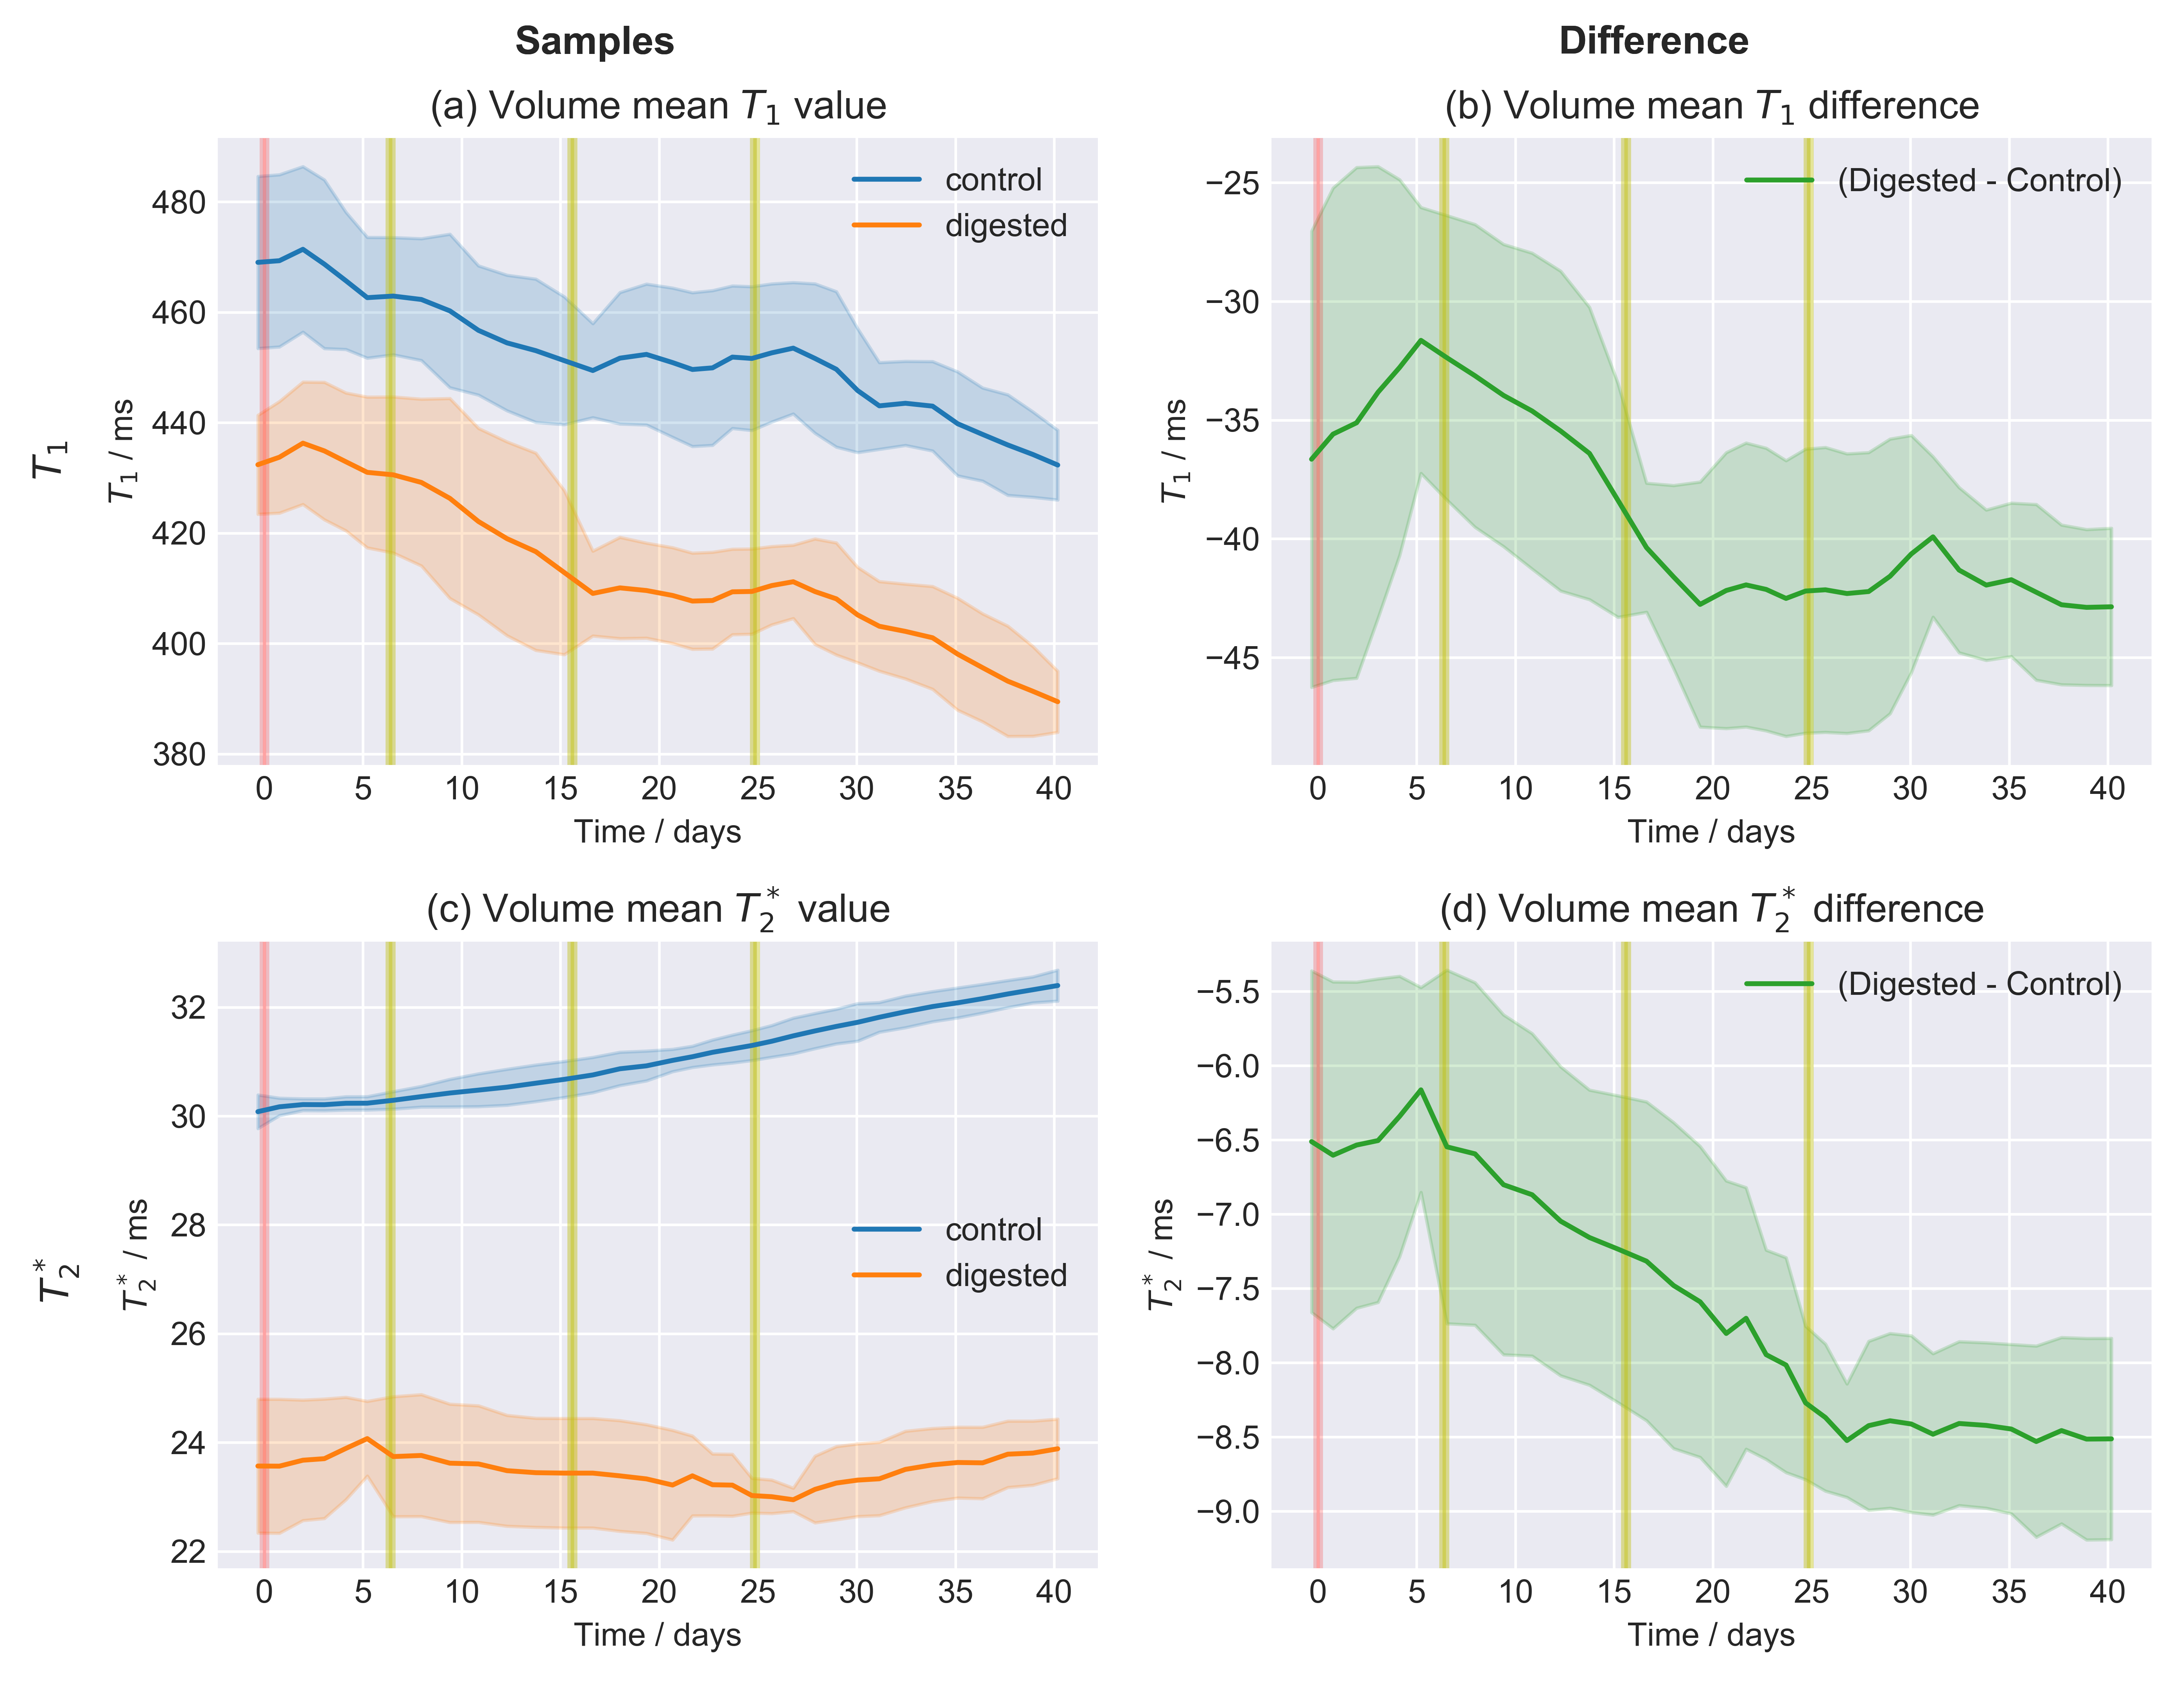
Fig.4: Moving average over time of the time series of the relaxation values.
The area around the curve indicated the moving standard deviation with the same window as the moving average. The values of the digested sample do decrease over time with respect to the control and this change is attributed to the enzymatic digestion of the hyaluronan. A time window of 11 points, corresponding to approximately 14 days, has been chosen. This is the minimal value for which the moving standard deviation was visually approximately constant for most data points.

Fig.5: Optical staining for Hyaluronan in the digested and control samples.
The heterogeneous distribution of the hyaluronan and the typical abundance in the labeled Regions-Of-Interest (ROIs) can be inferred from the control, while the image of the digested sample indicate the effectiveness of the hyaluronan removal. The indicated ROIs for the Thalamus region are: STR: striatum, CN: caudate nucleus, CI: internal capsule, CP: cerebral peduncle, STN: subthalamic nucleus, ZI: zona incerta, MB: mamillary body. Within the Thalamus, in green, we indicated: VP: ventroposterior part, MD: mediodorsal part, CM: centromedian part, RT: reticular thalamic nucleus.