2085
Changes in Quantitative Free Water Content with Increasing BMI in Elderly Subjects1Institute of Medical Imaging Physics INM-4, Research Centre Jülich, Jülich, Germany, 2Institute of Neuroscience and Medicine (INM-4), Research Centre Jülich, Jülich, Germany, 3Jülich Aachen Research Alliance (JARA), Jülich, Germany
Synopsis
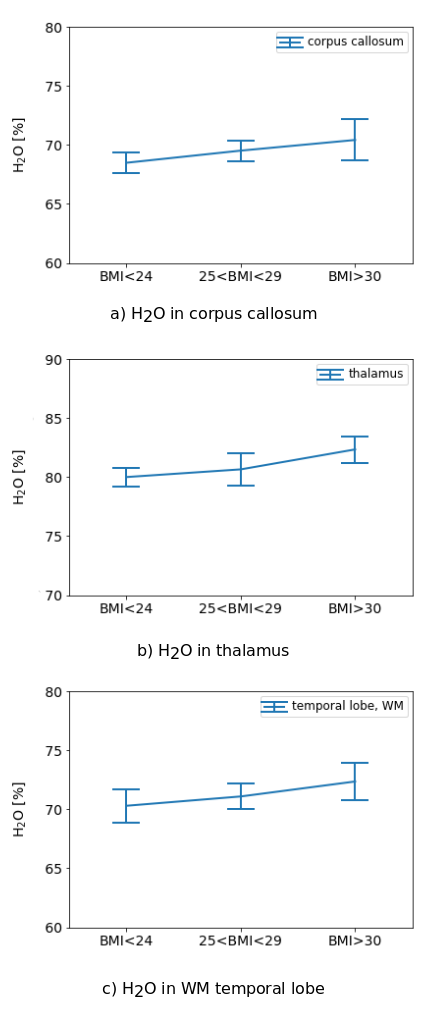
A high body mass index is known to play a role in a variety of chronic diseases, which makes it an important biomarker. Using a 3D two-point quantitative mapping method, changes in several parameters including relaxation times, H2O and magnetisation transfer measures were investigated in lean and obese subjects. Preliminary results show a significant increase of H2O in corpus callosum (p<0.05), thalamus (p<0.005) and white matter of temporal lobe (p<0.05) with increasing BMI. Changes in the other parameters did not reach significance. These findings suggest the existence of regional low-grade brain inflammation in obesity.
Introduction
The obesity epidemic affects millions of people worldwide, especially in the USA and in industrialized countries1. This disorder carries with it a risk for a variety of chronic diseases, involving cardiovascular, digestive, respiratory, reproductive and central nervous systems. Neuroimaging has become a useful tool for investigating the link between the increased body mass index (BMI) and changes in the brain. Several studies have already reported poor cognitive performance and atrophy of certain brain regions in the obese individuals compared to lean ones2-4. In this study, the quantitative MR parameters H2O content, longitudinal relaxation time, T1, transversal relaxation time, T2*, and magnetisation transfer (MT) measures of the brain were investigated in an ongoing large cohort study.Methods
The quantitative parameters H2O, T1, T2* and MT measures (magnetisation transfer ratio, MTR, exchange rate, kex , bound proton fraction, fbound) were derived using a 3D 2-point method5. The protocol consists of five sequences: an M0-weighted (α=7◦) and a T1-weighted multi-echo gradient echo (meGRE) (α=40◦) both with and without MT (off-resonance frequency -1.5kHz), respectively, and an actual flip angle sequences6 (AFI) (α=40◦) to map the transmit field, B1+. Other imaging parameter for the meGREs (AFI) were set as follows: TR=50ms (150ms), 18 echoes (12 for MT preparation), 1x1x2mm3 resolution (2.8x2.8x4.0mm3), matrix size 162x192x96 (54x64x48), bandwidth 650Hz/px (330Hz/px), phase and slice partial Fourier 6/8, parallel imaging using GRAPPA factor 2 with 24 reference lines. The total acquisition time for the quantitative protocol was TA=14:20min. The preliminary results include 19 subjects (11 male, 8 female, age=68.6+/-13.8), drawn from the population-based cohort study 1000BRAINS, assessing the influence of environmental and genetic factors on the variability of structure and function of the aging brain7. Subjects were divided into three groups: I) BMI<24 (normal), II) 25<BMI<29 (overweight), III) BMI>30 (obese). Measurements were conducted on a 3T Tim system (Siemens). An RF body coil with homogeneous RF field distribution over the head was used for RF transmit, whereas a 32-channel phased-array coil was used for signal receive. All post-processed quantitative images were brought to the common MNI space using the1.5x1.5x1.5mm3 T1 template. Global mean values of white matter (WM) and grey matter (GM) were calculated. The software package statistical parametric mapping8 SPM12 was used to segment the brain, yielding the probability of each voxel belonging to given tissue types. Tissue masks were produced using a threshold of 99%. Additionally, for the following regions of interest (ROI) open-access masks in MNI space were used: head of caudate, putamen, thalamus, corpus callosum as well as frontal, occipital, parietal and temporal lobe. ROI were specified using WM and GM probability mask, respectively. An unpaired t-test was conducted between all group parings to test for significant changes.
Results
During the preliminary study, significant changes between the BMI group I and III in H2O were found in corpus callosum (p<0.05), thalamus (p<0.005) and WM of temporal lobe (p<0.05). All changes are depicted in Fig. 1 a)-c). No significant changes for global H2O, T1, T2* and MTR, nor any region of interest for T1, T2* and MT measures were found.Discussion
Preliminary results show a significant increase of H2O in thalamus, corpus callosum and temporal WM of obese individuals compared to lean ones. Possible changes of other quantitative MR parameters did not reach significance level. It shall be noted that the results might change as the study continues and the subject number increases. Xu et al. reported lower fractional anisotropy (FA) and axial eigenvalues in the body of corpus callosum in an obese cohort9. These results match our findings as higher H2O results in a decrease of FA. Additionally, thalamus has shown activation in obese individuals when exposed to favorite-food cues during an fMRI study10. Jagust et al. and Gustafson et al. separately have observed an atrophy of temporal lobe in obese subjects based on computer tomography images3-4, while Walther et al. demonstrated greater WM volume of temporal lobe, together with parietal and occipital lobes based on MRI11. These reports suggest that all three ROI are affected by obesity. The increased H2O in the above mentioned structures without significant change of MTR or bound proton concentration suggests a low-grade inflammation in these regions, especially as studies reported obesity as a pro-inflammatory disorder12. The trend of changes appears different in different regions, suggesting that some regions are more vulnerable to the effects of increased BMI.Conclusions
A significant increase of quantitative H2O in obese subjects suggests low-grade inflammation. To investigate the role of obesity in the development of inflammation quantitatively, future work might include a longitudinal study to measure the change of H2O in accordance with the change of BMI.Acknowledgements
This work is funded in part by the Helmholtz Alliance ICEMED-Imaging and Curing Environmental Metabolic Diseases, through the Initiative and Network Fund of the Helmholtz Association.References
1. National Academies of Sciences, Engineering, and Medicine. Obesity in the early childhood years: State of the science and implementation of promising solutions: Workshop summary. Washington, DC: The National Academies Press. 2016.
2. Smith E, Hay P, Campbell L, Trollor JN. A review of the association between obesity and cognitive function across the lifespan: Implications for novel approaches to prevention and treatment. Obesity Reviews, 2011, 12(9), 740–755.
3. Gustafson D, Lissner L, Bengtsson C, Björkelund C. A 24-year follow-up of body mass index and cerebral atrophy. Neurology, 2004, 63(10):1876-81
4. Jagust W, Harvey D, Mungas D, Haan M. Central obesity and the aging brain. Archives of Neurology, 2005, 62(10), 1545–1548.
5. Schall M, Zimmermann M, Iordanishvili E, Gu Y, Shah NJ, Oros-Peusquens A-M, Quantitative In Vivo Imaging Using a 3D Two-Point Method, Magn Reson Mater Phy, 2017, abstract ID 247
6. Yarnykh, V., Actual flip-angle imaging in the pulsed steady state: A method for rapid three-dimensional mapping of the transmitted radiofrequency field, Magnetic Resonance in Medicine, 2007, 57(1):192-200
7. Caspers S, Moebus S, Lux S, et al. Studying variability in human brain aging in a population based German cohort—rationale and design of 1000BRAINS. Frontiers in Aging Neuroscience. 2014; 6:149.
8. Ashburner J, Friston KJ. Unified segmentation. NeuroImage. 2005;26(3):83
9. Xu, J, Li, Y, Lin, H, Sinha, R, Potenza, MN. Body mass index correlates negatively with white matter integrity in the fornix and corpus callosum: A diffusion tensor imaging study. Human Brain Mapping, 2013, 34(5), 1044–1052.
10. Potenza, MN. Obesity, Food, and Addiction: Emerging Neuroscience and Clinical and Public Health Implications. Neuropsychopharmacology, 2014, 39(1), 249–250.
11. Walther K, Birdsill AC, Glisky EL, Ryan L. Structural brain differences and cognitive functioning related to body mass index in older females. Hum Brain Mapp, 2010, 31:1052–1064.
12. Palavra F, Almeida L, Ambrósio AF, Reis, F. Obesity and brain inflammation: A focus on multiple sclerosis. Obesity Reviews, 2016, 17(3), 211–224.
Figures