2082
Daily Pain in Adults with Sickle Cell Disease is Associated with Alterations in Functional Connectivity of the Brain1Medical College of Wisconsin, Milwaukee, WI, United States, 2BloodCenter of Wisconsin, Milwaukee, WI, United States
Synopsis
About half of Sickle Cell Disease (SCD) adults suffer from a chronic pain syndrome. What of the SCD brain contributes to the development and maintenance of the pain syndrome is unknown. We used resting state functional connectivity MRI (rfcMRI) technique, found significant differences between SCD and controls in areas known to contribute to the development and maintenance of a chronic pain syndrome, and the differences have significant associations with the pain phenotype measurements. The findings suggest that rfcMRI could be used as a biomarker to determine the efficacy of interventions targeted to chronic pain in SCD patients.
INTRODUCTION
Pain in sickle cell disease (SCD) patient historically has been attributed to intermittent microvascular obstruction caused by the abnormally shaped (so-called “sickled”) red blood cells. While this episodic pain is consistent with the clinical course of children with SCD, it is not characteristic of the pain experienced by many adults, about half of whom suffer from a chronic pain syndrome. Recent data from patients with chronic pain1,2, but not with SCD, suggest that maladaptive connectivity of the brain may contribute to the development and maintenance of a chronic pain syndrome. In this study, we will use resting state functional connectivity MRI (rfcMRI) technique to test our hypothesis that abnormal reorganization of brain functional network interaction could leads to chronic pain in SCD group and associates with severe pain phenotype.METHODS
Subjects. Twenty-seven adults were examined:13 subjects with SCD (9 with hemoglobin SS and 4 with hemoglobin SC type) and 14 age-matched controls.
Imaging Methods and Analysis. We performed rfcMRI for each subject. PAG functional connectivity (FC): We used a seed-voxel approach, where the seed was the periaqueductal gray (PAG), an area of the brain known to inhibit pain sensation. Resting-state functional networks (RSN): We analyzed a total of seven RSN: motor network (MTN), default mode network (DMN), salience network (SAN), striatum network (STM), temporal network (TEP), hippocampus network (HIP), and dorsal attention network (DAN). Reginal functional connectivity (RFC): Regional functional connectivity strength was calculated by the Pearson correlation coefficient (CC) between the BOLD time series from two brain regions for each subject. Each subject’s time series was obtained for each region by averaging the time series of all voxels within the region. Inter-network functional connectivity strength (FCS): The inter-network FCS between two networks (A and B) was produced from the mean of all possible RFCs between regions Ai and Bi, where Ai and Bi are the brain regions that belong to network A and network B, respectively.
Statistical Analysis for Inter-network FCS. The Wilcoxon signed-rank test was performed to test the group difference of each inter-network FCS. A multiple comparison correction was performed using the Bonferroni method with p<0.05 to avoid false positives. We applied a within-group linear regression model to test the relationship between the inter-network FCS and the clinical phenotype for SCD subjects.
Pain phenotype measurements in SCD subjects included a day-of-study pain score; a 15-day diary to document daily pain and opioid use; McGill pain and Pain DETECT questionnaires; and quantitative sensory testing in response to mechanical, cold, and heat stimuli.
RESULTS
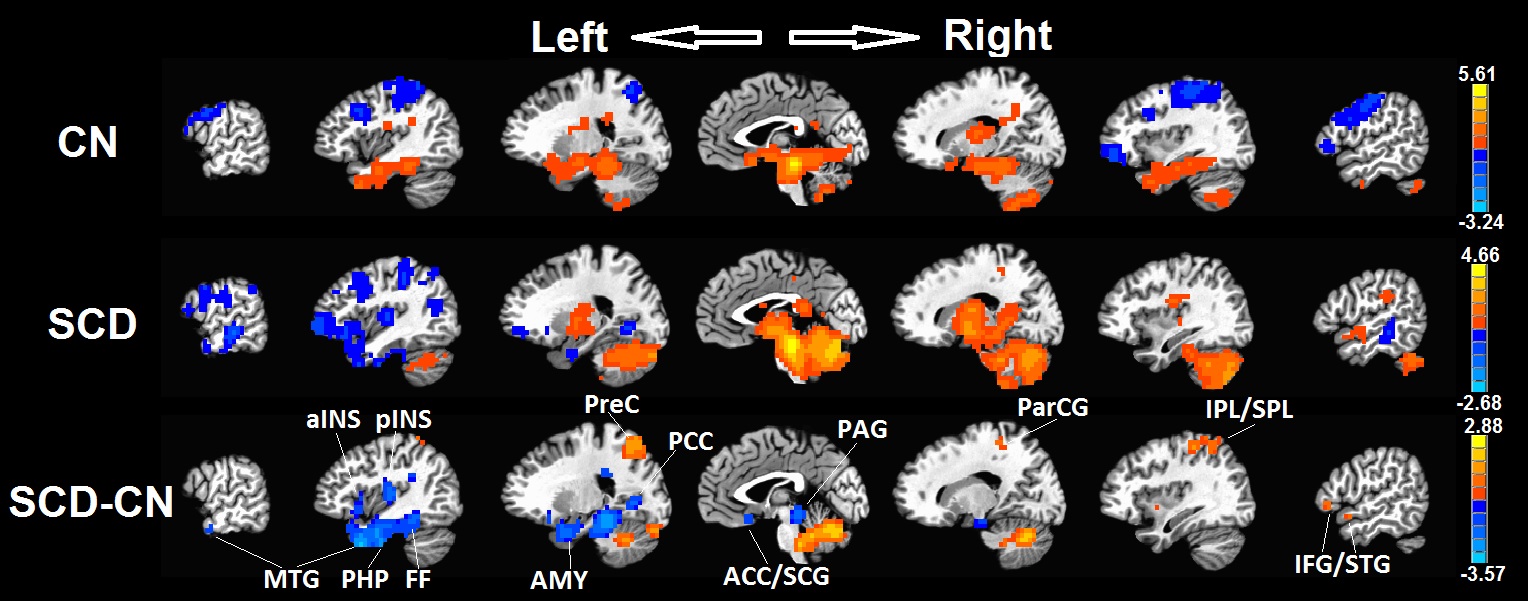
PAG FC. There was significantly decreased connectivity (Figure 1) in SCD subjects as compared with control subjects between the PAG and the regions involved in pain, sensation, salience, emotion, learning, and memory (left middle temporal gyrus [LMTG], left anterior/posterior insula [LaINS/pINS], left parahippocampal gyrus [LPHP], fusiform gyrus [FF], precunes [PreC], posterior cingulate gyrus [PCC], anterior cingulate [ACC], subcallosal gyrus [SCG], paracentral gyrus [ParCG], inferior/superior parietal lobe [IPL/SPL], inferior frontal gyrus [IFG], and superior temporal gyrus [STG]; p<0.001, t-test with AlphaSim correction).
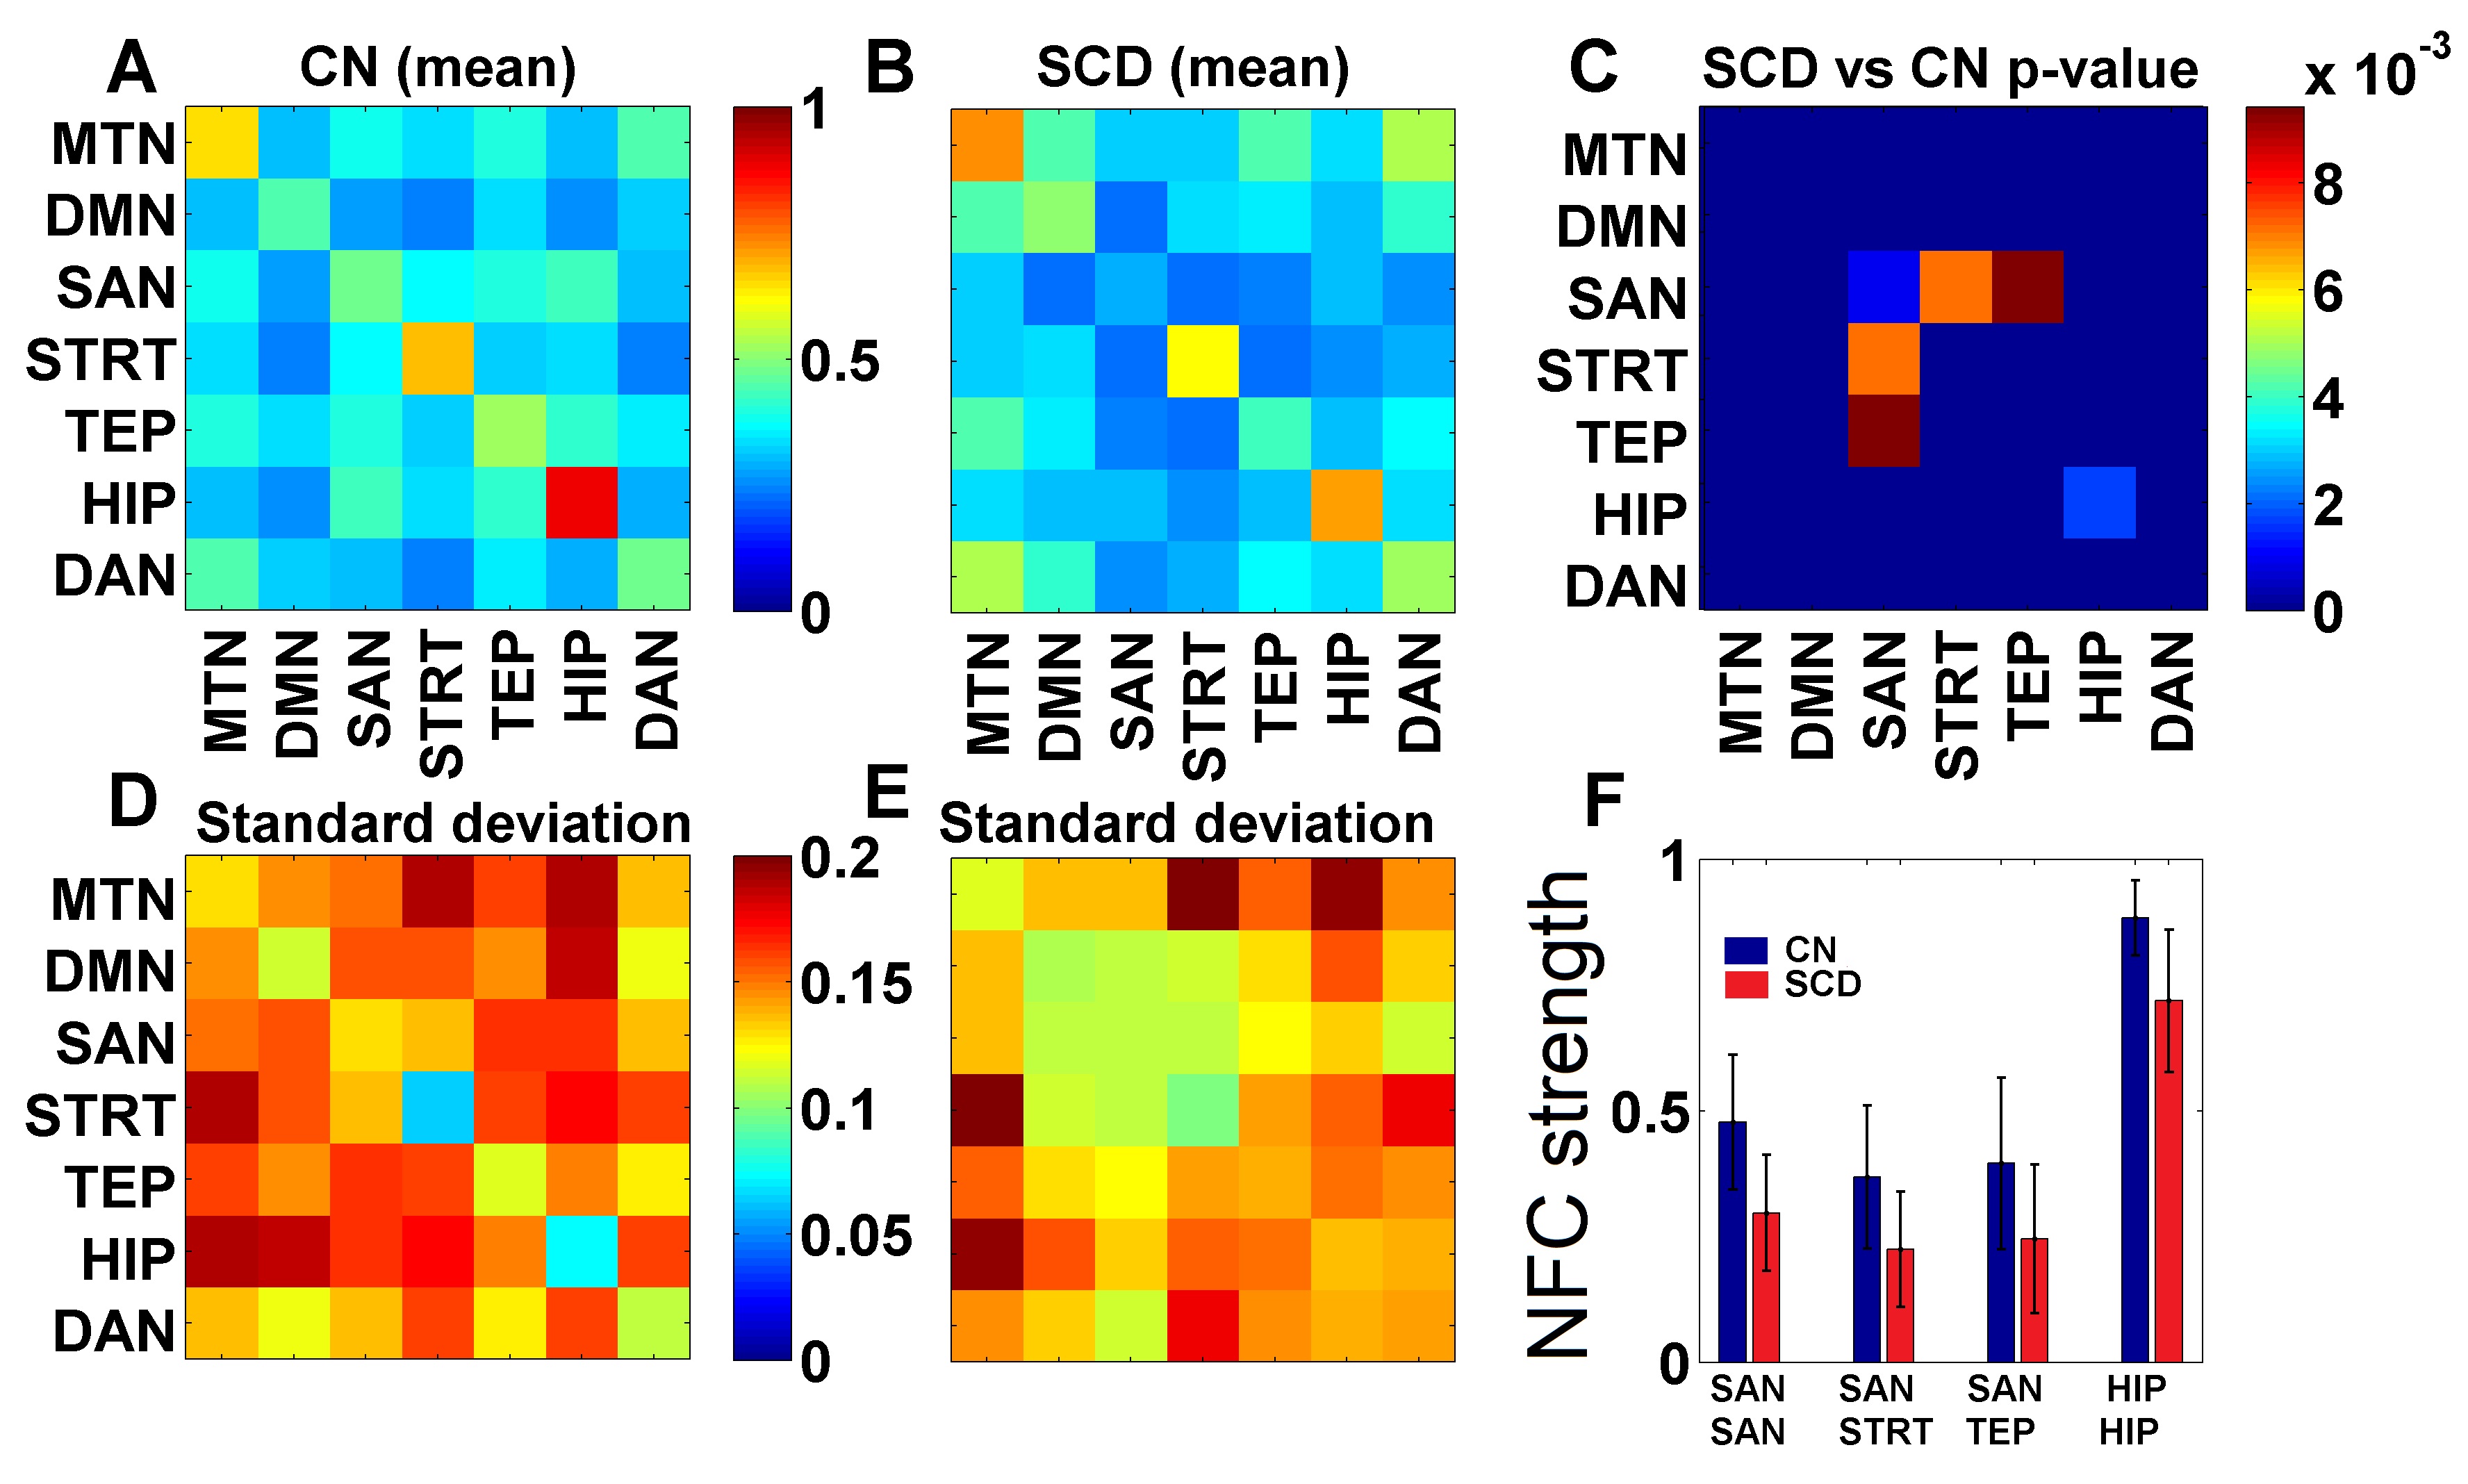
Inter-network FCS. SCD and CN show a different pattern of network functional connectivity (NFC) (Fig. 2A, 2B, 2D, 2E). Specifically, the inter-network connections, SAN-STRT and SAN-TEP, significantly decreased in the SCD group (Fig. 2C, 2F). Besides the inter-network, the functional connectivity strength within the network, SAN–SAN and HIP–HIP also decreased in the SCD group.
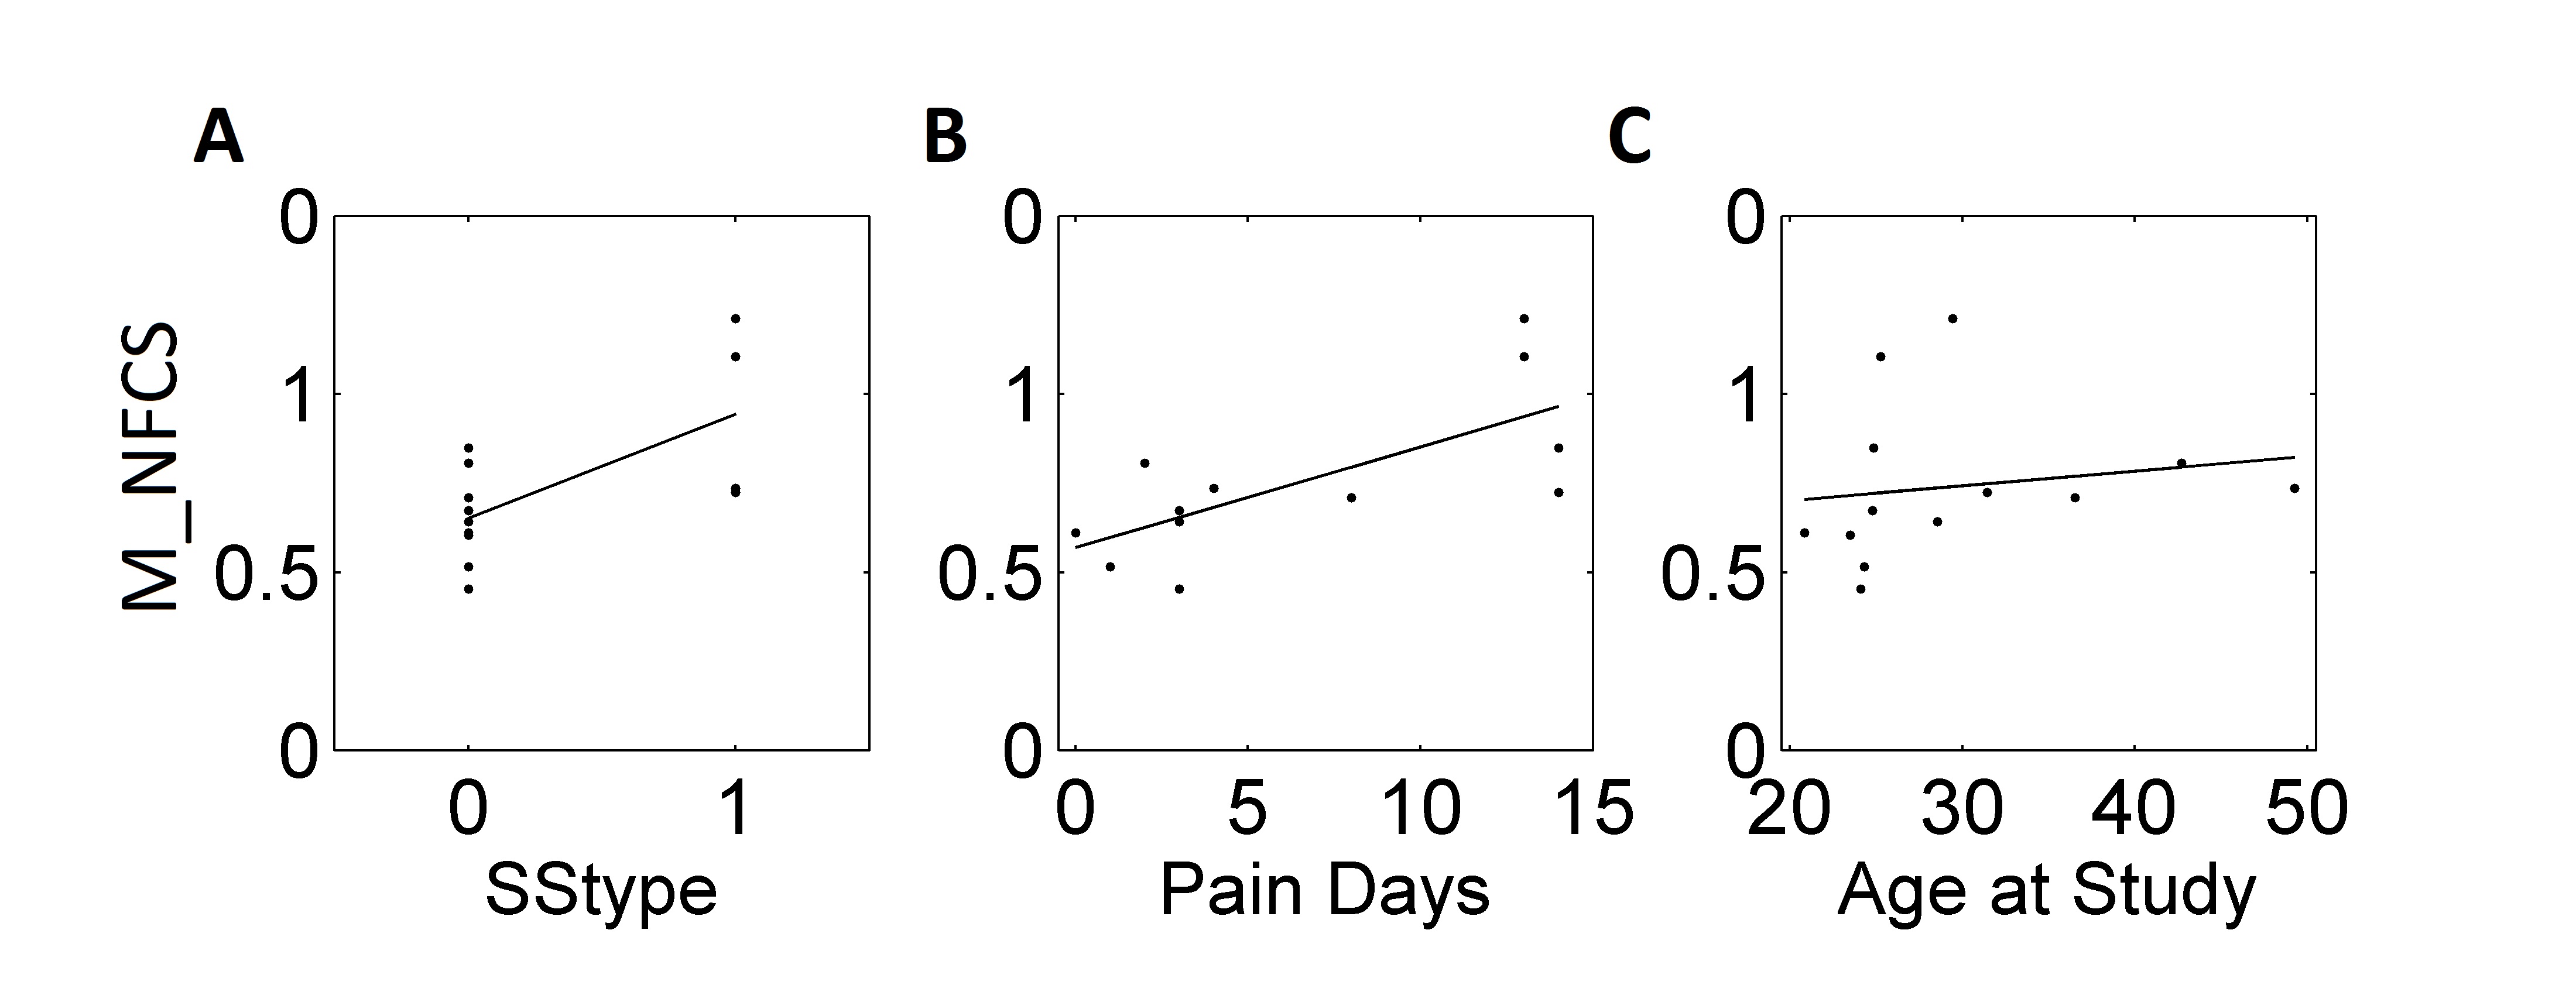
Inter-network FCS and Phenotype. In Figure 3, significant associations are found with SCD genotype (HbSS(0) vs HbSC(1)) (r2=0.43, p<0.016, linear regression analysis), number of diary days with pain score>5 (r2=0.5, p<0.011, linear regression analysis), and age (r2=0.63, p<0.024, Spearman correlation analysis).
DISCUSSION
In seed-based analyses, there were differences between subjects with SCD compared with controls in areas known to contribute to the development and maintenance of a chronic pain syndrome. Previous study showed that, these regions, such as the insula, PCC, IPL, fusiform regions, were found to have a different hemodynamic response function in SCD patients3.
When these differences in inter-network functional connectivity strength were examined in subjects with SCD, significant associations were found with the SCD genotype, number of pain days, and age. This result suggests that altered connectivity in the brains of SCD patients may contribute to the development of a chronic pain syndrome.
CONCLUSION
Taken together, these rfcMRI functional connectivity on data could be used as a biomarker to determine the efficacy of interventions targeted to decrease chronic pain in SCD patients.
Acknowledgements
This work was supported by: American Society of Hematology, Hematology Opportunities for the Next Generation of Research Scientists (HONORS) Award (AS) and Clinical and Translational Sciences Institute of Southeaster Wisconsin Grant (JJF).References
1. Kregel J, Meeus M, Malfliet A, Dolphens M, Danneels L, Nijs J, Cagnie B. Structural and functional brain abnormalities in chronic low back pain: A systematic review. Semin Arthritis Rheum 2015 Oct;45(2):229-37.
2. Hemington KS, Wu Q, Kucyi A, Inman RD, Davis KD. Abnormal cross-network functional connectivity in chronic pain and its association with clinical symptoms. Brain Struct Funct 2015 Dec 15.
3. Case M, Zhang H, Mundahl J, Datta Y, Nelson S, Gupta K, He B. Characterization of functional brain activity and connectivity using EEG and fMRI in patients with sickle cell disease. Neuroimage Clin 2016 Dec; 14:1-17.
Figures