2076
The Aging Brain: Cerebrovascular responses to CO2.1Division of Neuroradiology, Joint Department of Medical Imaging, University Health Network, Toronto, ON, Canada, 2Institute of Medical Science, University of Toronto, Toronto, ON, Canada, 3The Russell H. Morgan Department of Radiology & Radiological Science, The John Hopkins University School of Medicine, Baltimore, MD, United States, 4Department of Anaesthesia and Pain Management, University Health Network, Toronto, ON, Canada, 5Department of Physiology, University of Toronto, Toronto, ON, Canada
Synopsis
Measures of cerebrovascular reactivity (CVR) are used to judge the health of the brain vasculature. We report the use of several different analyses of BOLD responses to CO2 to provide a number of metrics for various aspects of CVR. To assess possible differences in these metrics with age, we compiled atlases reflecting voxel-wise means and standard deviations for different age ranges and compared them.
Purpose:
To compare CVR metrics over four age ranges in healthy subjects using CVR metrics derived from conventional analysis methods and a new method that characterizes the response to CO2 stimuli using a resistance based model that, unlike the conventional analysis methods, is not confounded by network flow interactions that result from use of global CO2 stimuli.Introduction:
There are several ways of analysing BOLD responses to CO2 depending on the pattern of stimulus used (Figure 1A). A CO2 step change provides two response metrics: 1) speed of the exponential rise in the BOLD response, and 2) magnitude of the response. Transfer function analysis (TFA) provides: 1) gain, 2) phase, and 3) coherence responses. By contrast, a new method of analysis that requires a ramp change in the CO2 stimulus (Figure 1) was also applied. We use a hypothetical model of interactions between two parallel vascular beds whose flow resistances change with CO2 (Figure 1B). One branch is assigned to a fixed reference sigmoidal resistance response characteristic of a healthy region, and the other to any voxel under examination. The model is used to calculate the sigmoidal resistance responses to CO2 for each voxel from its BOLD response to CO2. The metrics derived from the resistance sigmoidal responses to CO2 (Figure 1C) may better describe the innate regulatory abilities of a region, un-confounded by interconnected network flow responses from use of global CO2 stimuli. Voxel-wise anatomical maps of ramp CVR, TFA gain, phase and coherence, as well as the resistance sigmoid parameters assessed from ramp responses from hypocapnia to hypercapnia and associated metrics extend insight into cerebrovascular regulation further than that provided by CVR alone. However, it remains unknown how cerebrovascular regulation is affected in the aging brain as assessed by these metrics.Methods:
51 healthy control volunteers between the ages of 18-85 (26 males) were recruited, and 38 provided useable data. All participants were scanned on a 3-Tesla GE system MRI scanner using an eight-channel phased array head coil at Toronto Western Hospital. The CO2 stimulus sequence was programmed into the RespirActTM that ran a prospective gas-targeting algorithm 1, controlling the CO2 stimulus such that PETCO2 was equivalent to PaCO2.2-3 Atlas maps for the various metrics were compared between each age cohort 4. Threshold-Free Cluster Enhancement, with permutation testing applied to the height of the maxima of the resulting statistic image using the ‘randomise’ permutation-based inference tool 5 in FSL v.5.0.9. was used to allow for the maintenance of strong control over family-wise error. A one-way ANOVA was used to test the four different age ranges as well as younger (18-54) with older (55-76) age ranges for multiple comparisons, and any significant regions at p < 0.05 were reported.
Results:
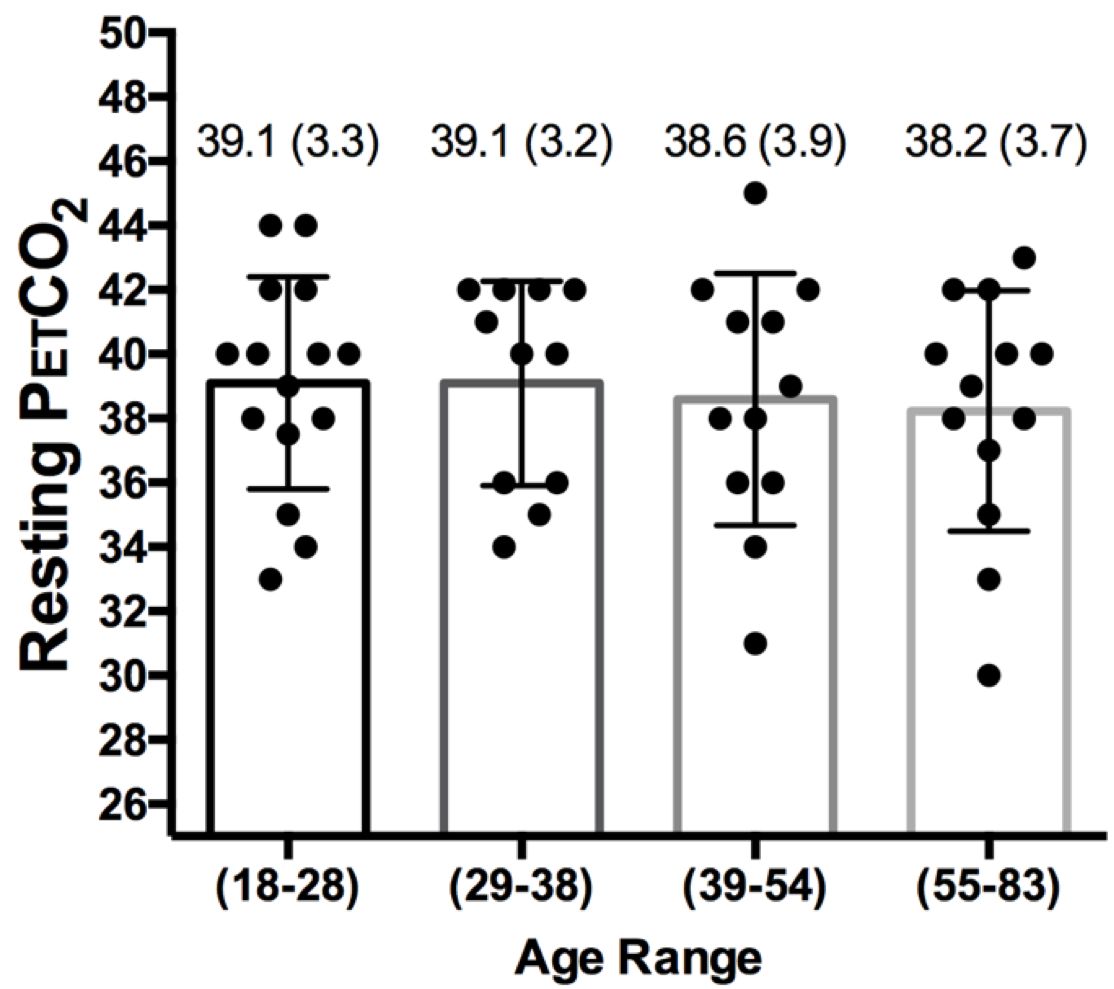
Resting PETCO2 values for all subjects (Ntotal = 51, mean (SD) 38.8 (3.4). are shown (Figure 2). A one-way ANOVA revealed no significant differences between resting PETCO2 values between age cohorts F(3,47) = 0.18, p = 0.91. Figure 3 shows atlas maps based on the ramp portion of the stimulus including the resistance metrics, and ramp CVR. A significant difference was found using one-way ANOVA comparing the ramp CVR atlas maps (18-28) > (55-76); (39-54) > (55-76); and combined (18-54) > (55-76) age ranges in white matter frontal regions after multiple comparison correction p < 0.05 (Figure 4). There was a significant difference in midpoint maps in a 232 mm3 cluster in the right cerebral white matter middle frontal gyrus between the (18-28) > (55-76) age groups (Figure 4). There was a significant difference between TFA coherence atlas maps within the 3rd age cohort (39-54) compared to each other cohort (Figure 5).
Discussion and Conclusion: Discussion and Conclusion:
This study is the first to assess cerebrovascular regulation based on a physiological explanation of the patterns of the BOLD response to a ramp PETCO2 stimulus in terms of the underlying changes in vascular resistance. In addition, this study provided the first assessment of resting PETCO2 values in controls compared between different age cohorts. There was a significant difference between age cohorts for the resistance sigmoid midpoint and for the ramp CVR, which were both decreased with age in white matter frontal regions comprising the (ACA-MCA) watershed area. Age-related reductions in CBF resulting in chronic ischemic damage to this region may account for this finding. Support for this explanation stems from previous work using near-infrared spectroscopy, where healthy elderly adults were shown to frequently develop reduced cortical oxygenation levels in the frontal lobes when upright in posture, even in the absence of clinical symptoms of orthostasis.6-7 However, our general conclusion is that, overall, vascular regulation of CBF responses to CO2 are not significantly affected by age.Acknowledgements
We thank Eugen Hlasny with the help in MRI scanning and Abby Skanda for her assistance in subject recruitment.References
1. Slessarev M, Han J, Mardimae A, et al. Prospective targeting and control of end-tidal CO2 and O2 concentrations. J Physiol. 2007; 58(Pt 3):1207–1219.
2. Ito S, Mardimae A, Han J, Duffin J, Wells G, Fedorko L et al. Non-invasive prospective targeting of arterial P CO 2 in subjects at rest. J Physiol. 2008;586(15):3675–3682.
3. Willie CK, Macleod DB, Shaw AD, et al. Regional brain blood flow in man during acute changes in arterial blood gases. J Physiol. 2012;590(14):3261–3275.
4. Sobczyk O, Battisti-Charbonney A, Poublanc J, et al. Assessing Cerebrovascular Reactivity Abnormality by Comparison to a Reference Atlas. J Cereb Blood Flow Metab. 2015;35(2):213–220.
5. Winkler AM, Ridgway GR, Webster MA, et al. Permutation inference for the general linear model. Neuroimage. 2014;92:381–397.
6. Mehagnoul-Schipper DJ, Vloet LC, Colier WN, et al. Cerebral oxygenation declines in healthy elderly subjects in response to assuming the upright position. Stroke. 2000;31(7):1615–1620.
7. Mehagnoul-Schipper DJ, Colier WN, Jansen RW. Reproducibility of orthostatic changes in cerebral oxygenation in healthy subjects aged 70 years or older. Clin Physiol. 2001;21(1):77–84.
Figures