2075
Differentiation of white matter hyperintensity severity using T2- and T1-weighted brain MRI.Nina Linde Højland Reislev1,2, Henrik Lundell1, Hartwig Roman Siebner1,3, Christian Eriksen2,4, Michael Kjær2,4, and Ellen Garde2,5
1Danish Research Centre for Magnetic Resonance, Centre for Functional and Diagnostic Imaging and Research, Copenhagen University Hospital Hvidovre, Hvidovre, Denmark, 2Center for Healthy Aging, Faculty of Health and Medical Sciences, University of Copenhagen, Copenhagen, Denmark, 3Department of Neurology, Copenhagen University Hospital Bispebjerg, Copenhagen, Denmark, 4Institute for Sports Medicine, Copenhagen University Hospital Bispebjerg, Copenhagen, Denmark, 5Department of Public Health, University of Copenhagen, Copenhagen, Denmark
Synopsis
This study presents a new method to differentiate brain white matter hyperintensity (WMH) severity using conventional T1-weighted and T2-weighted MRI. By combining normalized image intensity, heterogeneous tissue properties within lesions are revealed. Lesion severity is quantified through two distance measures of parallel and perpendicular deviation from normal appearing white matter. Correlations with diffusion imaging based measures suggest that multi-modal voxel-based lesion analysis provide comparable but high-resolution tissue information. Based on conventional MRI scans this method adds valuable insight into the differentiated impact of WMH lesions on brain structure and function.
Introduction
As an important MRI marker of brain small vessel disease white matter hyperintensities (WMH) have been associated with vascular risk factors and cognitive decline (1, 2). WMH have traditionally been assessed with visual rating scales (3,4) or volumetrically quantified with a variety of automatic segmentation methods (for review see 5). A multimodal approach based on combined intensity information from FLAIR, T2w, and T1w may provide a better marker of tissue degeneration and a quantitative measure of WMH severity leading to a greater understanding of the neurobiological impact of WMH on brain function and cognition.Methods
Subjects: 257 subjects were included in the study, as a subset randomly selected from a larger community-based cohort (age 62-70 years) of the LISA study (6). Data: Conventional structural 3D T1w (MPRAGE), T2w, and FLAIR whole-brain images were acquired on a Philips 3T MRI scanner. Whole-brain diffusion-weighted images (DWI) were additionally acquired. Analyses: WMH were delineated by simultaneous visual assessment of FLAIR and T2w images using JIM 6.0 (Xinapse Systems) resulting in a total of 8845 lesions. Grey and white matter were segmented on lesion-filled T1w images (7), to identify normal appearing white matter (NAWM). For each modality (T1w, T2w, and FLAIR), mean intensity within lesions was normalized to mean NAWM intensity within each subject. On a voxel-wise basis, a singular value decomposition was used to project all voxels within all lesions across all subjects into the 3D parameter space of normalized T1w, T2w, and FLAIR intensities. To describe how each voxel intensity within lesions deviated from NAWM, two distance measures were defined: 1) Parallel distance along the primary eigenvector, and 2) Perpendicular distance from the primary eigenvector. The DWIs were processed within each subject using FSL tools (8), and the diffusion tensor model was fitted to create fractional anisotropy (FA) and mean diffusivity (MD) maps, which were used to validate the distance measures, assuming a more severe lesion is roughly characterized by increased MD and decreased FA (9). On subject level, all lesion maps for all subjects were normalized through the T1w images with SPM DARTEL tool (10) into 1 mm MNI space, and a lesion frequency map was created.Results
The lesion frequency map of all lesions across all subjects shows a typical spatial distribution of WMH as can be expected in an elderly subject group (Fig. 1). Zooming in on a particular lesion of one subject on the T1w, T2w, and FLAIR images visualize the heterogeneous intensities within a WMH (Fig 2B). This intensity heterogeneity is further stated in the 3D visualization of NAWM-normalized T1w, T2w, and FLAIR lesion values. This suggests a nonlinear trajectory through this parameter space reflecting the diverse neuropathology from NAWM to the state of a particular lesion (Fig. 2C). By combining the two distance measures and examining the points with a high distance value of all lesions, deviation from a linear evolution within lesions can be quantified (Fig. 3), hence the outermost points of the parallel and perpendicular distance measures are capturing the more damaged tissue part within a lesion. A scatterplot further confirms a positive correlation between MD and the two distance measures and a negative correlation between FA and the distance measures (Fig. 4), confirming agreement between lesion severity based on the T1w, T2w, and FLAIR intensities and microstructural properties of the tissue.Discussion
The appearance of a WMH is known to first be visible on T2w contrasts and subsequently evolve as “black holes” in T1w images reflecting a chronic tissue loss. We here present a new method to characterize and quantify lesion severity based on simple measures of combined conventional T1w and T2w MRI to supplement the traditional measure of WMH volume and number. Quantification of lesion severity may increase our understanding of the impact of WMH on brain structure as well as its functional consequences in e.g. ageing and multiple sclerosis. The prospect of achieving microstructural information from conventional structural images has a great advantage over quantitative maps of e.g. diffusivity or relaxation in terms of higher image resolution, higher SNR, and shorter acquisition times.Acknowledgements
This work was supported by Nordea Fonden, through the Center for Healthy Aging, University of Copenhagen.References
1) Garde E, et al Lancet (2000). 2) Salat DH, et al., Neuroscience (2014). 3) Fazekas F, et al., Neurology (1993). 4) Schelten P, et al., Journal of the Neurological Sciences 114, 7–12 (1993). 5) Eugenia M, et al., Neuroinform (2015). 6) Eriksen CS, Garde E, Reislev NL, et al. BMJ Open 2016. 7) Battaglini M, et al Hum Brain Mapp (2012). 8) Andersson JLR et al., NI 125, (2016). 9) Maniega S, et al., Neruobiol. aging (2015). 10) Ashburner J et al., NI 38(1) (2007).Figures
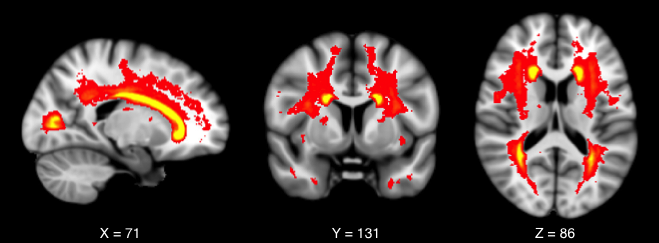
Lesion Frequency map of all lesions across all
subjects, showing a high frequency of lesions within the white matter adjacent
to the posterior and anterior horn of the lateral ventricles. Lesions are shown
overlaid on a standard T1-weighted template in MNI space. The red-yellow colour
scale represents lesion frequency.

A) Axial slice of FLAIR image showing lesions.
B1-3) Zoomed versions of T1w, T2w, and FLAIR images showing different
properties within lesions contained within the area of the red square on A. The
lesions appear heterogeneous (red arrows), giving rise to lesion
differentiation. C) 3D scatter plot of T1w, T2w, FLAIR for all voxels across
all lesions and all subjects. Red cross shows the value of NAWM. Nonlinear
behaviour of values within lesions is illustrated by the red line trajectory.
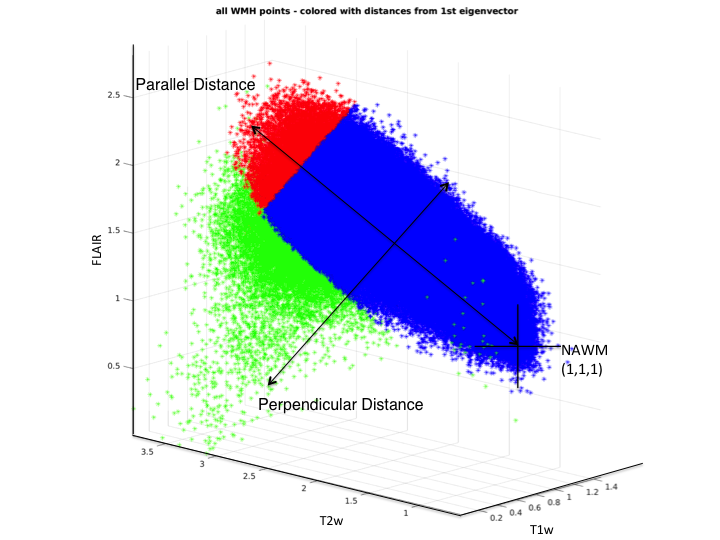
Illustration of the two distance measures
(parallel and perpendicular) within the 3D space of T1w, T2w, and FLAIR. For
visualisation purposes, a cut-off of the 99th-percentile has been
applied to all the voxels within lesions, representing the highest severity of
tissue degeneration within lesions. The red points represent the parallel
distance measure, whereas the green points represent the perpendicular distance
measure.
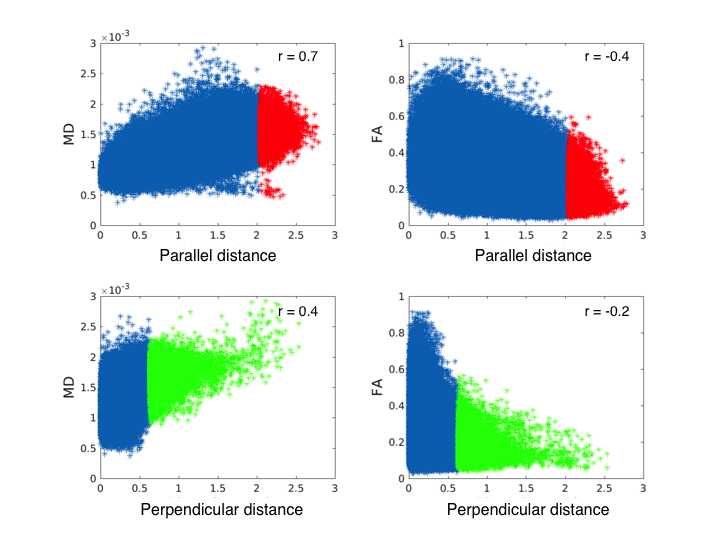
Scatterplots of voxel-wise parallel and
perpendicular distance measures against MD and FA within all lesions. Colouring
of the 99th-percentile of the distance measures have been applied as
in Fig. 3. Linear correlation values are given by Pearson correlation
coefficient (r-value) for each scatterplot, even though a linear fit does not
fully describe the data.