2073
Improving MRI assessment of whole-brain structural health in aging: an approach involving multiple sequences1Medical imaging department, Tianjin medical university general hospital, Tianjin, China, 2Health Sciences and Innovation, Fraser Health Authority & SFU ImageTech Laboratory, Surrey Memorial Hospital, Surrey, BC, Canada, 3Schools of Engineering and Computing Sciences, Simon Fraser University, Burnaby, BC, Canada
Synopsis
The process of brain aging is characterized by the accumulation of multiple structural changes, several of which can be visualized using clinical MRI. Brain Atrophy and Lesion Index (BALI) has been validated to collectively assess MRI-based whole-brain structural changes. This study aims to improve the BALI assessment of whole-brain structural changes in aging using multiple routine clinical MRI sequences (T1WI, T2WI, T2-FLAIR and T2*GRE).
Introduction
The Brain Atrophy and Lesion Index (BALI) is a MRI-based semi-quantitative rating scale to collectively evaluate structural changes commonly present in the aging brain. 1-5 The method has been developed using 3D T1- or T2- weighted imaging, for which changes of the BALI categories are assessed and a total score is yielded by summarizing the categorical subscores, and can be used to inform the status of structural brain health. Given that different MRI sequences have various sensitivities in detecting different types of changes, in this study we investigated how several common clinical sequences could be applied to improve the BALI evaluation of the whole-brain changes.Methods
Subjects: Data were retrieved from the database of MRI research protocols conducted at Tianjin Medical University General Hospital Diagnostic Imaging Department between December 2015 and June 2017. Each subject signed the informed consent. MRI images of participants who were aged between 40 and 90 years with no cognitive disorder were included in the study (n=169; women=56.5%; age=62.7±13.3 years).
MRI sequences: Imaging data of four sequences were acquired using a 3.0T GE SignaHDx system. T1WI used MPRAGE, TR/TE = 2300/3ms, TI=1100ms, flip angle (FA)= 7◦, slice thickness = 1.0mm, FOV=27cm, matrix=256×256, NEX=1. T2WI used TR/TE = 5500/90ms, FA = 150◦, slice thickness = 3 mm, FOV=26cm, matrix=256×256, NEX=3. T2-FLAIR used TR/TE = 11000/90ms, TI = 2500ms, FA =150◦, slice thickness = 3.0mm, FOV=26cm, matrix 256×256, NEX=2. T2*GRE used TR/TE =650/20ms, FA=20◦, slice thickness = 3.0mm, FOV=26cm, matrix = 256×192, NEX=2.
BALI evaluation: The BALI rating schema assess age related brain changes by evaluating eight categories, and total score was calculated as the sum of the subscores of all categories, with a possible maximum total score of 28 (Table 1, Figure 1). 1, 2 A higher score means greater severity. Two experienced neuroradiologists performed BALI evaluation independently, blinded to the subjects’ age and other demographical information. One assessed all the images, and the other assessed randomly selected 20% images for interrater agreement tests. To minimize possible recall bias, different MRI sequences were assessed on separate days and in a random order.
Data analysis: Interrater agreement was assessed using the intraclass correlation coefficient (ICC) for the reliability of BALI total scores. Comparisons of the mean BALI total scores and the subscores between different groups were conducted by use of ANOVA and the Kruskal-Wallis nonparametric tests. Relationship between BALI total score and age was examined by use of regression analyses. All analyses were performed with the use of IBM Statistics SPSS version 23. The level of significance was set at P<0.05.
Results
Reliability: The BALI showed a strong-excellent interrater reliability. The ICC was 0.90 (95% CI = 0.79-0.96) for T1WI, 0.86 (95% CI = 0.70–0.94) for T2WI, 0.86 (95% CI = 0.70– 0.94) for T2-FLAIR, and 0.83 (95% CI = 0.64– 0.92) for T2*GRE. Validity: The BALI total scores based on all four sequences increased with age (r >0.71, p<0.001; Figure 2) and varied significantly among different age groups for different sequences (F >36.60, p<0.001; Table 2).
T2*GRE showed microhemorrhages in 17.0% of the sample, which were not seen in any other sequences (Figure 3). T2-FLAIR showed more lesions in the periventricular (χ2=26.81, p<0.001) and deep white matter (χ2=43.80, p<0.001; Figure 3).
Discussion
Aging involves multiple structural changes including global atrophy, white matter injury, small vessel ischemia and microhemorrhages.6-10 These changes may not always considered clinically significant when individually presented, but their co-existence can interact and produce accumulative and additive impacts on brain health. 6, 7, 10, 11
The BALI provided a useful tool for simultaneously assess whole-brain changes including global atrophy and common lesions in both supratentorial and infratentorial compartments.1, 2 It was created to address the challenge in understanding brain aging, by treating the brain that works as a system, rather than multiple individual components.
Consistent with previous reports, data of this study showed that the BALI is robust in allowing structural brain health assessment. The study further confirmed that T1WI and T2WI based BALI evaluations consistently captured deficits in each category, reflecting the burden of age related whole-brain structural changes in older adults. In addition, the study demonstrated in a new dataset that T2-FLAIR and T2*GRE improved the detection of white matter and microhemorrhage changes, enhancing the assessment.
Conclusion
Evaluation of whole-brain structural health based on multiple MRI sequences can allow optimized detection of various types of changes in the aging brain, improving the potential of BALI in large-scale clinical trials and routine practice.Acknowledgements
This research was supported by grants from the National Science Foundation of China (81010072 and 81401379). Further support for study design, data analysis and result interpretation was from Canadian Institutes of Health Research (CSE125739) and the Fraser Health Research Foundation (FHSPG2015-030). The authors acknowledge Drs. Y. Shi, H. Yin, and B. Miao for help with data acquisition and clinical assessments.References
- Guo H, Sui W, D’Arcy R, et al. MRI assessment of whole-brain structural changes in aging. Clin Interv Aging. 2017; 12: 1251–1270.
- Guo H, Song X, Schmidt MH, et al. Evaluation of whole brain health in aging and Alzheimer's disease: a standard procedure for scoring an MRI-based brain atrophy and lesion index. Alzheimers Dis 2014;42(2):691-703.
- Guo H, Song X, Vandorpe R, et al. Evaluation of common structural brain changes in aging and Alzheimer disease with the use of an MRI-based brain atrophy and lesion index: a comparison between T1WI and T2WI at 1.5T and 3T. American journal of neuroradiology 2014;35(3):504-512.
- Chen W, Song X, Zhang Y, et al. An MRI-based semiquantitative index for the evaluation of brain atrophy and lesions in Alzheimer's disease, mild cognitive impairment and normal aging. Dement Geriatr Cogn Disord 2010;30(2):121-130.
- Zhang N, Song X, Zhang Y, et al. An MRI brain atrophy and lesion index to assess the progression of structural changes in Alzheimer's disease, mild cognitive impairment, and normal aging: a follow-up study. Alzheimers Dis 2011;26 Suppl 3:359-367.
- Park JH, Seo SW, Kim C, et al. Pathogenesis of cerebral microbleeds: In vivo imaging of amyloid and subcortical ischemic small vessel disease in 226 individuals with cognitive impairment. Ann Neurol. 2013;73(5):584-593.
- Prins ND, Scheltens P. White matter hyperintensities, cognitive impairment and dementia: an update. Nat Rev Neurol. 2015;11(3):157-165.
- Shim YS, Yang DW, Roe CM, et al. Pathological correlates of white matter hyperintensities on magnetic resonance imaging. Dement Geriatr Cogn Disord. 2015;39(1-2):92-104.
- De Reuck J, Auger F, Durieux N, et al. Topography of Cortical Microbleeds in Alzheimer's Disease with and without Cerebral Amyloid Angiopathy: A Post-Mortem 7.0-Tesla MRI Study. Aging Dis. 2015;6(6):437-443.
- Pacheco J, Goh JO, Kraut MA, Ferrucci L, Resnick SM. Greater cortical thinning in normal older adults predicts later cognitive impairment. Neurobiol Aging. 2015;36(2):903-908.
- Dallaire-Théroux C, Callahan BL, Potvin O, et al. Radiological-Pathological Correlation in Alzheimer's Disease: Systematic Review of Antemortem Magnetic Resonance Imaging Findings. J Alzheimers Dis. 2017;57(2):575-601.
Figures
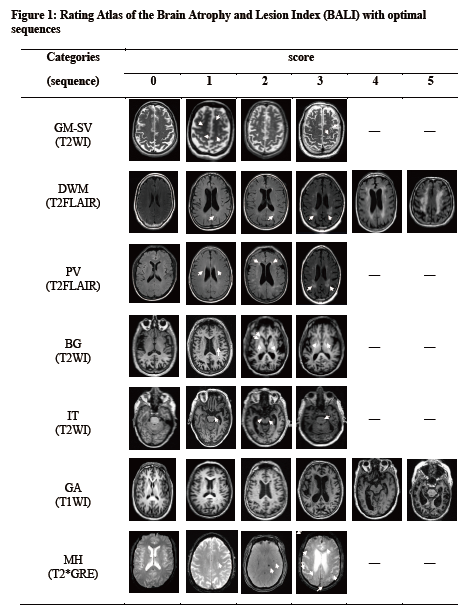
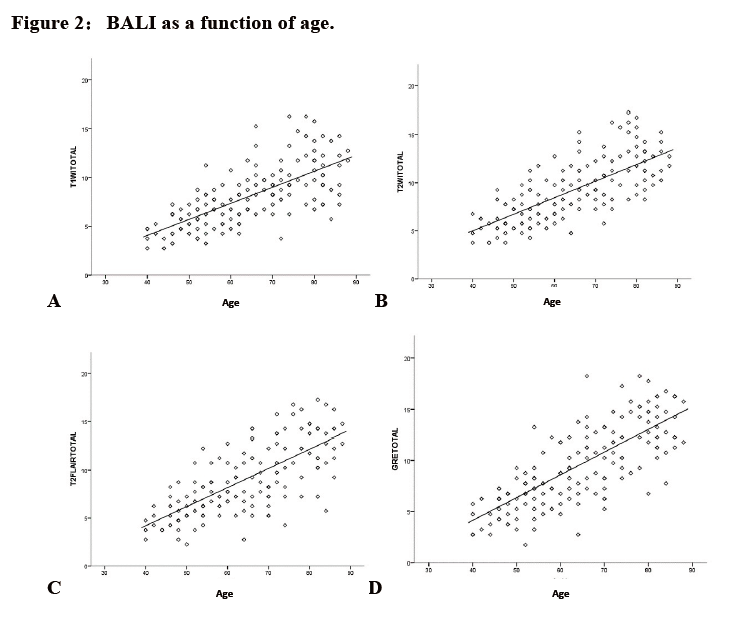
Figure 2:BALI as a function of age.
Solid line: linear fit (y = a + bx) for all subjects (n = 169),A: T1WI, a = -2.494, b = 0.164, r = 0.707, p<.001; B: T2WI, a = -1.912, b = 0.173, r = 0.733, p <.001; C: T2FLAIR, a = -3.767, b = 0.199, r = 0.730, p<.001; D: T2*GRE, a = -4.749, b=0.222, r=0.765, p<.001.
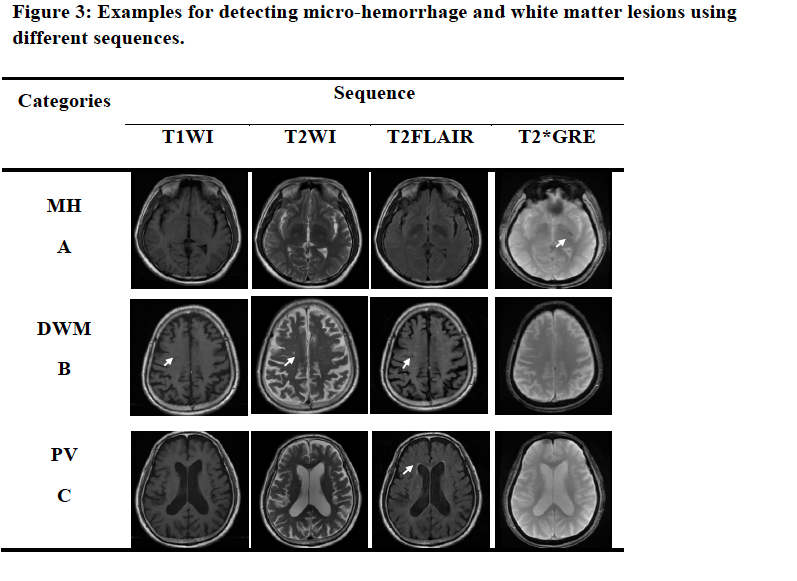
Figure 3: Examples for detecting micro-hemorrhage and white matter lesions using different sequences.
A: micro-hemorrhage is more sensitively revealed on T2*GRE, B and C: deep white matter and periventricular white matter lesions are more sensitively revealed on T2FLAIR.
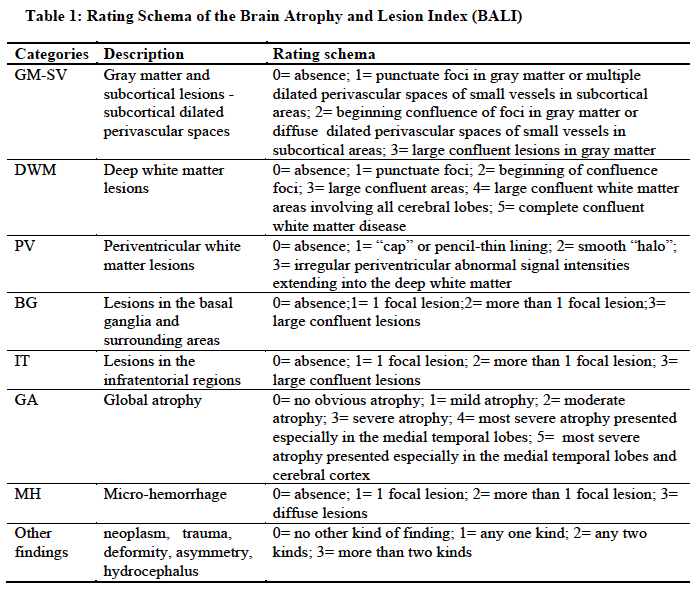
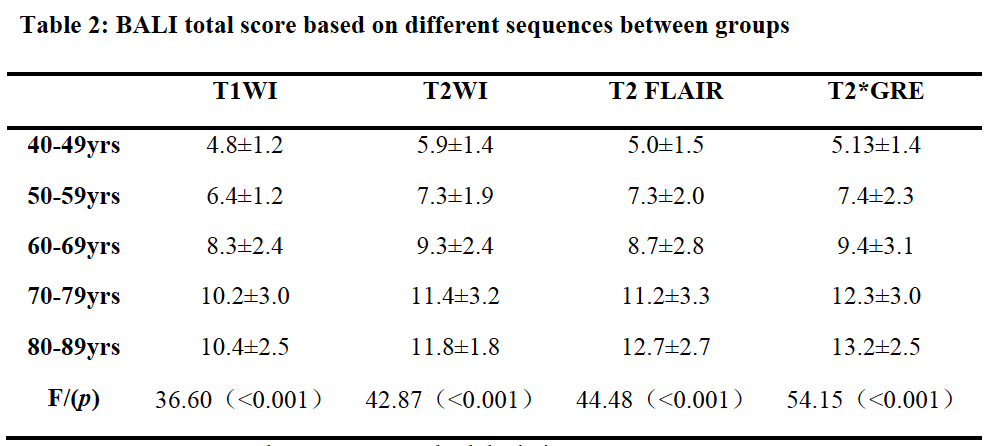
Table 2: BALI total score based on different sequences between groups
Note: Data are presented as mean ± standard deviation