2069
MR Spectroscopy Study: Neural Effects of Induced Hypothermia Treatment after Myocardial Infarction & Anoxia1Center for Clinical Spectroscopy, Department of Radiology, Brigham and Women's Hospital, Boston, MA, United States, 2Yale University, New Haven, CT, United States, 3Neurology, Brigham and Women's Hospital, Boston, MA, United States, 4Cardiff University Brain Imaging Centre, Cardiff University, Cardiff, United Kingdom
Synopsis
Coma after cardiac arrest is a common and debilitating incidence. This study aims to determine the neurochemical changes that occur in comatose cardiac arrest patients who underwent targeted temperature management. Single Voxel MRS was acquired in the posterior cingulate gyrus (PCG) and parietal white matter (PWM) of patients and age-matched controls with no history of neurological disease. Patients showed decreases in NAA, as well as increases in total Choline and Lactate in both PCG and PWM. Patients also showed decreases in glutamate in the PCG. These neurometabolic changes reflect neuronal, axonal and glial loss that would result in reduced neurotransmission.
Introduction
Coma after cardiac arrest is common, occurring in ~55 per 100,000 people annually and leading to a cost of $33 billion/year. Up to 80% of the approximately 40,000 patients presenting with cardiac arrest in hospital are comatose after return of spontaneous circulation1. These patients subsequently undergo targeted temperature management (TTM). Although TTM improves outcome, 50% still have poor results2.
The mechanism of neuronal injury in patients undergoing TMM is not well understood. EEG is currently the only method to continuously monitor patients neurologically. It is confounded by sedative medications and often inconclusive due to poor spatial resolution3. Magnetic Resonance Spectroscopy (MRS) is a non-invasive imaging technique permitting quantification of metabolite concentrations in tissue. Previous studies show that these metabolites are excellent markers for neuronal injury after hypoxic injury4. This MRS study aims to determine the neurochemical changes that occur after cardiac arrest patients undergo TTM. To our knowledge, this is the first MRS study of its nature.
Methods
Subjects: Patients who suffered myocardial infarction that underwent TTM were recruited and consented via family under local IRB approval due to their comatic state (n=13, age 58±8.467, 9 males and 5 females). Healthy controls with no history of neurological disease, including head trauma, were age-matched (n=13, age 58.187±8.204, all males). Controls had a history of participation in non-contact sports (mostly swimming and baseball). Exclusion criteria for controls included having MR contraindications, a history of contact sports, or head trauma.
TMM: Patients were cooled to 33 degrees C, kept in mild resuscitative hypothermic state for 24 hours, and then rewarmed by 0.5 degrees C per hour until normothermia was achieved2,5. MRS scans were held, on average, 4.341±2.849 days after reaching normothermia.
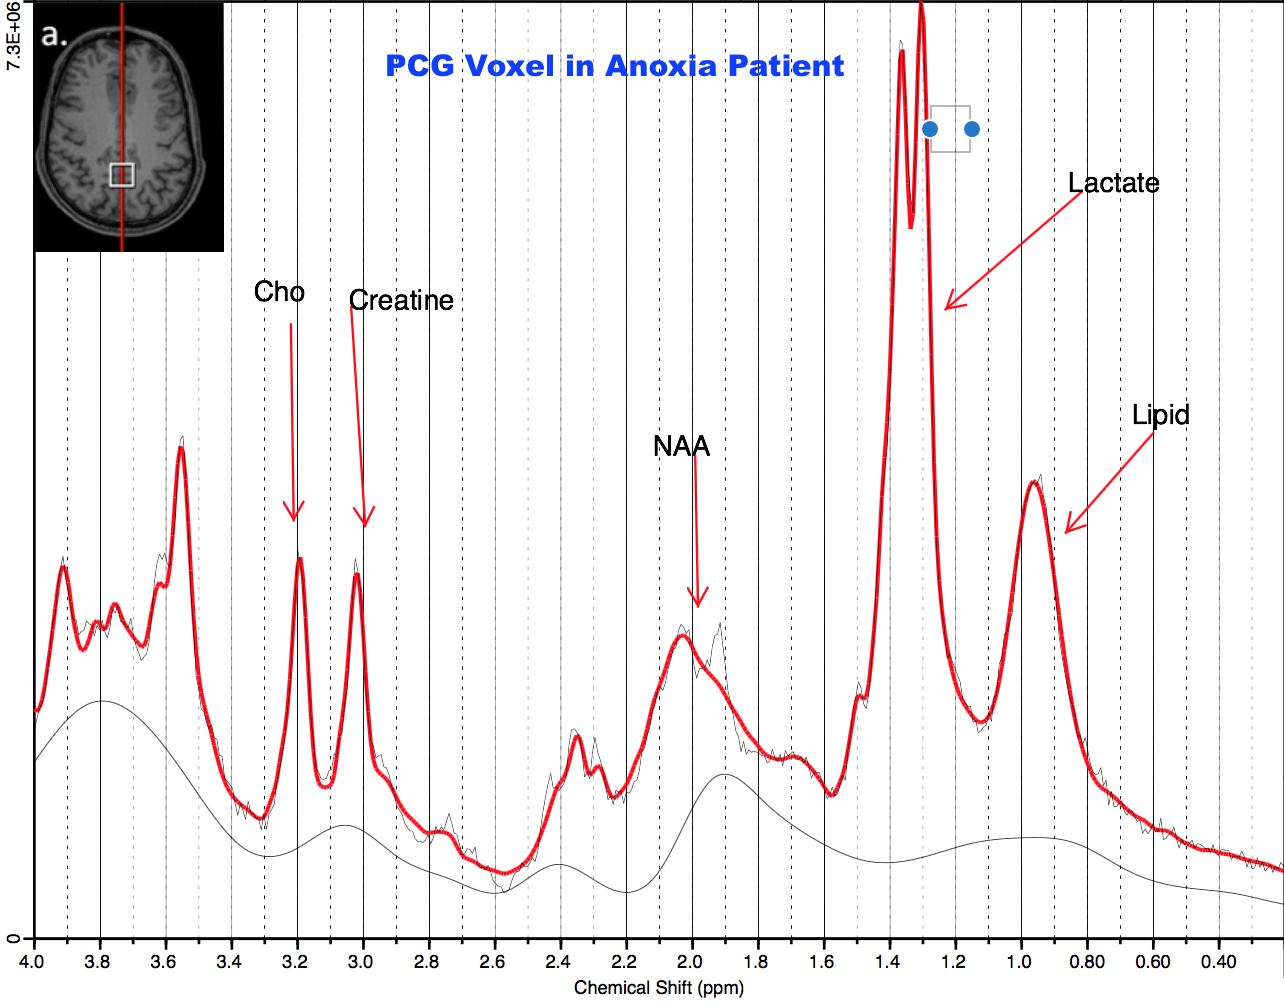
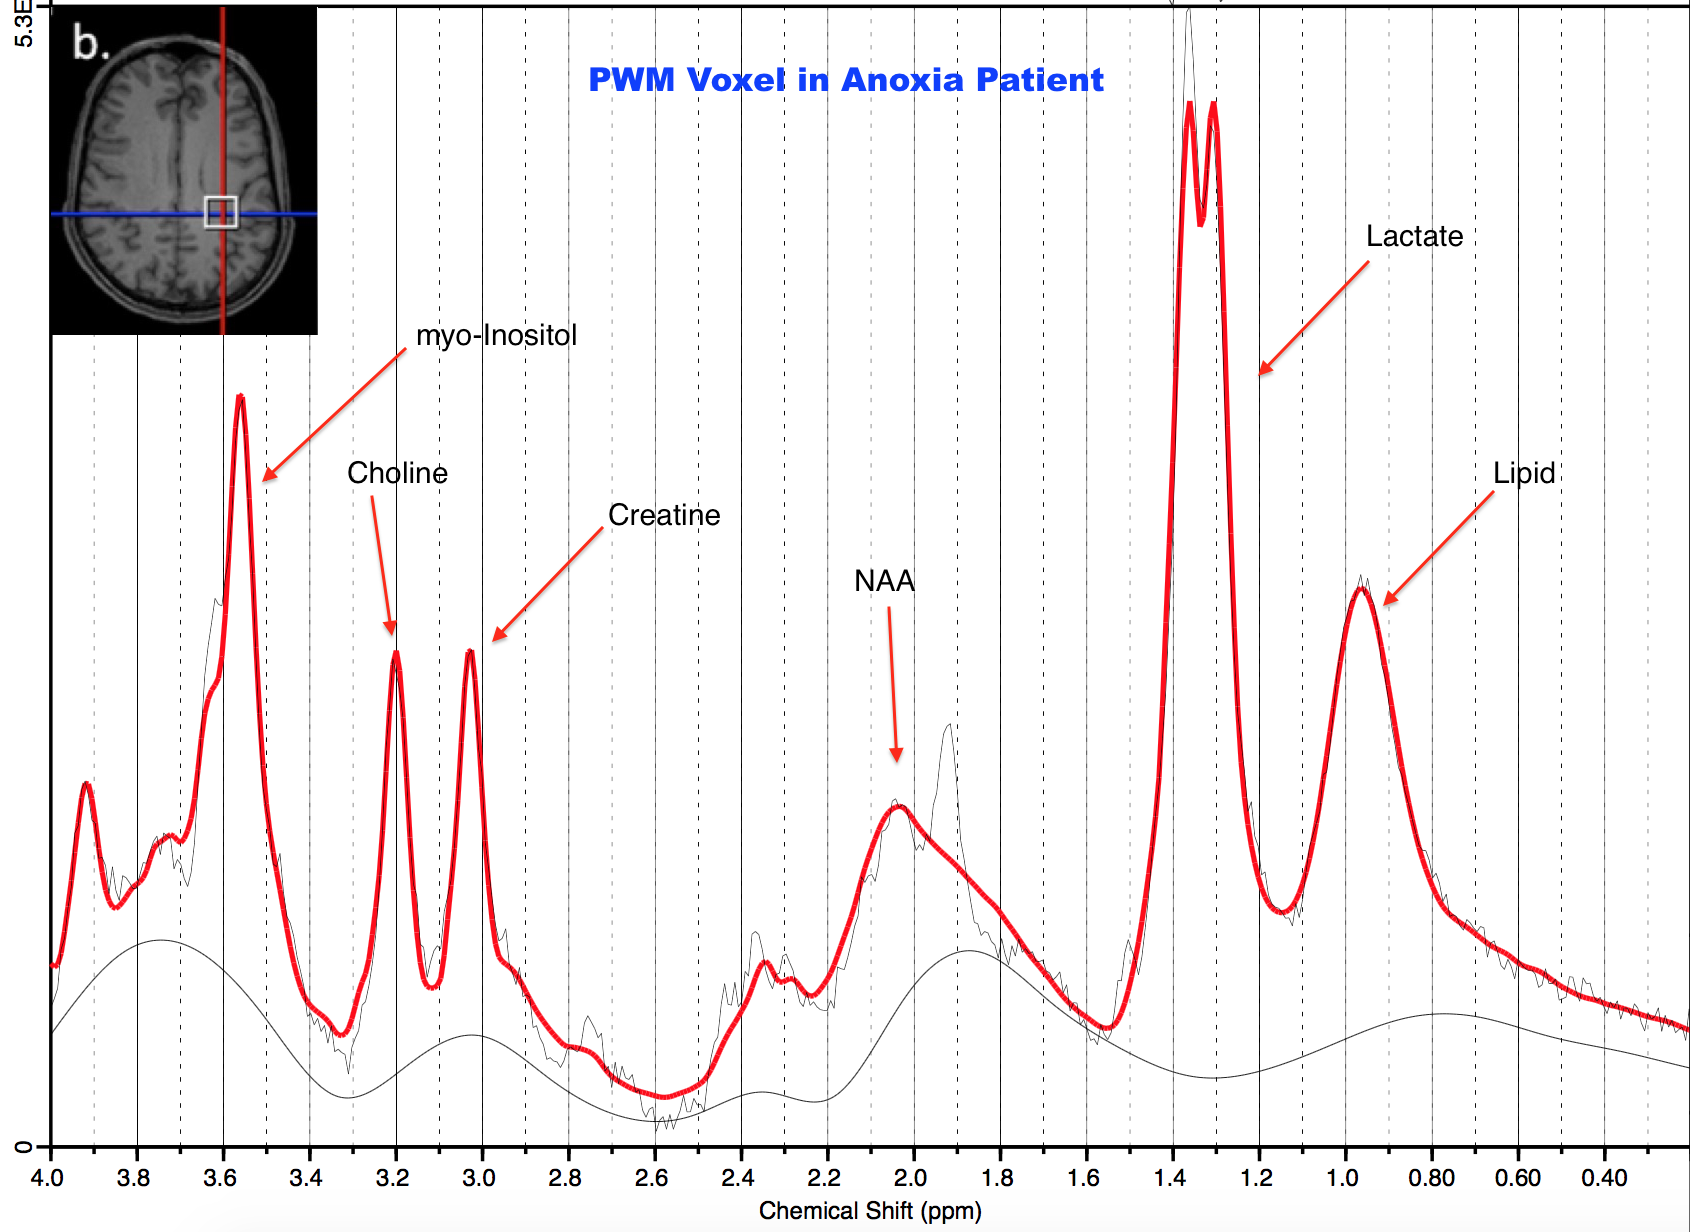
MRS Acquisition/Processing: This study was conducted in a Siemens 3T MAGNETOM Verio with 32-channel head coil. Two brain regions were scanned: posterior cingulate gyrus (PCG; 20x20x20mm, Figure 1 inset) and parietal white matter (PWM; 20x20x20mm, Figure 2 inset). Single Voxel 1H MRS data were acquired in each region using conventional PRESS, with TE = 30 ms, TR = 2s, bandwidth = 1.55 kHz, 1024 complex data points, water saturation, and 128 averaged acquisitions. Unsuppressed water spectra were also acquired for scaling reference. Data were frequency- and phase-corrected6 and processed using LCModel6 as shown in Figures 1 and 2.
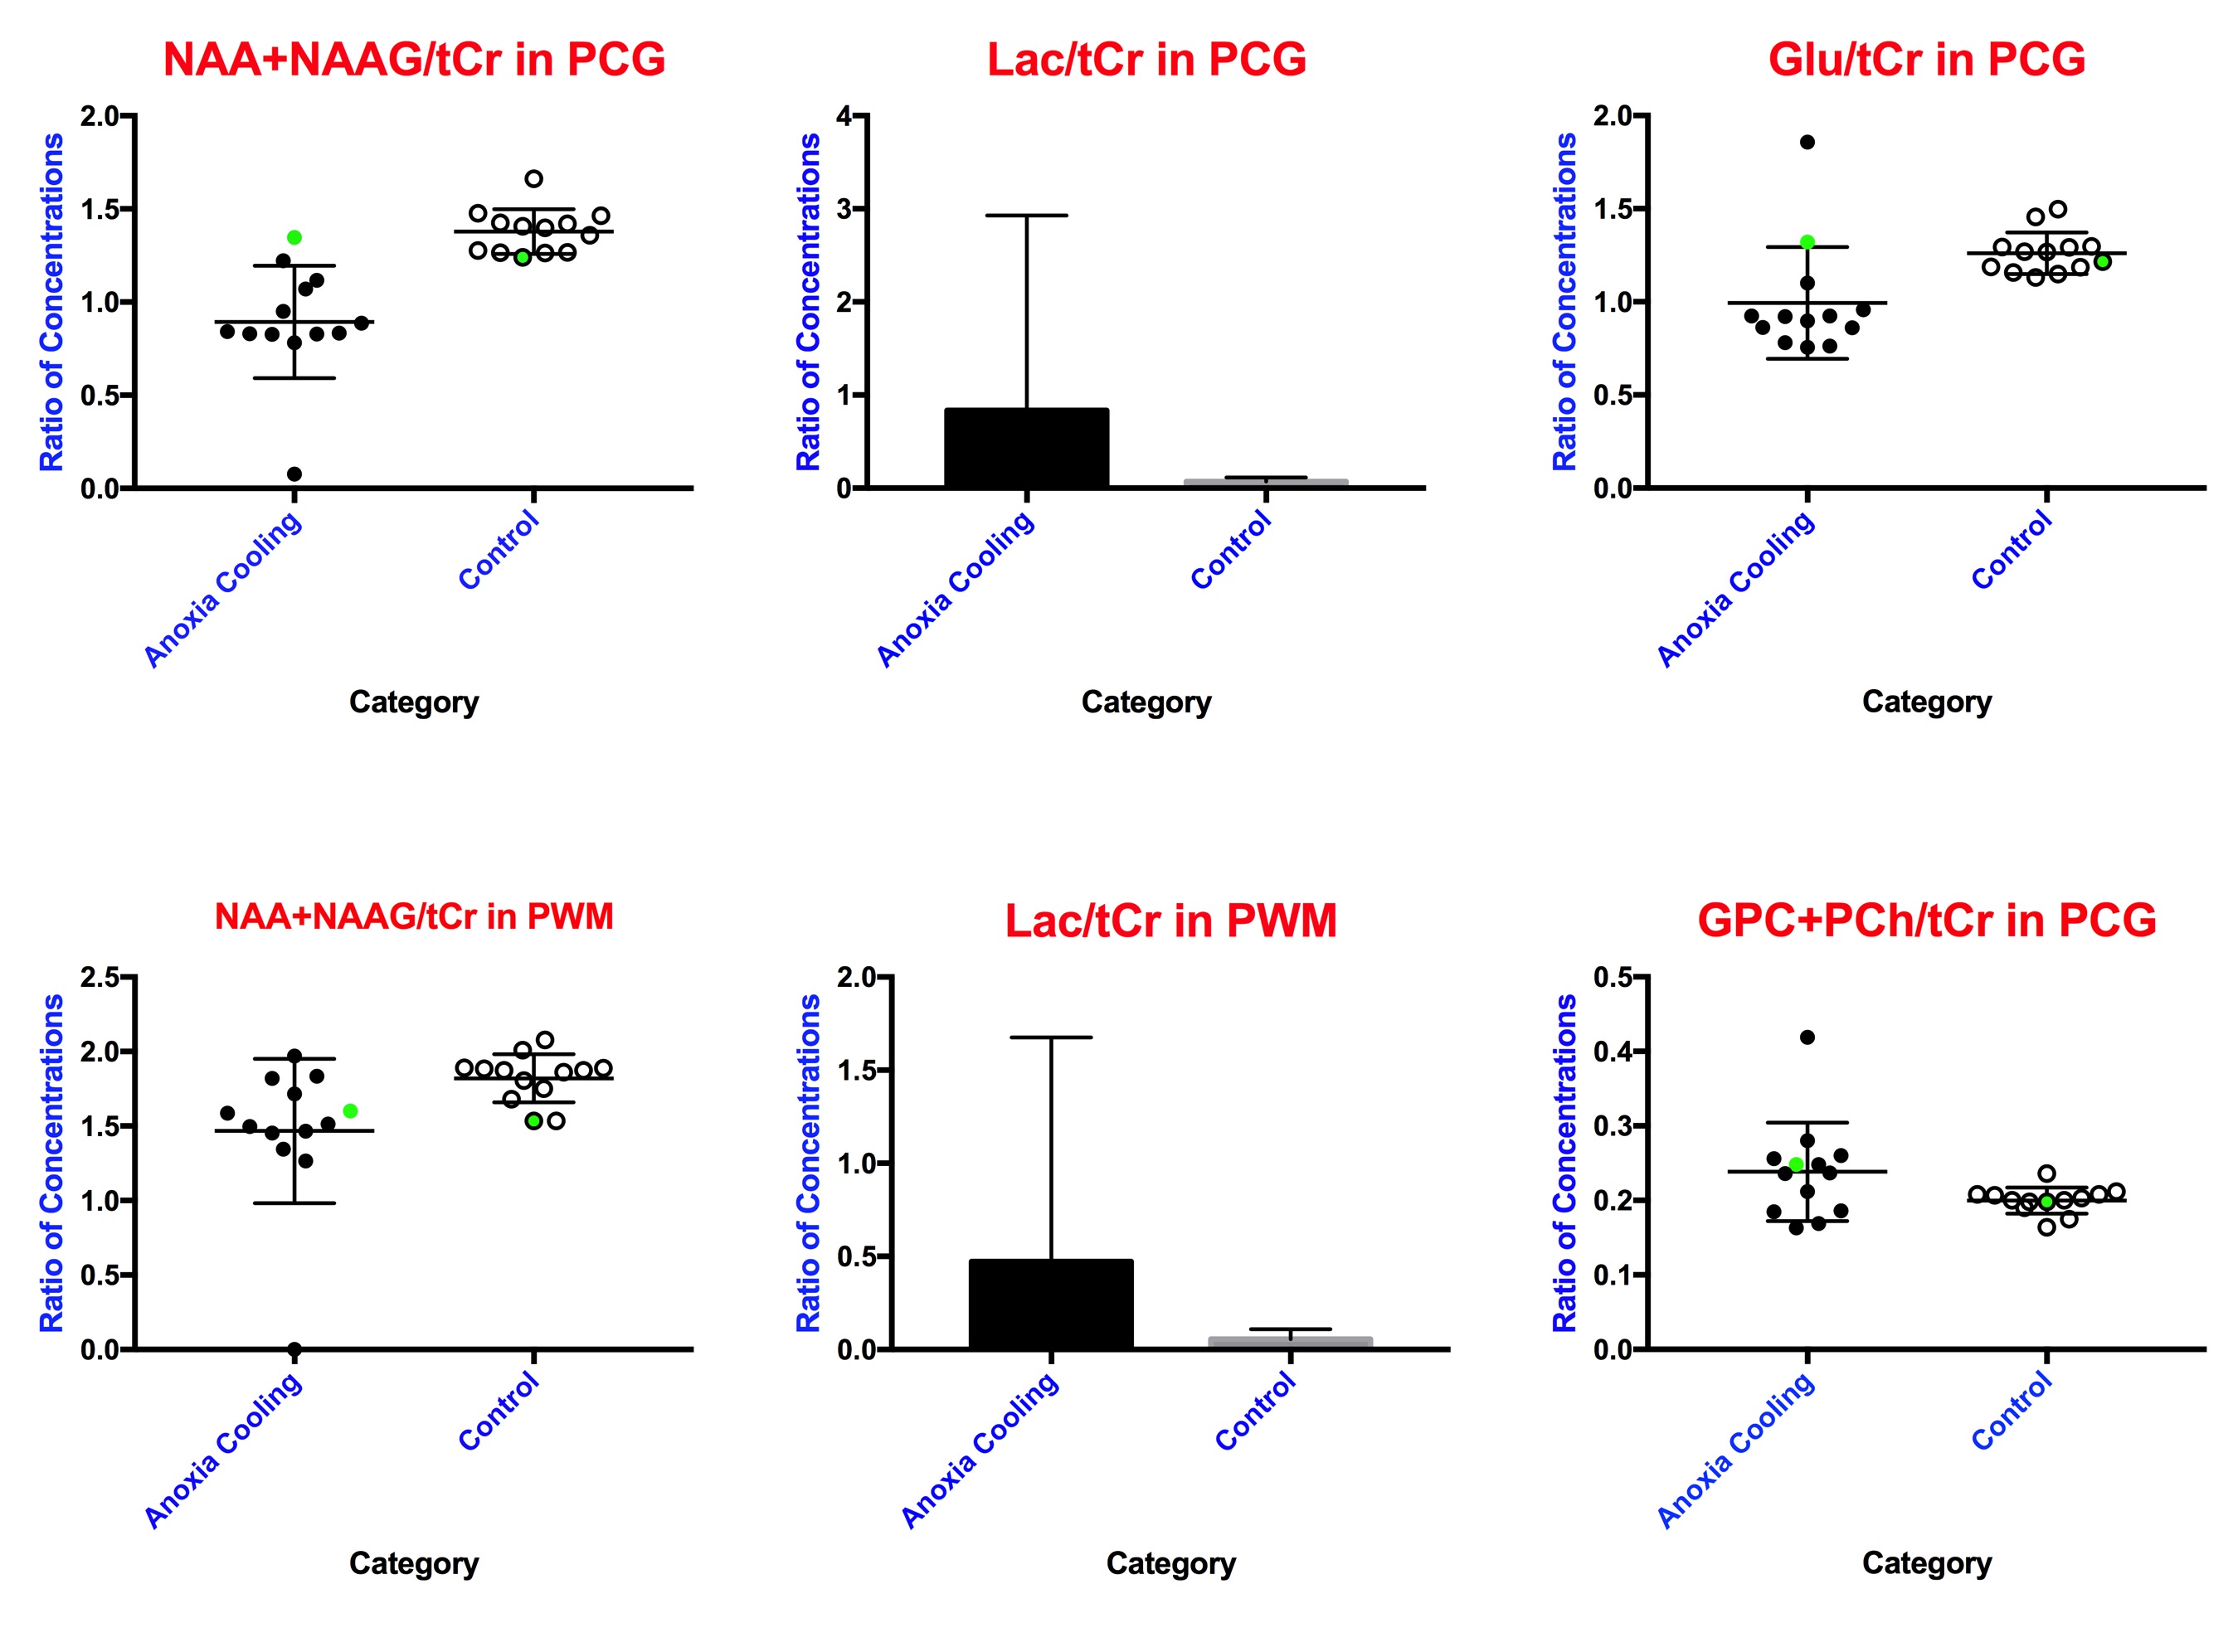
Statistical analysis: Ratios of metabolite concentrations to total Creatine were compared between cohorts using Wilcoxon signed-rank tests (GraphPad Prism 7). This correction was applied to adjust for potentially unequal variance between cohorts. Metabolites with Cramer-Rao Lower Bounds greater than 20% (indicating unreliable data) were excluded from analysis.
Results
Patients showed decreases in total N-acetyl aspartate (NAA) in both PCG and PWM (p=0.0007, p=0.0012 respectively). Additionally, decreases in Glutamate (p=0.0266) and increases in total Choline (GPC+PCh, p=0.0479) were observed in PCG of patients. Lactate, indicative of anoxia, was present in both PCG and PWM of patients (p=0.0034, p=0.0024 respectively).Discussion
The neurometabolic changes in cardiac arrest patients who underwent TMM reflect neuronal, axonal and glial loss that would also result in reduced neurotransmission. The decrease in total NAA in both PCG and PWM of patients indicates loss of neural tissue. This was expected, given that the brain is deprived of necessary oxygen after cardiac arrest, gradually causing brain death. The decrease in glutamate in the PCG indicates compromised brain function in the cardiac arrest patients. The presence of the lactate peak in PCG and PWM demonstrates that the patients show evidence of hypoxic injury after cardiac arrest and/or after TTM. Choline is a constitutive component of cell membranes. Increased choline levels in the PCG of patients reflect membrane breakdown, indicating loss of brain integrity. This is consistent with prior MRS studies of brain injury and coma7. The sole patient with good outcome also had the highest NAA, Glu, and mI levels with minimal lactate (closest to normal) demonstrating that these are not non-specific effects of TTM as shown in Figure 3. These results also demonstrate that the PCG is potentially more sensitive to metabolic changes after cardiac arrest and TTM.Conclusion
The powerful ability of MRS to quantify small neurometabolic differences in comatose cardiac arrest patients who underwent TMM enables better characterization of their condition. The long-term goal is to understand mechanisms of neuronal injury causing neurological dysfunction in such patients. This may enable clinicians to identify patients early on, to target them for novel therapies and also predict outcome when electrophysiological and clinical measures are inconclusive.Acknowledgements
This study was supported by departmental funding from the Brigham and Women’s Hospital Departments of Neurology and Radiology. We would also like to thank the Samuel A. Levine Cardiac Intensive Care Unit teams for their important roles in this study.References
1. Andrea O. Rossetti, Clinical neurophysiology for neurological prognostication of comatose patients after cardiac arrest, In Clinical Neurophysiology Practice, Volume 2, 2017, Pages 76-80, ISSN 2467-981X, https://doi.org/10.1016/j.cnp.2017.03.001. Web. Accessed 8 Nov 2017.
2. Nielsen, N., et al. "Targeted Temperature Management at 33°C versus 36°C after Cardiac Arrest." The New England Journal of Medicine. U.S. National Library of Medicine, 05 Dec. 2013. Web. 08 Nov. 2017.
3. Srinivasan, R. “Methods to improve the Spatial Resolution of EEG”. INTERNATIONAL JOURNAL OF BIOELECTROMAGNETISM, 1999, Volume 1, Number 1.<http://www.ijbem.org/volume1/number1/pdf/ijbem_a102-111.pdf> Web. Accessed 8 Nov 2017.
4. Kreis, R. et al. Hypoxic encephalopathy after near-drowning studied by quantitative 1H-magnetic resonance spectroscopy. Metabolic changes and their prognostic value. J. Clin. Invest. 97, 1142–1154 (1996). Web. Accessed 8 Nov 2017.
5. Szumita, P. M. et al. Implementation of a Hospital-wide Protocol for Induced Hypothermia Following Successfully Resuscitated Cardiac Arrest. Crit. Pathw. Cardiol. 9, 216–20 (2010). Web. Accessed 8 Nov 2017.
6. Provencher, S. (2009) LCModel and LCMgui User’s Manual. Web. Accessed 8 Nov 2017. <http://s-provencher.com/pub/LCModel/manual/manual.pdf>
7. Weiss, Nicolas et al. “Clinical Review: Prognostic Value of Magnetic Resonance Imaging in Acute Brain Injury and Coma.” Critical Care 11.5 (2007): 230. PMC. Web. Accessed 8 Nov. 2017.
Figures