2067
Sleep Deprived and Well Rested Brains are Distinguishable by Machine Learning in T1w Imaging1NIH, Bethesda, MD, United States, 2NIH/NIMH, Bethesda, MD, United States
Synopsis
We investigated 166 T1-weighted datasets to identify neural biomarkers of sleep deprivation (3h sleep). We find that a linear classification algorithm is able to distinguish between sleep deprived and well-rested brains at 65% accuracy in T1-weighted images. The underlying hypothesis is that if glymphatic function is mediated by sleep, one should be able to tell the difference between sleepy and rested brains based on subtle shifts in T1 across brains.
Introduction
The Glymphatic system is a recently discovered system [Xie 2013], the function of which may underlie multiple pathologies. Its function is the clearance of metabolic wastes from the central nervous system, and therefore when its function is modulated, one should be able to measure the difference in brain composition. It is evident from the rat literature that glymphatic function may be modulated through sleep [Xie 2013]. Since the function of the glymphatic system is based on water volume redistribution between inter-cellular space and extracellular space, we hypothesize changes glymphatic functions are associated with subtle changes of T1-values. Here, we examine how well a classification algorithm can distinguish between sleep deprived and well rested brains, with a large dataset of the Stockholm Sleepy Brain study [Nielsonne 2016]. We aim to do so as a cursory exploration into T1w MRI as a method for assessing glymphatic function. The purpose of the study is to conduct a pilot analysis with open data to investigate whether structural MRI images can reveal neural-biomarkers related to functions of the glymphatic system during sleep.Methods
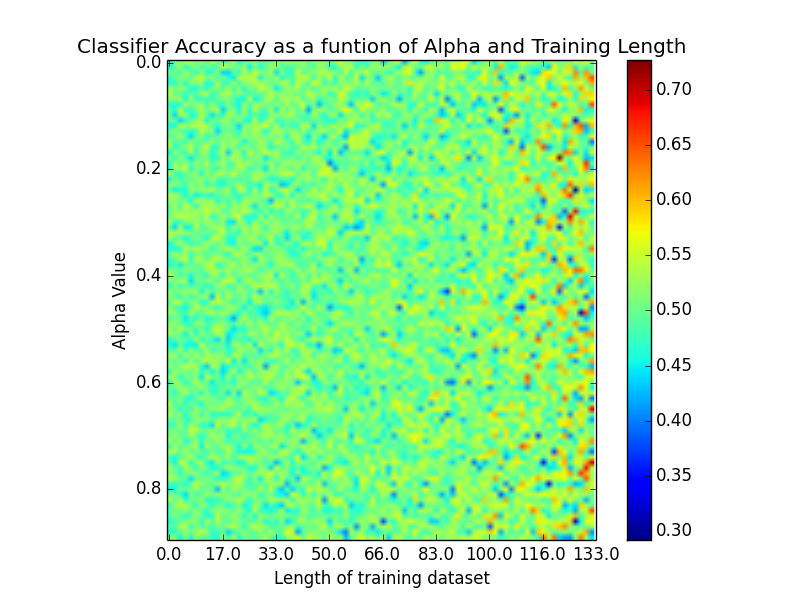
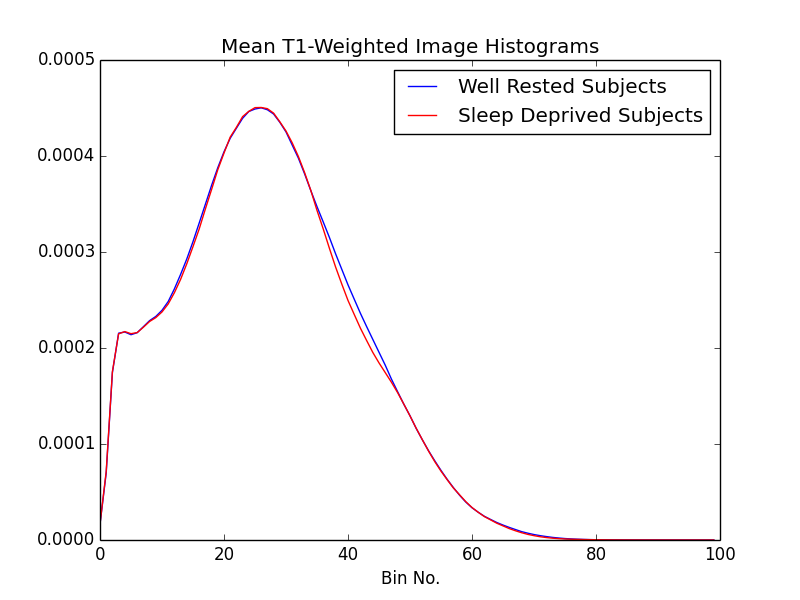
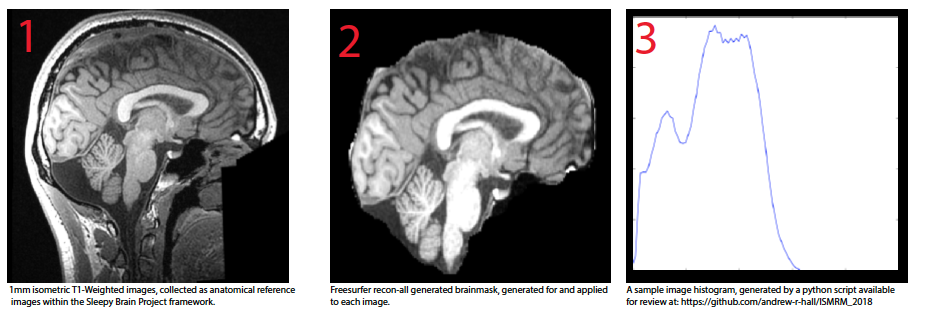
T1w data from 86 participants were taken from the Stockholm Sleepy Brain Project via OpenFMRI, 83 of which were scanned in both sleep deprived (SD-3h of sleep) and well rested (WR) states—the remaining three were only scanned once, for a total of 166 images. Resolution was 1 mm. Each image was run through FreeSurfer’s recon-all program (https://surfer.nmr.mgh.harvard.edu/), in order to produce brain masks. The masked images were fed into a python script (available at <github link here>) where they were decomposed into image histograms. The histograms were further decomposed into their statistical moments (mean, variance, skew, and kurtosis). These parameters were then fed into a linear ridge classifier, which was tested on the remaining data points. The length of the classifier’s training dataset was swept between 0.2 and 0.9 times the total number of images, with peak performance typically occurring between 0.8 and 0.9. Similarly, alpha (the only other parameter fed to a ridge classifier) was iteratively tested between 0.1 and 1.0 in .01 increments.Results
Fig. 1 shows the performance of the classifier, dependent upon training length and alpha. Performance is typically maximal at around 65%.Discussion and Conclusion
The results presented here indicate that there are significant changes in the brain tissue composition upon sleep deprivation, manifested in absolute values of T1. As glymphatic pathways are believed to clear wastes via CSF flow, this difference in T1 may be explained simply as a difference in CSF volume. Other sources of sleep-related changes in T1 that are unrelated to the glymphatic system might also partly contribute to the measured change of T1 distributions. Such as, hydration and time-of-day-effect [Trefler 2016] or oxygenation level and baseline perfusion [Tardif 2017] etc. The data used here were originally not collected in order to investigate structural differences, rather as anatomical references in an investigation of how sleep deprivation changes functional connectivity. Here, these data could be used as pilot data in a further investigation into anatomical differences between SD and WR states, where one could collect images more suited for cross subject comparison, such as physically quantitative anatomical images. However, the fact that this classifier performs anywhere above chance is exciting. Other machine learning algorithms may be better suited for this task than such a simplistic classifier. Eventually, this problem could become a regression rather than a classification, as we would like to ultimately assess how well a particular subject is clearing metabolites from their brain, not simply whether this is happening. Overall, a technique for assessing the glymphatic status of a subject could prove invaluable for future research, and MRI seems to be a promising technology for doing so.Acknowledgements
This research is supported by the NIMH Intramural Research Program (#ZIA-MH002783).
Portions of this study utilized the high-performance computational capabilities of the Biowulf Linux cluster at the National Institutes of Health, Bethesda, MD (http://biowulf.nih.gov).
This data was obtained from the OpenfMRI database. Its accession number is ds000201
References
[Xie 2013] Xie et al., 2013, Science, 342:373-377, Sleep drives metabolite clearance from the adult brain.
[Nilsonne 2016] Nilsonne et al., 2016, bioRxiv, 7:9422, A multimodal brain imaging dataset on sleep deprivation in young and old humans[Trefler 2016] Trefler et al., 2016. Neuroimage 133:41–52. Impact of time-of-day on brain morphometric measures derived from T 1 -weighted magnetic resonance imaging.
[Tardif 2017] Tardif et al., 2017. Neuroimage 149:233–243. Investigation of the confounding effects of vasculature and metabolism on computational anatomy studies.
Figures