2066
Effect of autolysis, fixation, and storage in PBS on relaxation rates and macro-molecular tissue volume across fiber pathways of the human brain1Department of Systems Neuroscience, Medical Center Hamburg-Eppendorf, Hamburg, Germany, 2Center for Diagnostics, Institute of Legal Medicine, Medical Center Hamburg-Eppendorf, Hamburg, Germany
Synopsis
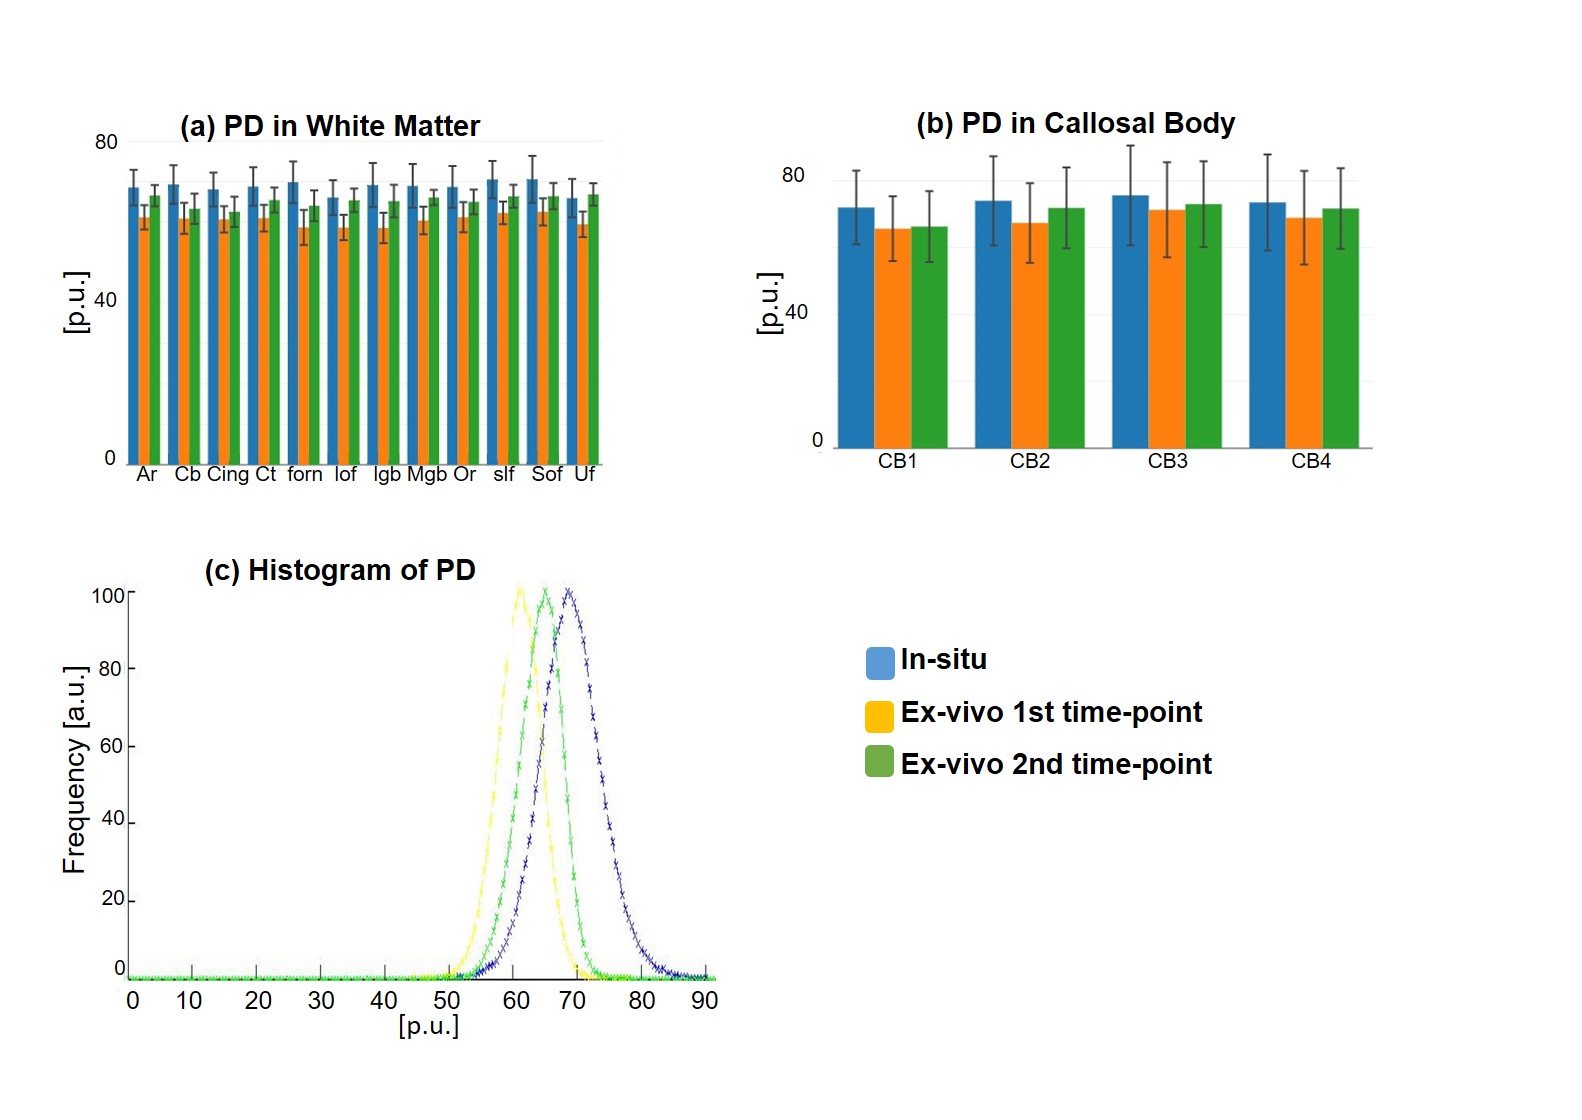
We evaluated the effect of autolysis, brain tissue fixation, and embedding into PBS on three potential quantitative myelin MRI markers across different white matter fiber pathways: longitudinal (R1) and effective transverse (R2*) relaxation rates, and macro-molecular tissue volume (MTV) using the quantitative multi-parameter mapping (MPM) protocol. We found that the effect of autolysis was most apparent in R2* and MTV, R1 drastically changed its contrast after fixation, and R1 and R2* values increased after storage in Phosphate-Buffered Saline (PBS) solution.
Introduction
Biophysical models using myelin and fiber density markers based on quantitative MRI (qMRI) such as the MR g-ratio need to be validated by comparison to the ex-vivo histology gold standard. However, the fixation process and autolysis strongly modify tissue composition, leading to MR signal changes and making the validation challenging. Using the multi-parameter mapping (MPM) protocol 1, we investigated the effect of autolysis, fixation, and embedding into PBS on three quantitative MRI markers for myelin: longitudinal (R1) and effective transverse (R2*) relaxation rates, and macro-molecular tissue volume (MTV) 2, estimated from quantitative proton density (PD) measures.Method
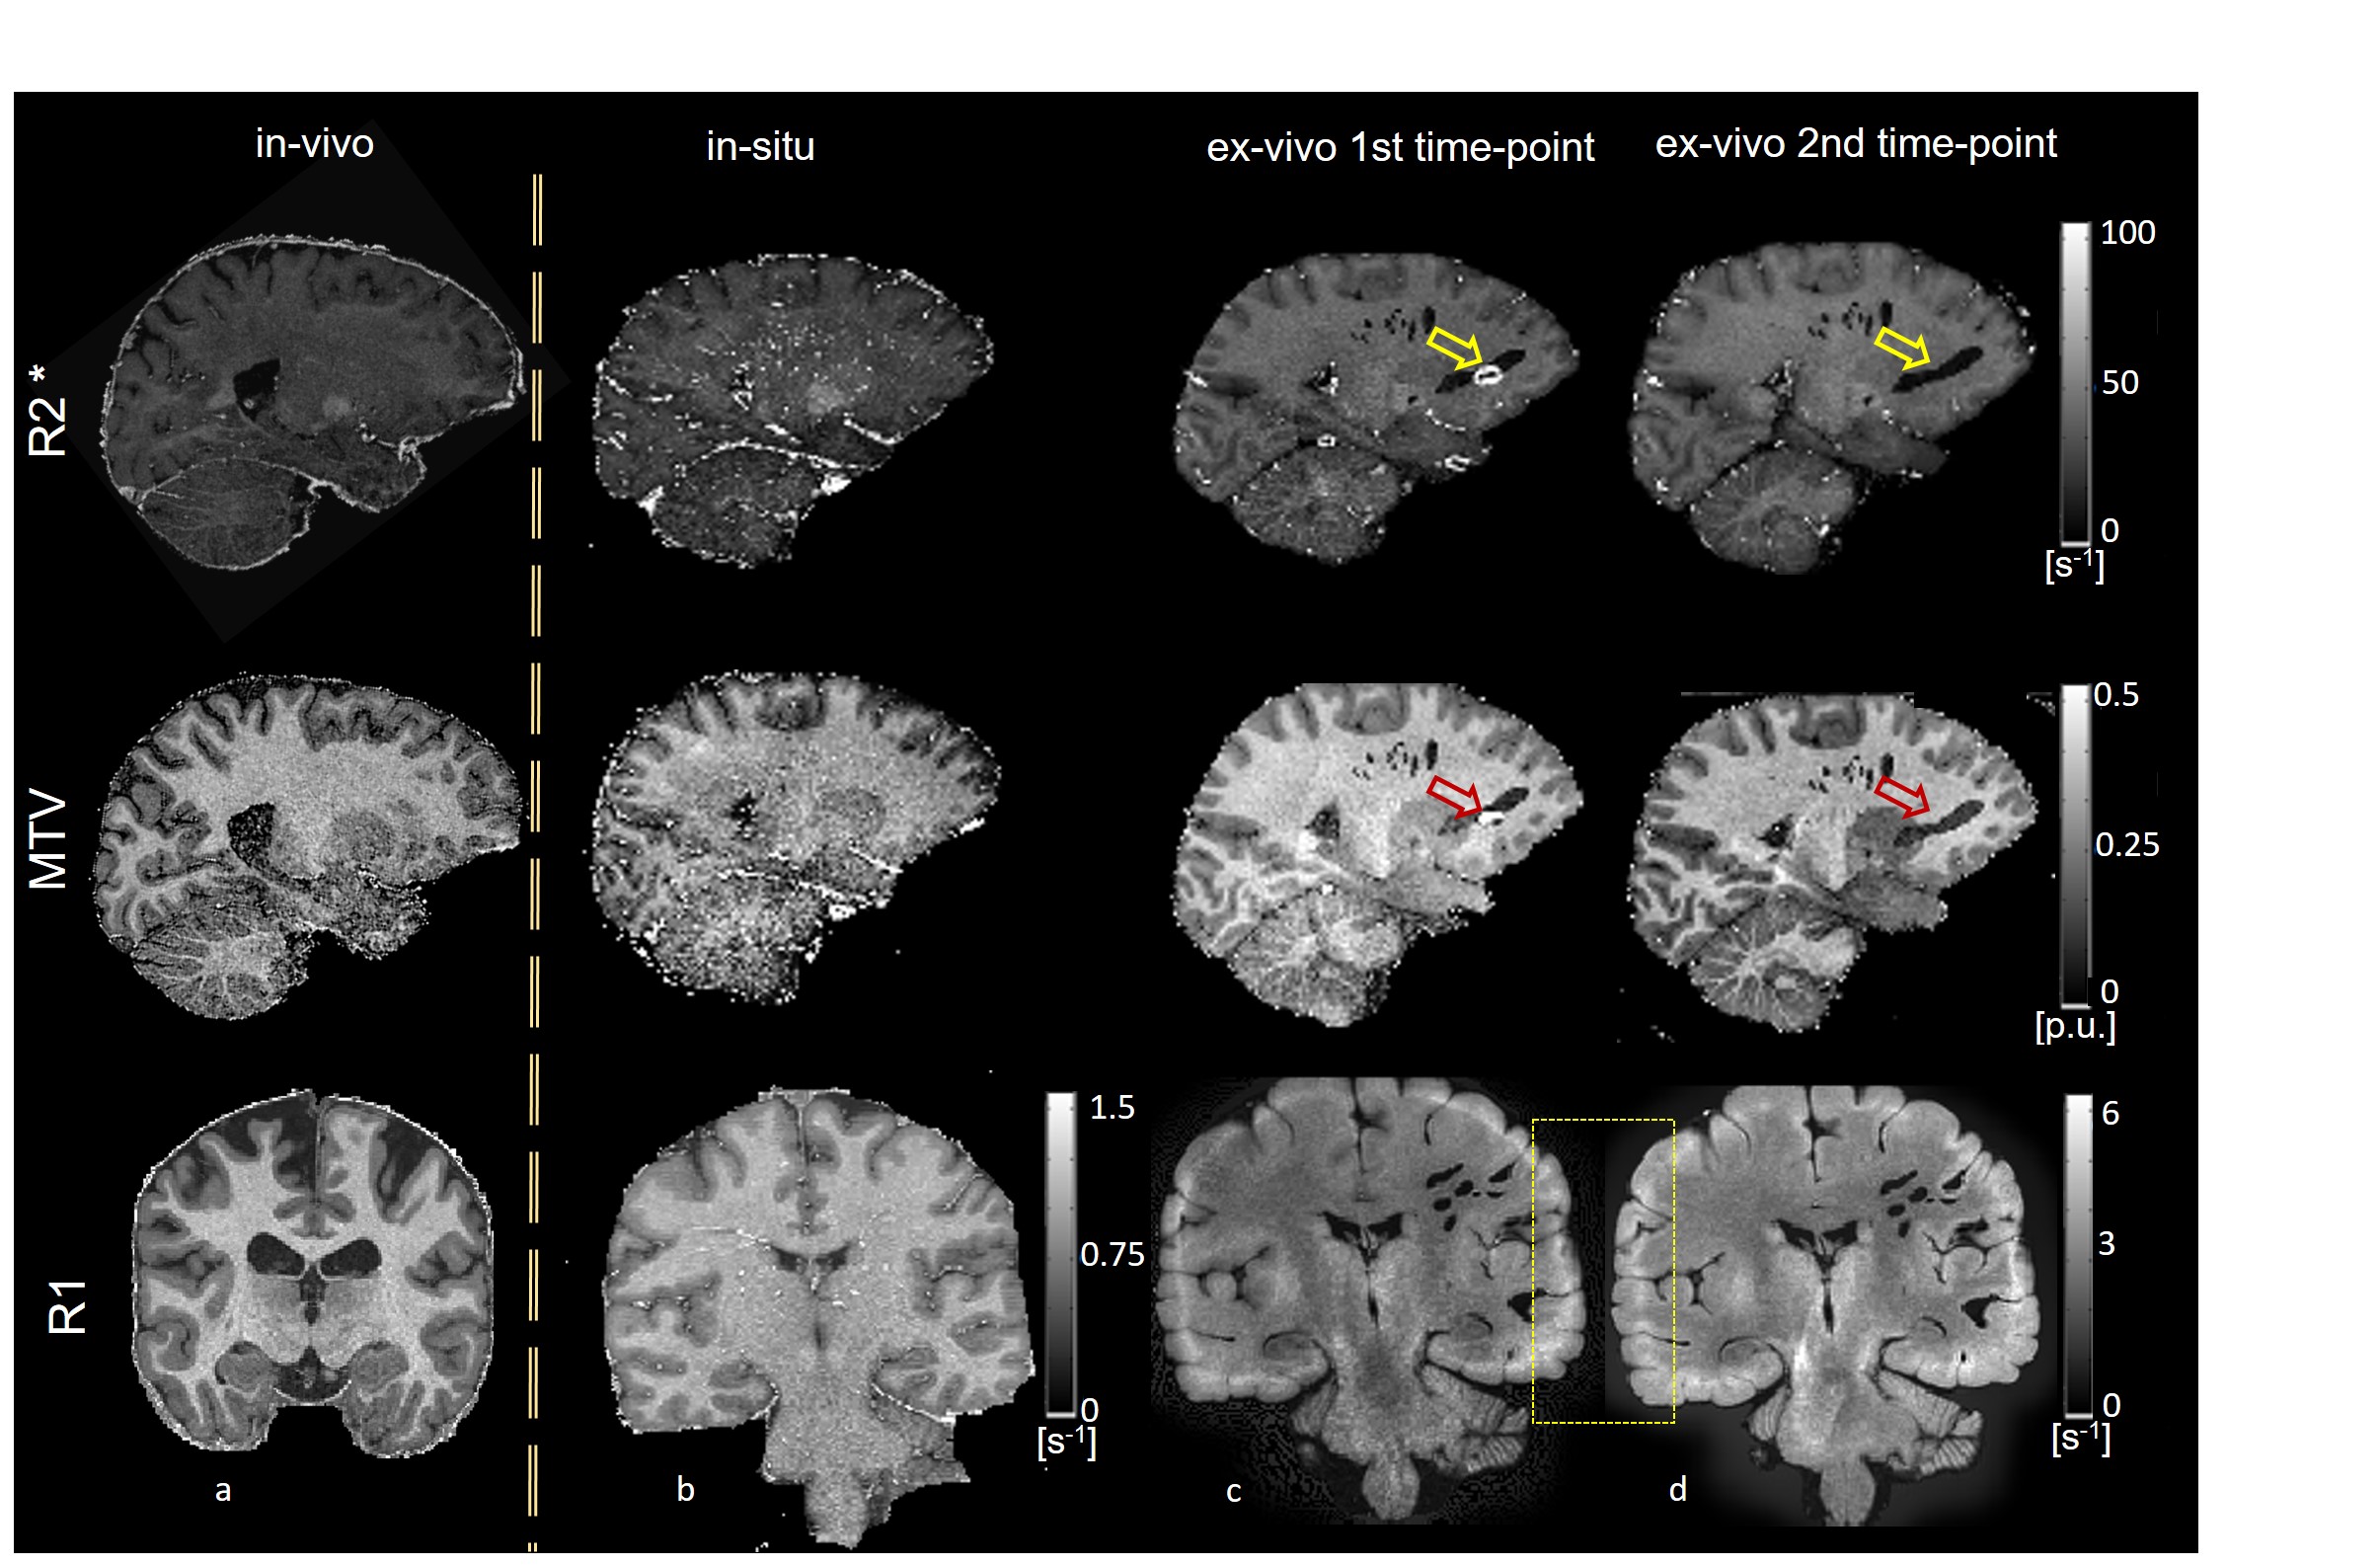
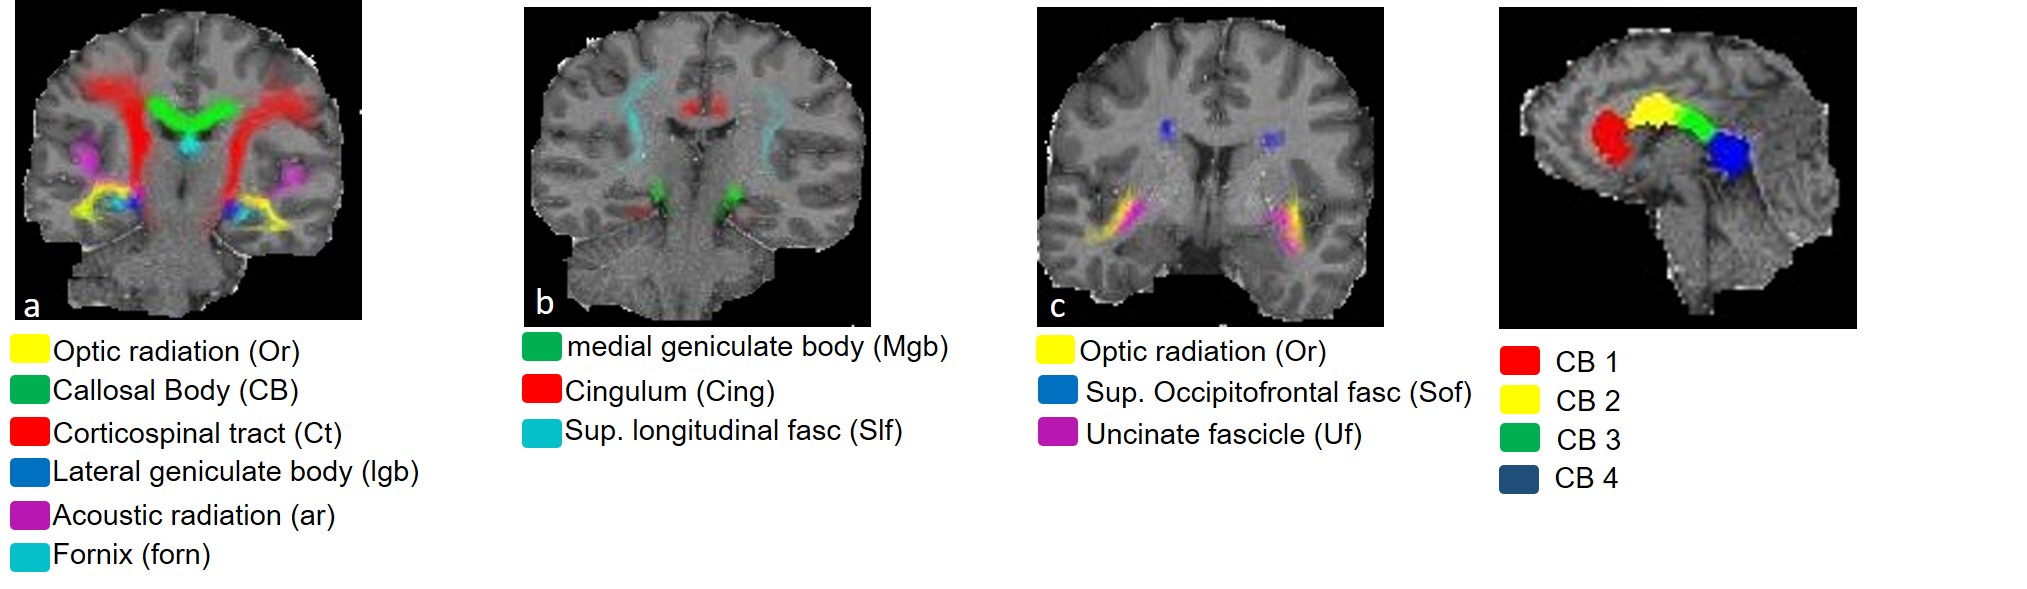
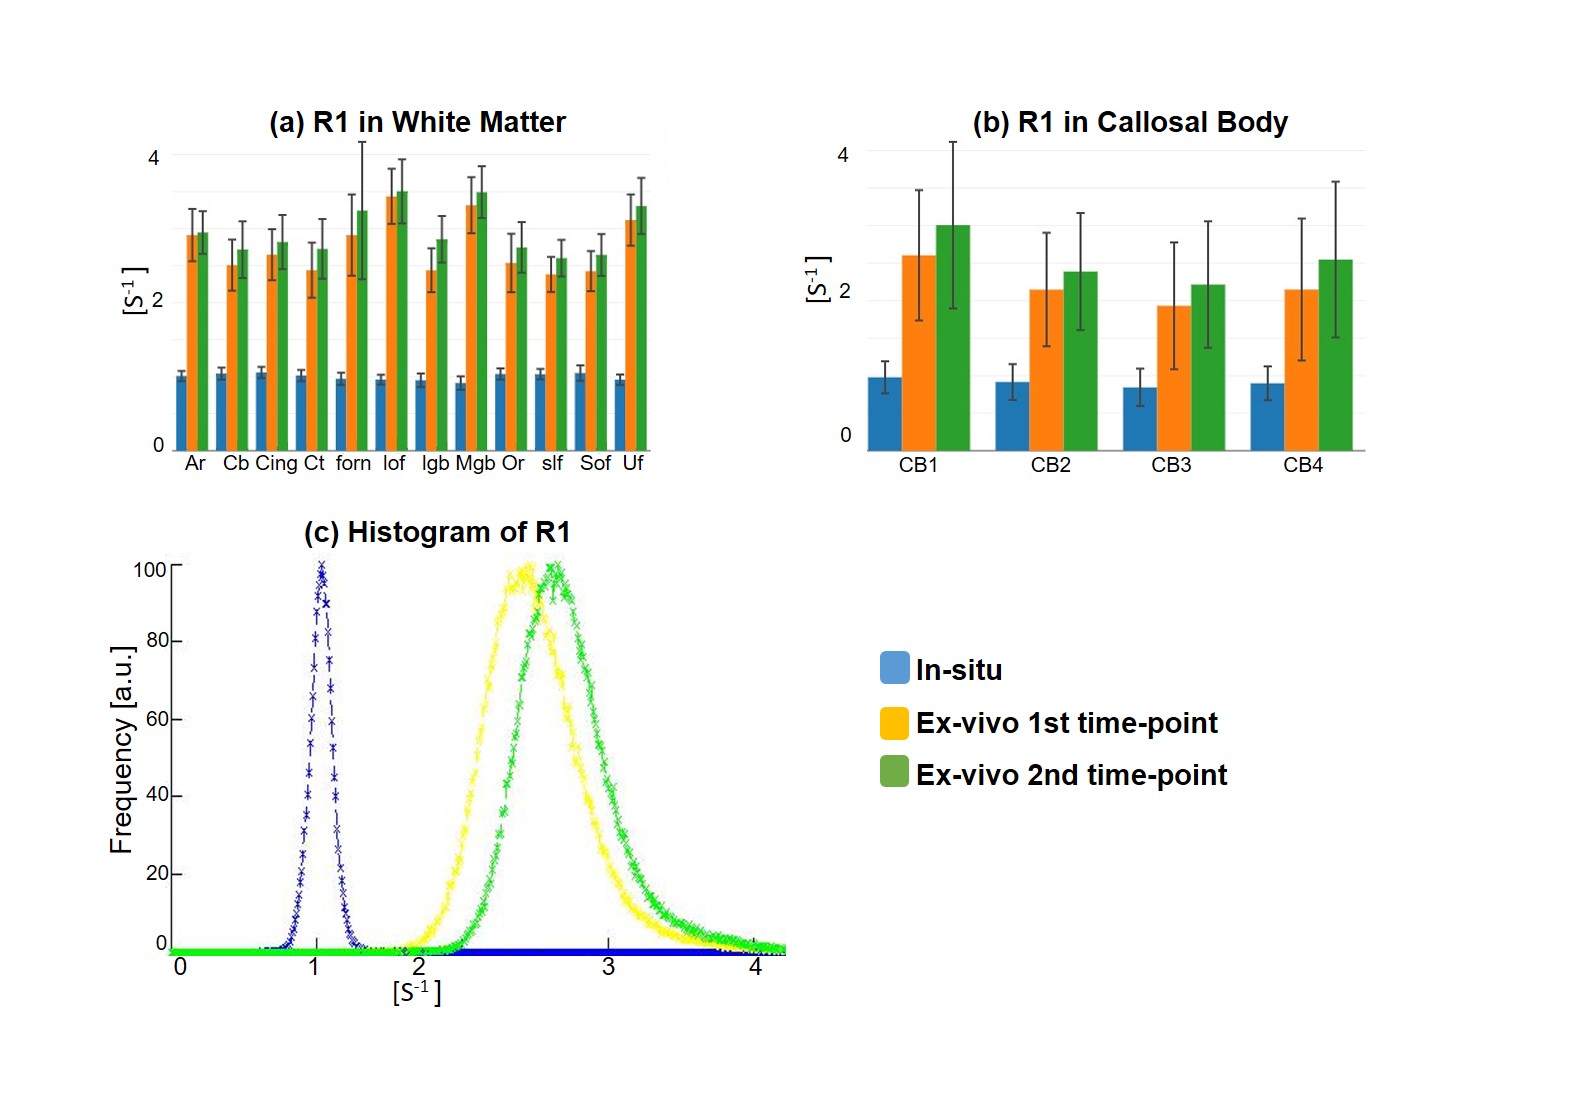
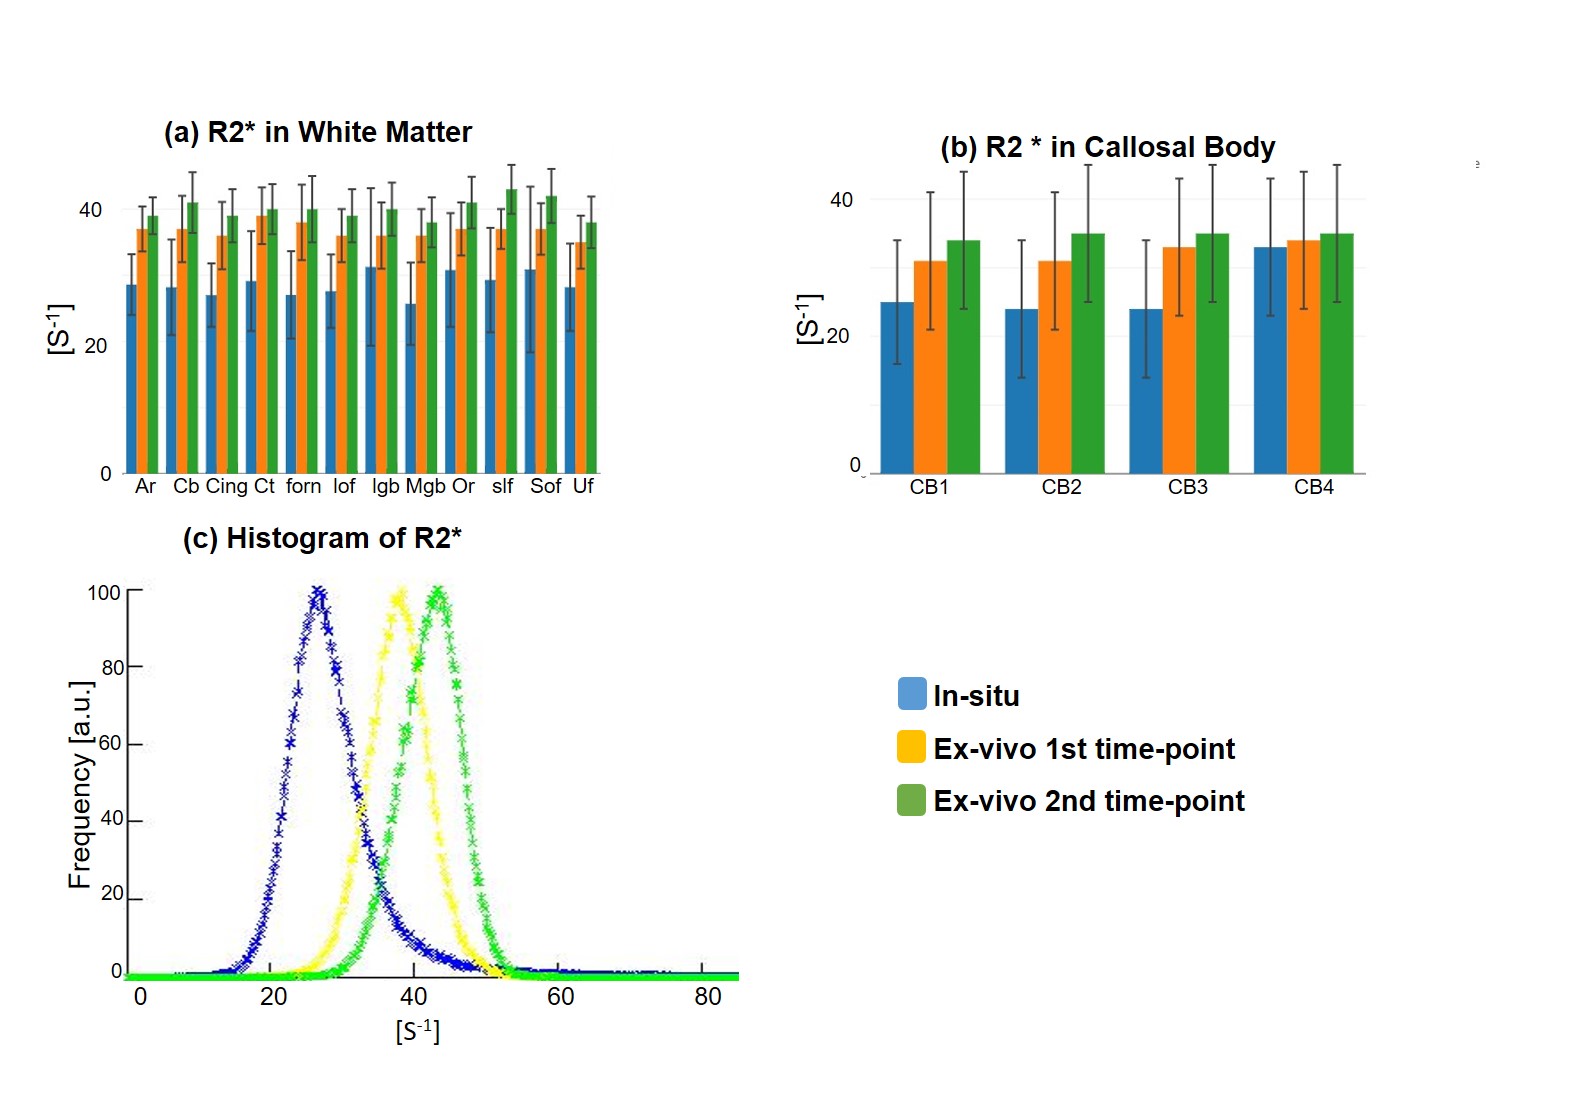
One unfixed human cadaver brain (20h postmortem time) was measured in-situ on a 3T Tim Trio (Siemens Healthcare, Erlangen Germany) using a time efficient multi-parameter mapping (MPM) protocol 1. First, rapid calibration data were acquired to correct for inhomogeneities in the RF transmit field 3,4. Second spoiled multi-echo 3D fast low angle shot (FLASH) data were acquired with predominantly PD, T1, or MT weighting according to the MPM protocol 1. The MT data were not used here. The flip angle was 6° for the PD-weighted volumes and 27° for the T1-weighted acquisition. These data were acquired with whole-brain coverage at an isotropic resolution of 800 µm. Gradient echoes were acquired with alternating readout gradient polarity at equidistant echo times ranging from 2.34 to 18.44 ms in steps of 2.30 ms using a readout bandwidth of 488 Hz/pixel. 8 echoes were acquired with a repetition time (TR) of 25 ms for all FLASH volumes. From the reduced MPM protocol, quantitative R2*, R1, and PD maps were calculated using the MPM modelling framework described elsewhere 1,5,6. MTV was calculated from PD via: MTV = 1-PD/100 as described in 2. Then, the brain was extracted from the cadaver heads. The complete brain was immersed with 4% Paraformaldehyde in aqueous solution (Formalin). After 98 days, the fixed ex-vivo brain was embedded into a PBS Phosphate-Buffered Saline (pH=7.4, isotonic solution), and re-scanned with a similar MRI protocol (the flip angle for T1w was decreased to 23°) shortly after embedding the brain into PBS (i.e. at day 99) and after a longer period of storage in PBS (i.e. at day 218). The ex-vivo MPM maps were registered to the in-situ brain using affine and non-linear registrations available in SPM 7,8. Using the same tools, fiber-tract region-of-interests (ROIs) as defined in the Jülich-white-matter atlas 9,10 were registered to the in-situ brain (Fig. 2). Note that for quantitative comparison (Figs. 3-5), we used the original PD values instead of MTV.Results and Discusion
Qualitative assessment of the MPM maps (Fig. 1) revealed that the in-situ brain had similar contrasts as a representative in-vivo brain for all three parameter maps. After fixation the contrast changed drastically in R1 and a bright rim at the cortex was observed (Fig. 1, bottom row). The contrast changed less strong in R2* and almost no change was observed in MTV. Moreover, after fixation we found holes in the ex-vivo brain, potentially due to autolysis processes. In particular, the R2* maps revealed bright rings in the “autolysis holes” (Fig. 1, arrow), indicating that the autolysis processes were not completed at the second time point when the brain was embedded in PBS. The quantitative assessment revealed increasing R1 and R2* values after fixation and storage in PBS (Figs. 3,4). PD (Fig. 5) decreased after fixation, but increased again after storage in PBS. Interestingly, R1 showed much higher variability across white matter fiber-tract ROIs after fixation and storage in PBS as compared to in-situ. In particular, after fixation R1 values across the callosum body ROIs in Figure 3b showed a similar trend (high-low-high) as reported for the absolute density of small fibers in the corpus callosum 11. The in-situ R1 values across white matter tracts are comparable to the values reported in 12, while the R1 values (2 s-1 to 3 s-1) of the fixed ex-vivo brain are slightly lower than what was reported in 13 at 22°C (T1 ~ 255 ms, i.e. R1 ~ 4 s-1).Conclusion
The effect of autolysis, fixation, and storage in PBS across white matter manifests differently in R1, R2* and PD. While R1 seems to be most sensitive to the chemical changes as introduced by fixation (e.g. cross-linking of proteins 13,14), R2* and PD seem to be more sensitive to autolysis effects. Storage of the tissue in PBS recovers PD values almost to the in-situ situation. This, however, does not necessarily mean that PD, measured ex-vivo after PBS washing covers the same microscopic information as in-situ.Acknowledgements
SM received funding from the European Union's Horizon 2020 research and 654 innovation programme under the Marie Sklodowska-Curie grant agreement No 658589, and from the BMBF (01EW1711A and B) in the framework of 656 ERA-NET NEURON. The authors are grateful to Martina Callaghan and Nikolaus Weiskopf for valuable discussions and for providing the multi-parameter mapping sequences.References
1.Weiskopf, N. et al. Quantitative multi-parameter mapping of R1, PD*, MT and R2* at 3T: a multi-center validation. Front. Brain Imaging Methods 7:, 95 (2013).
2.Mezer, A. et al. Quantifying the local tissue volume and composition in individual brains with magnetic resonance imaging. Nat. Med. 19, 1667–1672 (2013).
3.Lutti, A. et al. Robust and fast whole brain mapping of the RF transmit field B1 at 7T. PloS One 7, e32379 (2012).
4.Lutti, A., Hutton, C., Finsterbusch, J., Helms, G. & Weiskopf, N. Optimization and validation of methods for mapping of the radiofrequency transmit field at 3T. Magn. Reson. Med. Off. J. Soc. Magn. Reson. Med. Soc. Magn. Reson. Med. 64, 229–238 (2010).
5.Weiskopf, N., Callaghan, M. F., Josephs, O., Lutti, A. & Mohammadi, S. Estimating the apparent transverse relaxation time (R2*) from images with different contrasts (ESTATICS) reduces motion artifacts. Brain Imaging Methods 8, 278 (2014).
6.Ellerbrock, I. & Mohammadi, S. Four in vivo g-ratio-weighted imaging methods: Comparability and repeatability at the group level. Hum. Brain Mapp. (in press). doi:10.1002/hbm.23858.
7.Ashburner, J. A fast diffeomorphic image registration algorithm. NeuroImage 38, 95–113 (2007).
8.Friston, K. J., Ashburner, J. T., Kiebel, S. J., Nichols, T. E. & Penny, W. D. Statistical Parametric Mapping: The Analysis of Functional Brain Images. (Academic Press, 2006).
9.Eickhoff, S. B. et al. A new SPM toolbox for combining probabilistic cytoarchitectonic maps and functional imaging data. NeuroImage 25, 1325–1335 (2005).
10.Bürgel, U. et al. White matter fiber tracts of the human brain: Three-dimensional mapping at microscopic resolution, topography and intersubject variability. NeuroImage 29, 1092–1105 (2006).
11.Björnholm, L. et al. Structural properties of the human corpus callosum: Multimodal assessment and sex differences. NeuroImage 152, 108–118 (2017).
12.Yeatman, J. D., Wandell, B. A. & Mezer, A. A. Lifespan maturation and degeneration of human brain white matter. Nat. Commun. 5, 4932 (2014).
13.Birkl, C. et al. Effects of formalin fixation and temperature on MR relaxation times in the human brain. NMR Biomed. 29, 458–465 (2016).
14. Thavarajah, R., Mudimbaimannar, V. K., Elizabeth, J., Rao, U. K. & Ranganathan, K. Chemical and physical basics of routine formaldehyde fixation. J. Oral Maxillofac. Pathol. JOMFP 16, 400–405 (2012). 15.Lamantia, A. S. & Rakic, P. Cytological and quantitative characteristics of four cerebral commissures in the rhesus monkey. J. Comp. Neurol. 291, 520–537 (1990).
16.Aboitiz, F., Scheibel, A. B., Fisher, R. S. & Zaidel, E. Fiber composition of the human corpus callosum. Brain Res. 598, 143–153 (1992).
Figures