2063
White Matter Microvascular Changes in Healthy Aging1Advanced Imaging Research Center, Oregon Health & Science University, Portland, OR, United States, 2Neurological Surgery, Oregon Health & Science University, Portland, OR, United States, 3Neurology, Oregon Health & Science University, Portland, OR, United States
Synopsis
The extent to which changes in blood-brain-barrier permeability are associated with healthy aging is poorly understood. Pharmacokinetic modeling of dynamic-contrast-enhanced MRI yields quantitative estimates of BBB water permeability. DCE-MRI data were collected from 40 healthy controls (aged 34-80 yrs) at 7T. Declines in pharmacokinetic parameters were significant across the entire age range included in this study. Because changes in BBB permeability to water and other small molecules are likely to precede the leakage of CR and larger macromolecules, these estimates represent particularly important probes of the subtle BBB abnormalities that are likely to accompany healthy brain aging.
Introduction
The blood-brain barrier (BBB) plays a key role in water homeostasis throughout the brain. While BBB abnormalities of focal lesions are well-described, the extent to which BBB permeability changes accompany the more subtle processes associated with healthy aging remains poorly understood. Pharmacokinetic modeling of rapidly sampled dynamic-contrast-enhanced MRI (DCE-MRI) data during the first pass of a low molecular weight contrast reagent (CR) using a model that explicitly incorporates exchange effects yields estimates of the intravascular water volume fraction (vb) and the mean transendothelial water exchange rate constant (kpo), potentially a quantitative surrogate of brain metabolism.1,2Methods
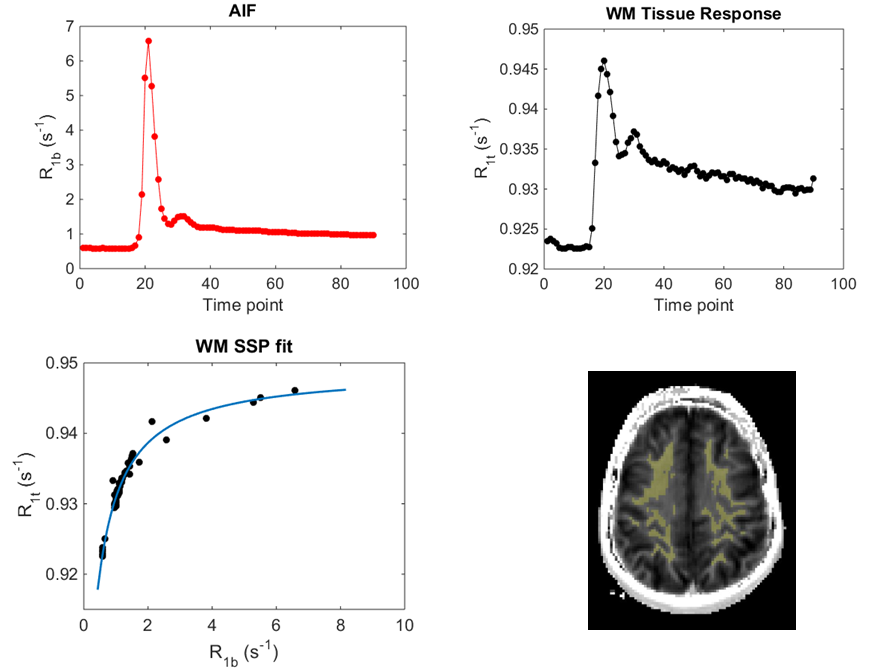
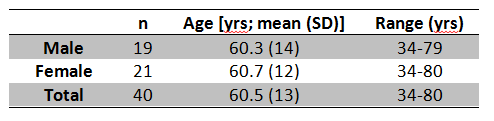
DCE-MRI data were acquired from 40 healthy controls between 34 and 80 years of age (see Table 1) on a 7T MRI instrument (Siemens) with quadrature transmit coil and either an 8- or 24-channel phased-array receive RF coil. A single axial slice inversion recovery (IR) turboflash sequence (5.5-10 mm slice thickness; TR/TE/FA 285/1.25/6°; 64x64 image matrix; FOV (192 mm)2; or 285/1.15/6°; 128x96 image matrix; FOV 256x192 mm2) was positioned in the centrum semiovale (CSO). IR image sets (TI 153 – 2035 ms; 2.3 s temporal resolution, 90-100 image sets total) were obtained before, during, and after injection of 0.4- 0.5 mmol/kg Gadoteridol (ProHance; Bracco Diagnostics, Cranberry, NJ) into the antecubital vein. R1 (≡1/T1) values were calculated on a voxel-by-voxel basis for each IR image set. WM tissue segmentation was achieved via bimodal Gaussian fitting of the pre-contrast R1 (R10) histogram data for each individual.3 Estimates of vb, kpo, intrinsic tissue R1 (R1i; the tissue R1 corrected for contributions from blood), and the capillary permeability-surface area product of water (PwS; ≡ kpo*vb) were calculated for the WM using Shutter-Speed Paradigm (SSP) model.1,2 Age-associated changes in parameters were evaluated using robust linear regression models.4 All statistical analyses were performed using Stata (v 12; Statacorp, College Station, TX). P values were calculated at the 0.05 significance level in two-tailed tests.Results
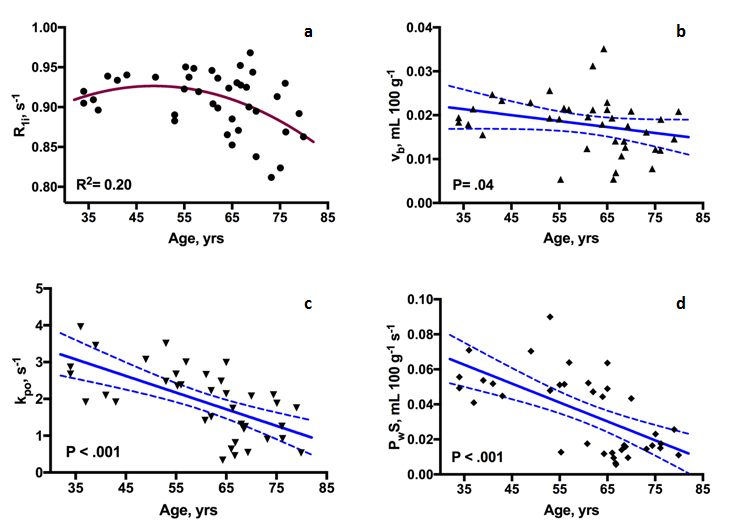
Figure 1 illustrates vascular and tissue response curves during bolus passage (a,b). The nonlinear relationship between R1t (WM tissue R1) and R1b (R1 in the blood, taken from a single voxel in the sagittal sinus) is evident (panel c; solid curve is the SSP fit to the data). Pre-contrast R1 map and WM segmentation mask for the subject are shown in panel d. Plots for each parameter of interest against age are shown in Figure 2. R1i decreases at a rate of 0.04% per decade among all participants, although the rate of decline is not linearly associated with age over the entire age range (p= .36), appearing to decline faster among older (> 60 yrs) individuals (panel a). A similar non-linear relationship has been reported in humans5 and non-human primates6 and may reflect acceleration of heterogeneous aging processes in the later decades. In contrast, declines in vb (-0.13 mL 100 g-1 per decade), kpo (-0.45 s-1 per decade), and PwS (-0.01 mL 100 g-1 s-1 per decade) were significant over the entire age range.Discussion
In the aging WM where capillary morphology is relatively intact, the rate of CR leakage is small and the temporal signature of R1 values can be significantly influenced by transendothelial 1H2O exchange processes.7,8 Under these conditions, fitting the changes in 1H2O R1 values to a two-compartment (intravascular and parenchymal) model that explicitly accounts for transendothelial water exchange is most reasonable. The resulting pharmacokinetic parameters (vb, kpo, and PwS) provide quantitative estimates of BBB water permeability. Since changes in BBB permeability to water and other small molecules are likely to precede the leakage of CR and larger macromolecules,9 such estimates represent particularly important probes of the subtle BBB abnormalities that are likely to accompany healthy brain aging. Our results confirm a linear decline in WM vb with age, consistent with previous PET10,11 and DSC-MRI12 findings, and a pronounced decrease in kpo. Unlike vb, which varies with vascular density, kpo depends primarily on vessel diameter and the activity of systems that drive water transport across the endothelium. It is possible that the changes in WM kpo that we observe reflect an age-related disturbance in ion transport processes that are coupled to water cycling and regulation of brain water homeostasis at the capillary endothelium.Acknowledgements
Support from Conrad N. Hilton Foundation; NIH AG 033638, 046626, AG 008017, OD018224; NMSS FG-16-7-25259References
1. Rooney, W. D. et al. Mapping human brain capillary water lifetime: high-resolution metabolic neuroimaging. NMR Biomed. (2015). doi:10.1002/nbm.3294
2. Tagge, I. et al. High Spatial Resolution Mapping of Trans-Capillary Water Exchange in Progressive Multiple Sclerosis. in Proc Int Soc Magn Reson Med 220 (2017).
3. Rooney, W. D. et al. Magnetic field and tissue dependencies of human brain longitudinal 1H2O relaxation in vivo. Magn Reson Med 57, 308–318 (2007).
4. Verardi, V. & Croux, C. Robust regression in Stata. Available at SSRN. Stata J. 9, 1369144. (2008).
5. Cho, S., Jones, D., Reddick, W. E., Ogg, R. J. & Grant Steen, R. ESTABLISHING NORMS FOR AGE-RELATED CHANGES IN PROTON Tl OF HUMAN BRAIN TISSUE IN VIVO. Orig. Contrib. Magn. Reson. Imaging 15, 1133–143 (1997).
6. Njus, J. et al. Quantitative Relaxographic Assessment of Age Related Changes in Non-Human Primate Brain. in Proceedings 17th Scientific Meeting, International Society for Magnetic Resonance in Medicine 17, 3240 (2009).
7. Larsson, H. B., Rosenbaum, S. & Fritz-Hansen, T. Quantification of the effect of water exchange in dynamic contrast MRI perfusion measurements in the brain and heart. Magn Reson Med 46, 272–281 (2001).
8. Li, X., Rooney, W. D. & Springer Jr., C. S. A unified magnetic resonance imaging pharmacokinetic theory: intravascular and extracellular contrast reagents. Magn Reson Med 54, 1351–9. [Erratum: Magn Reson Med 2006;55:1217.] (2005).
9. Schwarzbauer, C. et al. Quantitative magnetic resonance imaging of capillary water permeability and regional blood volume with an intravascular {MR} contrast agent. Magn Reson Med 37, 769–777 (1997). 10. Leenders, K. L. et al. Cerebral blood flow, blood volume and oxygen utilization: Normal values and effect of age. Brain 113, 27–47 (1990).
11. Marchal, G. et al. Regional cerebral oxygen consumption, blood flow, and blood volume in healthy human aging. Arch Neurol 49, 1013–1020 (1992).
12. Wenz, F. et al. Age dependency of the regional cerebral blood volume (rCBV) measured with dynamic susceptibility contrast MR imaging (DSC). Magn. Reson. Imaging 14, 157–162 (1996).
Figures