2062
Linking neurotransmitter concentration and functional connectivity of the hippocampus after stress: an in-vivo MRI study1Life and Health Sciences Institute, ICVS, School of Medicine, Universidade do Minho, Braga, Portugal, 2ICVS/3B's - PT Government Associate laboratory, Braga/Guimaraes, Portugal, 3Physiopathologie des Maladies Psychiatriques, UMR_S 894 Inserm, Paris, France, 4Univ. Paris Descartes, Paris, France, 5Neurospin, JOLIOT, CEA, Paris, France
Synopsis
Stress is a potent modulator of brain metabolism and function. Here we use a combined approach of blood corticosterone quantification, nuclear magnetic resonance spectroscopy and resting state functional magnetic resonance imaging to probe both metabolic and functional changes in the brain. We show correlations in the concentration of GABA/Glutamine and Glutamate/Glutamine in the hippocampus and how these two factors interact with the response to stress. Furthermore we explore how the changes in neurotransmitters correlate with functional networks, revealing several affected connections especially with the retrosplenial cortex, therefore suggesting a role of this relationship in the affected memory phenotype.
Introduction
Stress is a well-established modulator of the brain metabolism and function with several dimensions of behaviour, as well as neurotransmission being altered1. Here we reveal for the first time, in a rat model of stress, associations between neurotransmitters (GABA and Glutamate) concentration and resting state functional connectivity of the dorsal hippocampus, measured in vivo at 11.7T, and blood serum corticosterone levels.Methods
25 Wistar rats (8 weeks old) were exposed to a Chronic Unpredictable stress paradigm2 during three weeks. During the same period a set of 15 control rats with matching age was handled daily. Blood samples were collected on the last day before MRI session for corticosterone assessment using ELISA.
MRI scans were performed on an 11.7T Bruker BioSpec scanner using a 72mm volume resonator for transmission and a 4-channels surface coil for reception. Prior to scan the animals were anesthetized with 4% isoflurane and kept at 2% once moved inside the scanner. Body temperature and breathing rate were monitored and kept stable. Two MRI datasets were acquired: i) one resting state functional dataset (rs-fMRI) using a spin-echo echo planar imaging sequence with TR=2000ms, TE=17.5ms and 450 repetitions (during this acquisition isoflurane level was lowered to keep the breathing rate between 65 and 75 bpm); ii) one spectroscopy dataset using a LASER3 sequence with TR=3500ms, TE=25ms, 128 averages, 2048 points, on a 18 μL ROI placed over the right dorsal hippocampus (for this acquisition water suppression was done using VAPOR4).
Rs-fMRI data pre-processing was done using FSL5 and included slice timing, movement correction, co-registration to a common reference space, artefact correction, spatial smoothing and band pass filtering. Functional Connectivity (FC) was determined, by calculating the Pearson correlation coefficient between the hippocampus and all other 56 areas of a homemade atlas, for 33 animals (19 stressed and 14 controls) for which the data quality was deemed appropriate. The spectra of these animals were analysed using the LCModel6. Total Creatine (tCr) concentration was used as the internal reference signal for determining the metabolites concentration. Calculating the ratio to the Glutamine precursor molecule further controlled GABA and Glutamate concentrations (GABA/Gln and Glu/Gln). Statistical analysis was conducted using the General Linear Model, using a first model to test the association between GABA/Gln and Glu/Gln with the blood concentration of corticosterone and second with each functional connection of the bilateral hippocampus.
Results
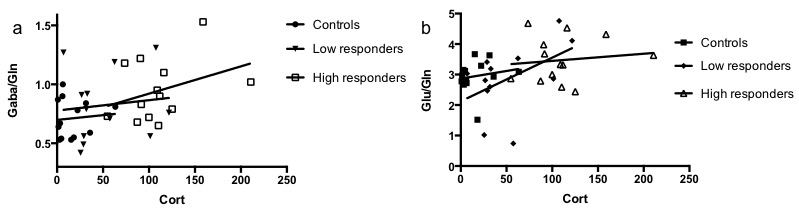
Figure 1 shows how the location of the voxel for the spectroscopy acquisition was determined. Significant positive associations between the levels of corticosterone and GABA/Gln (p=0.0095) and Glu/Gln (p=0.0145) were found. Grouping the animals according to their response to stress allowed us to further reveal how in susceptible animals the association is stronger with GABA/Gln, and in resilient animals with Glu/Gln (Figure 2).
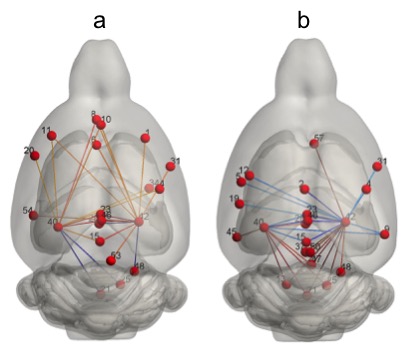
Several significant associations (p<0.05) between functional connectivity of the hippocampus with several brain regions and the concentration of GABA/Gln (Figure 3a) and Glu/Gln (Figure 3b) were found. The stronger associations were found with the retrosplenial cortex (zone 23, p=0.0001; 46, p=0.001; and 15, p=0.005) and prelimbic cortex (zone 8, p=0.006) for the GABA/Gln ratio, and again the retrosplenial cortex (zone 23, p<0.0001; 46, p<0.002; and 15, p=0.004), cingulate cortex (zone 2, p=0.001), nucleus accumbens (zone 57, p<0.0001) and the raphe nucleus (zone 21, p=0.001) for the Glu/Gln ratio. Importantly, strong positive associations were found with anterior cortical areas and negative with posterior areas for GABA/Gln and the opposite for the Glu/Gln ratio.
Discussion – Conclusion
Here we first revealed how the concentrations of GABA and Glu are associated with corticosterone level, a key marker of stress. Furthermore we explored for the first time the association between the effect of stress, concentration of neurotransmitters in the hippocampus and the associated functional connectivity. Several relevant associations were found but the clearest one was in the connection to the retrosplenial cortex. This connection is thought to be key in the formation of memories7, which is known to be affected under stress. Our results therefore suggest a role of the glutamatergic and gabaergic systems in the development of the stressed phenotype. Furthermore we also reveal possible interesting interactions between the concentrations of neurotransmitters and the synchronization of key areas of stress such as the pre-frontal cortex (in the cingulum) and the nucleus accumbens.Acknowledgements
This work is part of the Sigma project with the reference FCT-ANR/NEU-OSD/ 0258/2012 co-financed by the French public funding agency ANR (Agence National 8 pour la Recherche, APP Blanc International II 2012), the Portuguese FCT (Fundação para a Ciência e Tecnologia) and by the Portuguese North Regional Operational Program (ON.2 – O Novo Norte) under the National Strategic Reference Framework (QREN), through the European Regional Development Fund (FEDER) as well as the Projecto Estratégico co-funded by FCT (PEst-C/SAU/LA0026-/2013) and the European Regional Development Fund COMPETE (FCOMP-01-0124-FEDER-037298). DAB and AN were funded by grants from FCT-ANR/NEU-OSD/0258/2012. RM is supported by the FCT fellowship grant with the reference PDE/BDE/113604/2015 from the PhD- iHES program; AC was supported by a grant from the fondation NRJ. PM was funded by Fundação Calouste Gulbenkian (Portugal; ‘Better mental health during ageing based on temporal prediction of individual brain ageing trajectories (TEMPO)’), Grant Number P-139977.References
1. McEwen BS. The neurobiology of stress: from serendipity to clinical relevance. Brain Res 2000; 886(1–2):172-189.
2. Cerqueira JJ, Mailliet F, Almeida OF, Jay TM, et al. The prefrontal cortex as a key target of the maladaptive response to stress. J Neurosci 2007; 27(11): 2781-2787.
3. Garwood M, DelaBarre L. The return of the frequency sweep: designing adiabatic pulses for contemporary NMR. J Magn Reson 2001; 153(2): 155-177.
4. Tkáč I, Starčuk Z, Choi IY, Gruetter R. In vivo 1H NMR spectroscopy of rat brain at 1 ms echo time. Magn Reson Med 1999; 41(4): 649-656.
5. Jenkinson M, Beckmann CF, Behrens TE, Woolrich MW, et al. FSL. Neuroimage 2012; 62(2): 782-790.
6. Provencher SW. Estimation of metabolite concentrations from localized in vivo proton NMR spectra. Magn Reson Med 1993; 30(6): 672-679.
7. Wyss JM, Van Groen T. Connections between the retrosplenial cortex and the hippocampal formation in the rat: a review. Hippocampus 1992; 2(1): 1-11.
Figures