2060
Prognostic value of phase images of 2D T2*-weighted GRE in cardiac arrest survivors: A pilot study1Radiology, Seoul St. Mary's hospital, College of Medicine, The Catholic University of Korea, Seoul, Republic of Korea, 2Emergency Medicine, Seoul St. Mary's hospital, College of Medicine, The Catholic University of Korea, Seoul, Republic of Korea
Synopsis
Because hypoxic ischemic injury of the brain occurs in cardiac arrest survivors, assessment of oxygen metabolism could be useful. In this work, we analyzed filtered phase images of 2D T2*-weighed gradient echo images in them. Three survivors with good neurologic outcome showed normal pattern of cortical and deep veins, as well as dural sinuses. However, patients with poor outcome showed two abnormal pattern of venous structures on filtered phase images; (1) attenuated contrast of venous structures and (2) strong and exaggerated venous contrast. Filtered phase images of 2D T2*-weighed gradient echo might useful to predict prognosis of cardiac arrest survivors.
Introduction
Since therapeutic hypothermia improved the neurologic outcome of cardiac arrest survivors (CAS), predicting prognosis of those patients is still challenging.1 Because brain is metabolically active and highly sensitive to hypoxia accompanied by cardiac arrest, those patients demonstrated a variety of extent of hypoxic-ischemic brain injury. Previous studies evaluated the extent of (cytotoxic) edematous changes associated with hypoxic-ischemic brain injury on T2-weighted images or diffusion-weighted images (DWI).2,3
A recent report suggested the estimation of oxygen metabolism of the brain using phase contrast of gradient echo imaging was clinically useful.4 In this study, we applied this MR imaging to CAS. We used phase images of clinical-routine 2D T2*-weighted gradient echo (GRE) images. While dedicated MR sequences and hardware those were not clinically suitable for comatose CAS, 2D T2*-weighted GRE is widely used and clinically useful, because of very short acquisition time and high sensitivity of hemorrhage.5 The purpose of this study was to investigate the clinical feasibility of phase information to reveal the abnormal brain oxygen metabolism in CAS patients, and their prognostic value.
Methods
Subjects
From 2016 June to 2017 September, 20 CAS were performed MRI during their management. After recovery of spontaneous cardiac rhythm, standard 24-hour hypothermia were applied. MRI was done in 48~72 hours after cardiac arrest, to assess the brain damage of CAS. Among them, patients were excluded according to following criteria; (a) too long (>72 hours) interval between cardiac arrest time and MR imaging (n=1) or (b) loss of phase data of 2D T2*-weighted GRE (n=3). Finally, 17 CAS were included (Figure 1).
MR imaging
All MR images were obtained from a 3T MR unit (MAGNETOM Verio, Siemens AG, Healthcare Sector, Erlangen, Germany) with a 12-channel receive coil. Standard MR protocols for those patients included 2D T2-weighted TSE images, 2D T2*-weighted GRE images, 2D DWI. Acquisition parameters follows: TR/TE 700/20 msec, FA 20°, voxel size 0.43 x 0.43 mm, slice thickness = 5 mm, interslice gap = 1mm.
Evaluation of MR images
We hypothesized that phase images of 2D T2*-weighted GRE could demonstrate the abnormal oxygen metabolism of the brain of CAS. Because currently used 2D T2*-weighted GRE were not enough for the dipole inversion processing for quantitative susceptibility mapping, visual inspection of high-pass filtered phase images was performed. Homodyne filtering was applied to remove the unwanted background phase mainly induced by air/tissue boundaries or system imperfections. To define normal appearance of brain venous system on filtered phase images of GRE, two radiologists reviewed filtered phase images of 10 control subjects. After that, two radiologists reviewed the magnitude and filtered phase images of CAS and found abnormal venous structures. Also, we used T2-weighted TSE for the evaluation of brain damage. After that, prognostic value of those abnormalities was assessed.
Results
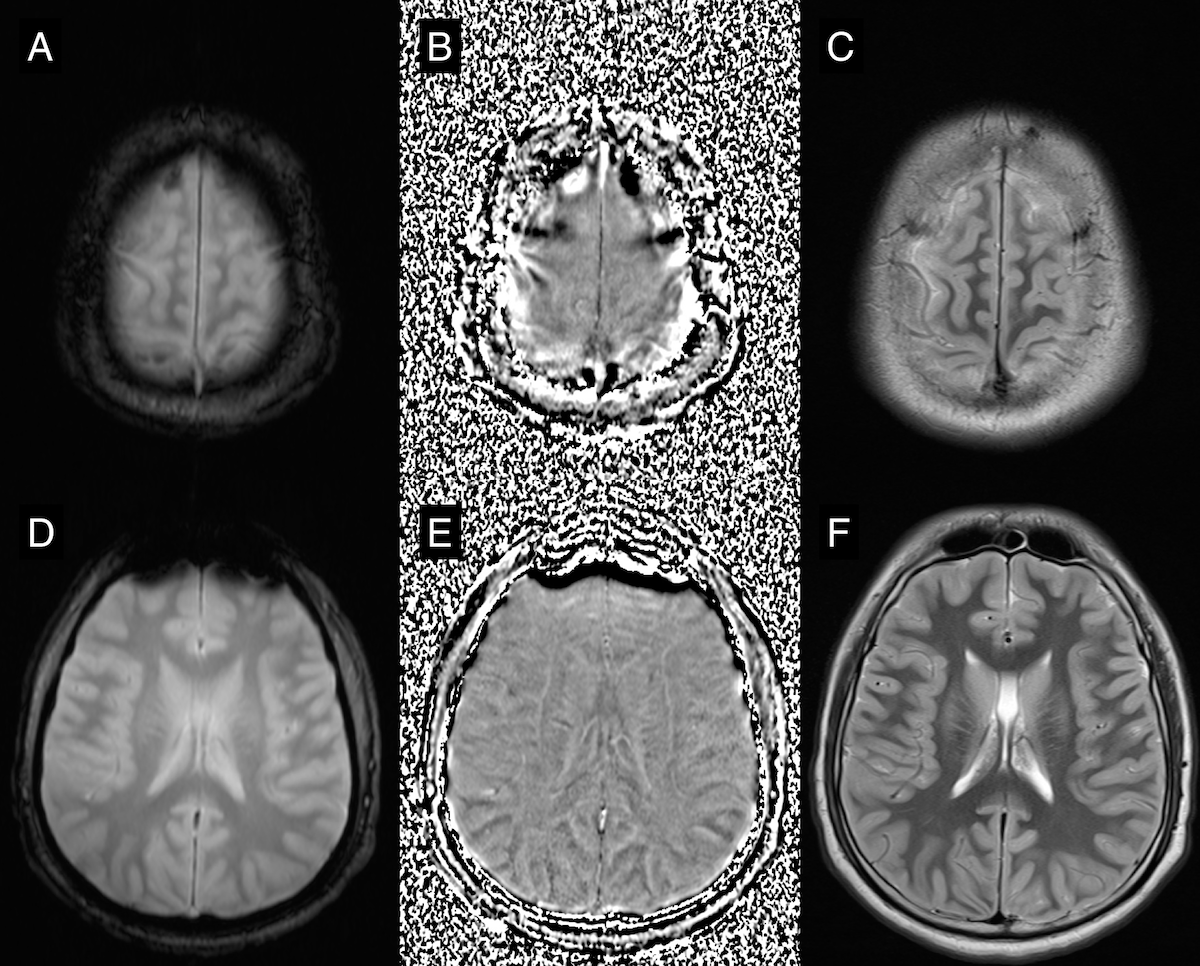
On filtered phase images of T2*-weighted GRE, dural sinus were hyperintense, reflecting paramagnetic deoxyhemoglobin. Cortical and deep veins were more cleared delineated on filtered phase images as compared with magnitude images (Figure 2).
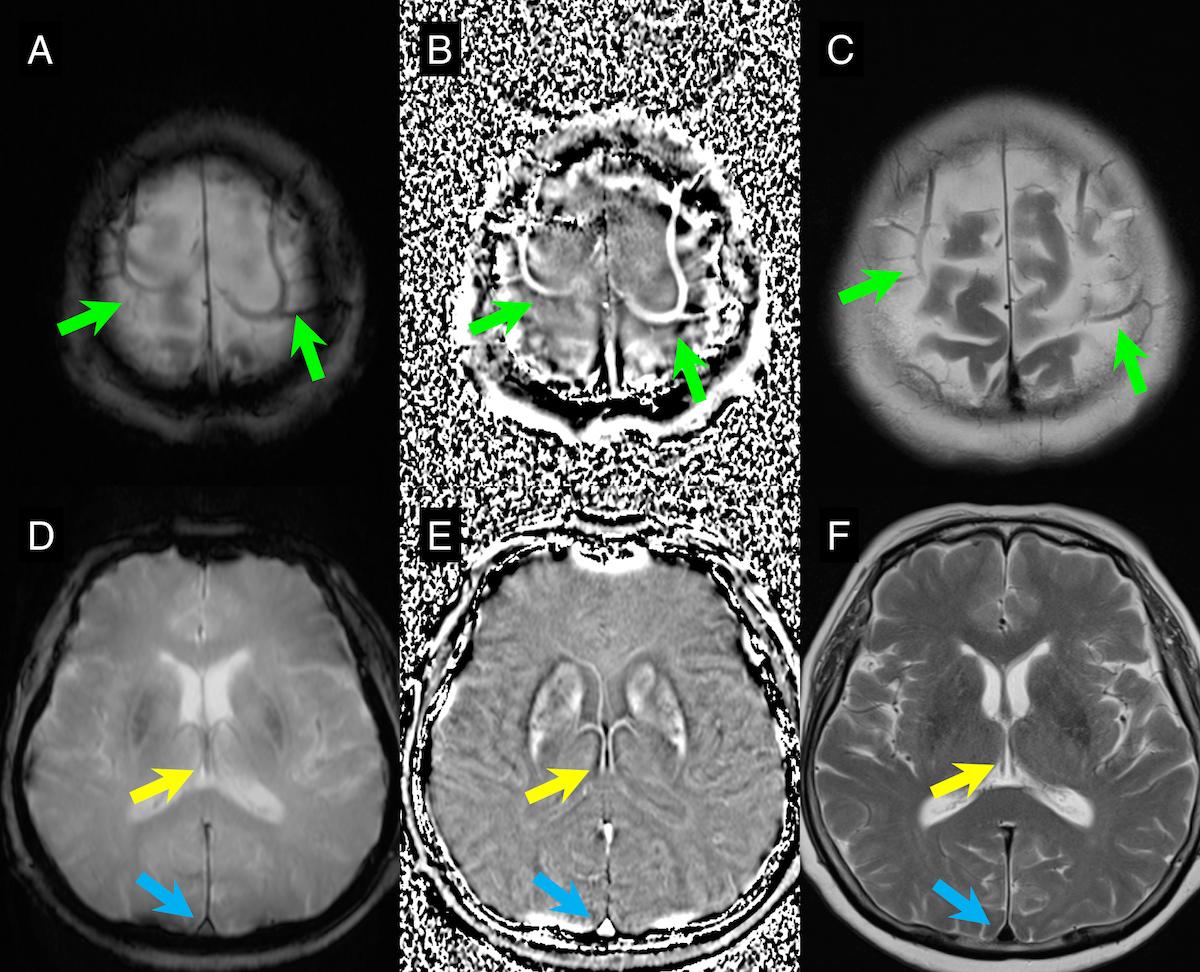
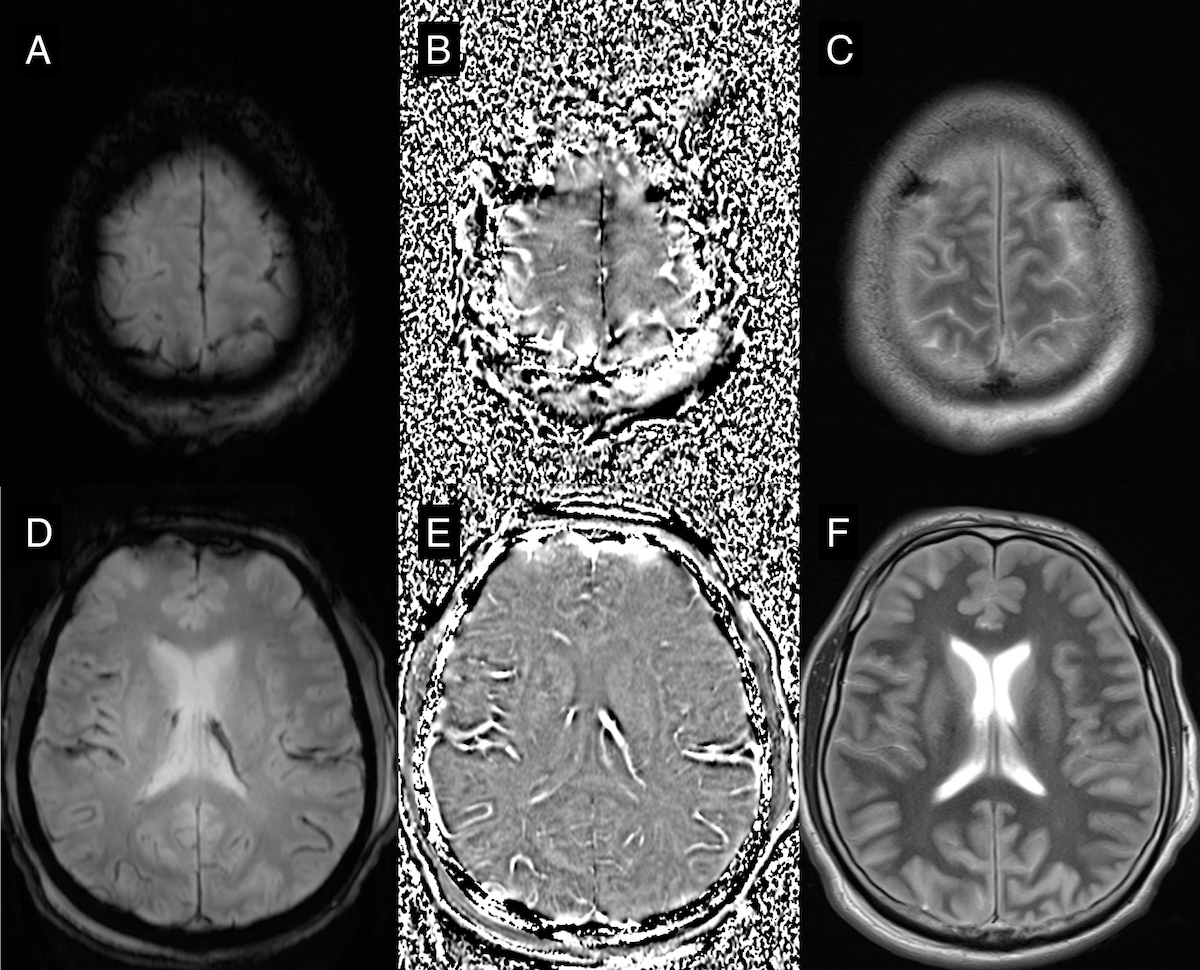
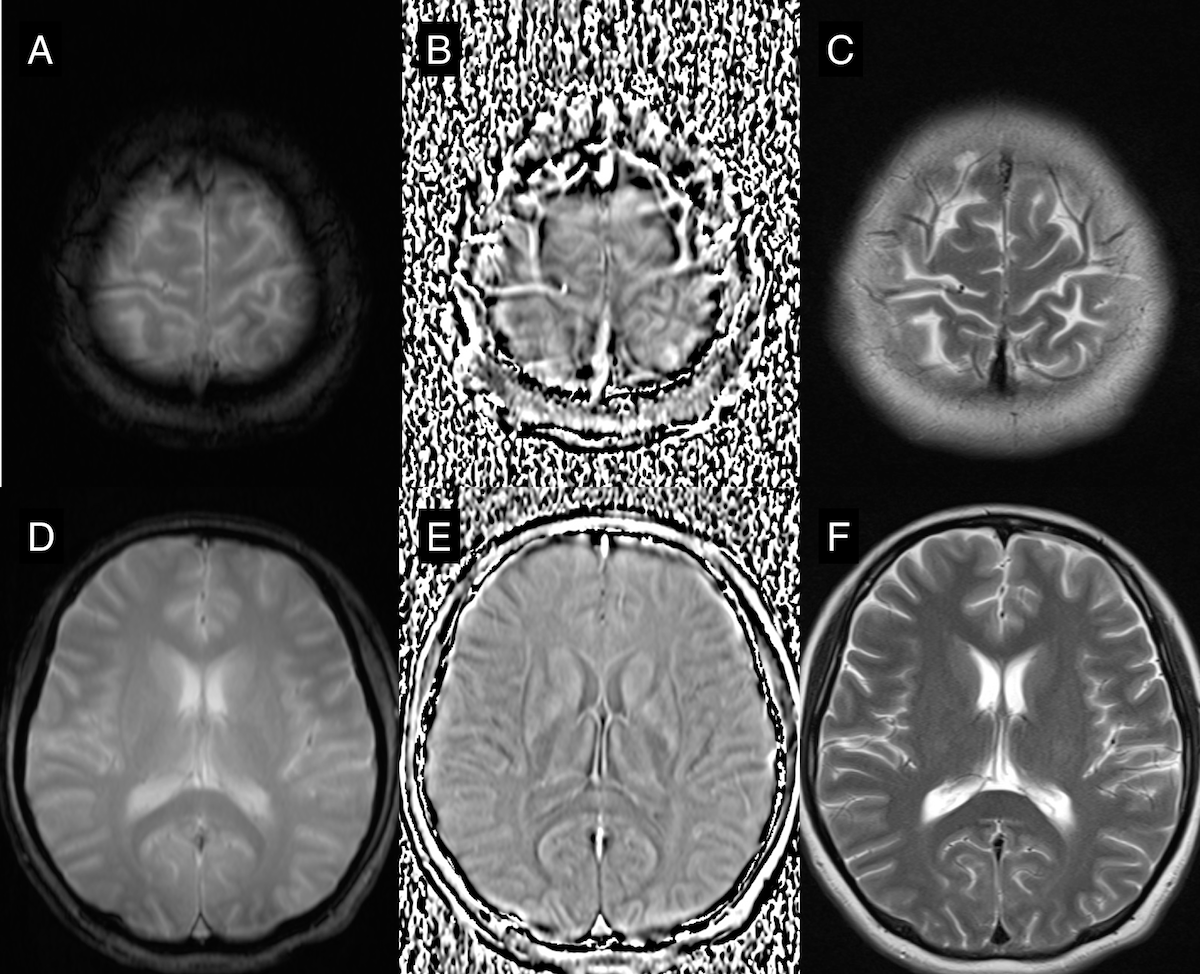
Among 17 CAS, 3 patients had good outcome, and 14 patients had poor prognosis (Figure 1). Filtered phase image of all 14 poor outcome patients showed different contrast of venous structures from control subjects. Eleven patients showed low phase value of cortical and deep veins, as well as dural sinuses (Figure 3). Among them, two subjects showed no T2 hyperintense or edema lesion. Three CAS with poor outcome showed strong and accentuated venous structures on filtered phase (Figure 4). All of them showed diffuse T2 hyperintense changes in the brain. All 3 good-outcome subjects showed normal venous pattern on filtered phase (Figure 5). Filtered phase venous abnormality and T2 brain parenchymal abnormality were both significantly different between good and poor outcome CAS (Figure 1, P<0.05).
Discussion and conclusion
Decreased venous paramagnetism might be due to decreased deoxyhemoglobin in venous blood, suggesting possibility of decreased oxygen extraction fraction (OEF) in CAS. Our result is concordant with previous studies, revealing decreased OEF in the brain of CAS. An animal study using positron emission tomography suggested the decreased OEF in pig model after recovery from cardiac arrest.6 Another study using blood sampling suggested decreased oxygen extraction fraction in CAS, which was more profound in poor outcome subjects.7 One interesting finding is the strongly paramagnetic venous structures in three CAS with poor outcome. In those patients, T2-weighted images showed extensive brain edema. In that case, increased intracranial pressure and decreased cerebral perfusion pressure might result increased OEF.
In conclusion, we demonstrated abnormal findings of filtered phase images of 2D T2*-weighted GRE in CAS. It has potential prognostic value for prediction of CAS outcome.
Acknowledgements
No acknowledgement found.References
1. Oh SH, Park KN, Shon YM, et al. Continuous Amplitude-Integrated Electroencephalographic Monitoring Is a Useful Prognostic Tool for Hypothermia-Treated Cardiac Arrest Patients. Circulation 2015;132:1094-103
2. Wu O, Sorensen AG, Benner T, et al. Comatose patients with cardiac arrest: predicting clinical outcome with diffusion-weighted MR imaging. Radiology 2009;252:173-81
3. Wijman CA, Mlynash M, Caulfield AF, et al. Prognostic value of brain diffusion-weighted imaging after cardiac arrest. Ann Neurol 2009;65:394-402
4. Rodgers ZB, Leinwand SE, Keenan BT, et al. Cerebral metabolic rate of oxygen in obstructive sleep apnea at rest and in response to breath-hold challenge. J Cereb Blood Flow Metab 2016;36:755-67
5. Markl M, Leupold J. Gradient echo imaging. J Magn Reson Imaging 2012;35:1274-89
6. Mortberg E, Cumming P, Wiklund L, et al. Cerebral metabolic rate of oxygen (CMRO2) in pig brain determined by PET after resuscitation from cardiac arrest. Resuscitation 2009;80:701-6
7. Hoedemaekers CW, Ainslie PN, Hinssen S, et al. Low cerebral blood flow after cardiac arrest is not associated with anaerobic cerebral metabolism. Resuscitation 2017;120:45-50
Figures