2059
Impact of coregistration approaches on the reliability of R2* and Quantitative Susceptibility Maps (QSM) at 7 TSeongjin Choi1, Xu Li2,3, and Daniel M Harrison1
1Department of Neurology, University of Maryland Baltimore, Baltimore, MD, United States, 2Department of Radiology and Radiological Science, Johns Hopkins University, Baltimore, MD, United States, 3F.M. Kirby Research Center for Functional Brain Imaging, Kennedy Krieger Institute, Baltimore, MD, United States
Synopsis
We assessed the unexplored reliabilities of QSM and R2* map acquired at 7 T by two different approaches that are 1) a direct coregistration of the quantitative maps from their native to a reference space and 2) processing the quantitative maps in a transformed space. R2* was reliable in both methods in the pixel value and the group-mean analyses. However, QSM was less reliable when it was processed in a transformed space in both analyses. Therefore, QSM is recommended to be calculated in its native space prior to any coregistration in a multi-modal study.
Introduction
While image coregistration is inevitable and various quantitative parametric maps, such as R2* map and QSM, are increasingly used in multi-parametric studies of the brain, there is a lack of investigations on the reliability of the calculated quantitative metrics after image coregistration. There are a limited number of previous studies investigating the reproducibility of QSM.1-3 However, none of these studies investigated the influence of co-registration of source GRE images to a reference space on the resultant R2* map and QSM. Moreover, although R2* map and QSM at ultra-high field have been promising in the investigation of neurological disorders, such as multiple sclerosis4, 5, the reliability of R2* map and QSM were never assessed. Therefore, it would be worthwhile to investigate whether the quantitative maps calculated in its native space would be consistent with those calculated using the transformed source image as well as directly transformed quantitative maps. In this study, we investigated the influence of two different coregistration approaches on R2* and magnetic susceptibility at ultra-high field (7 T).Methods
Eight healthy participants were scanned using 7T Achieva MR scanner (Philips, Cleveland, OH, USA), a volume transmit coil, and a 32-channel receive coil (Nova Medical, MA, USA). MRI protocol consisted of a magnetization prepared rapid acquisition gradient echo sequence (MPRAGE, TR/TE = 4.1/1.83 ms, sagittal acquisition, FOV = 180×220×220 mm3, image matrix = 180×220×220, flip angle = 7 degrees, TFE factor = 352, SENSE factor = 2×1×2, scan time = 2 min 20 s) and a multi-echo 3D gradient-recalled echo sequence (GRE, TR/TE1/∆TE = 68/4/2 ms, 8 echoes, axial acquisition, FOV = 220×220×110 mm3, image matrix = 224×224×110) with both magnitude and phase components. To avoid inconsistency in ROI delineation, we used four structures (caudate nucleus, globus pallidus, putamen, thalamus) obtained from Harvard-Oxford atlas available in FSL. These labels were further processed to collect quantitative metrics in MPRAGE and GRE spaces of each participant using FSL. R2* map was calculated by curve fitting of multi-echo magnitude images to a mono-exponential model.6 QSM was reconstructed by Structural Feature-based Collaborative Reconstruction (SFCR) algorithm.7 We assessed the reliability of R2* and QSM by comparing metrics obtained in eight structures at pixel and group levels for two different approaches. One approach was processing them in a transformed (MPRAGE) space, and the other was coregistration of the resultant quantitative map directly to MPRAGE space. Coregistration was performed by FSL with options of rigid body transformation, spline interpolation, and mutual information cost function. Pixel level assessments were performed by comparing distribution profiles using the Two-sample Kolmogorov-Smirnov Test (KS-test) and by comparing pixel values (PVs) using the Mann-Whitney U Test (U-test). Group-level assessment was performed by comparing group-mean values using the Paired t-test.Results
KS-test and U-test results revealed that R2* distributions and PVs remained statistically invariant after either GRE data coregistration (p > 0.05) or direct R2* map coregistration to MPRAGE space (p > 0.05) respectively. However, QSM distributions were altered (p < 0.05 in 58 out of 64 (8 labels x 8 participants) KS-tests) and PVs were altered (p < 0.05 in 58 out of 64 U-tests) when it was processed in the transformed space, whereas the distributions remained statistically invariant (p > 0.05) in all KS-tests and PVs were only different in 2 out of 64 U-tests for the coregistration of resultant QSM to MPRAGE space.Figure1 Paired t-test, to compare group mean R2* and susceptibility values within 8 labels over 8 participants, revealed that mean R2* were invariant (p > 0.05) to both coregistration approaches, while mean susceptibility was invariant (p > 0.05) to direct coregistration but differ (p < 0.05) in one label when it was processed in the transformed space.Figure2Discussion
R2* was robust to both coregistration approaches. This could be due to the pixel-wise calculation of R2* maps, hence, less vulnerable to small differences in magnitude intensities. In general, QSM was not reliable at pixel level when it was processed in a non-native space and more reliable when it was calculated in its native space and then transformed to MPRAGE space. Group-mean susceptibility was more reliable compared to pixel level analysis. This could be due to the fact that QSM is calculated from MR phase measurements through multiple processing steps and thus affected by the coregistration to a larger extent.Conclusion
R2* could be safely processed in a transformed space, whereas QSM was less reliable when it was processed in the transformed space. Hence, caution is advised when using QSM in a multi-modal study, and it is strongly recommended to process QSM in its native space prior to any coregistrations.Acknowledgements
We would like to thank the MRI technologists and staff at the Kirby Center, without whom imaging research like this would not be possible. We also would like to thank study coordinators Julie Fiol and Kerry Naunton, who helped organize participants study visits.References
- Hinoda T, Fushimi Y, Okada T, et al. Quantitative Susceptibility Mapping at 3 T and 1.5 T: Evaluation of Consistency and Reproducibility. Invest Radiol. 2015;50:522-530.
- Deh K, Nguyen TD, Eskreis-Winkler S, et al. Reproducibility of quantitative susceptibility mapping in the brain at two field strengths from two vendors. JMRI. 2015;42:1592-1600
- Santin MD, Didier M, Valabregue R, et al. Reproducibility of R2 * and quantitative susceptibility mapping (QSM) reconstruction methods in the basal ganglia of healthy subjects. NMR Biomed. 2017;30
- Harrison D, Oh J, Roy S, et al. Thalamic lesions in multiple sclerosis by 7 T MRI: Clinical implications and relationship to cortical pathology. MSJ. 2015;21(9):1139-1150
- Li X, Harrison DM, Liu H, et al. Magnetic susceptibility contrast variations in multiple sclerosis lesions. JMRI. 2016;43:463-473.
- Miller AJ, Joseph PM. The Use of Power Images to Perform Quantitative-Analysis on Low SNR MR-Images. MRI. 1993;11:1051-1056
- Bao L, Li X, Cai C, et al. Quantitative Susceptibility Mapping using Structural Feature based Collaborative Reconstruction (SFCR) in the Human Brain.2016;35(9):20140-2050
Figures
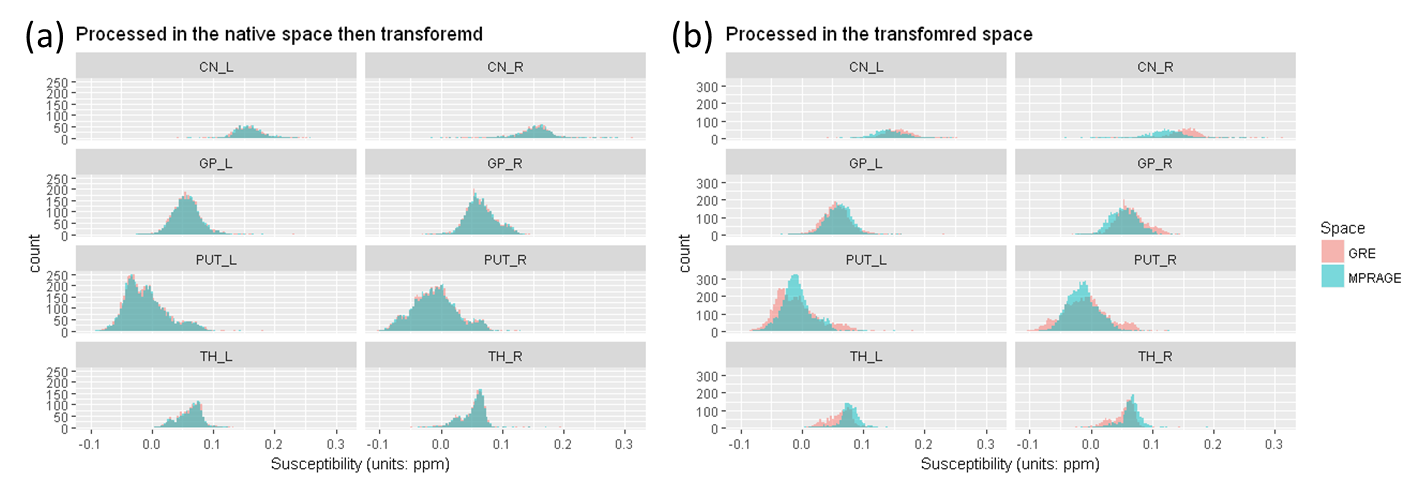
Figure1: Comparison of distributions of QSM processed with two different coregistration approaches in one representative participant. (a) QSM within 8 structural labels was processed in its native, GRE, space (red in both (a) and (b)) then transformed to MPRAGE space (in blue). Distributions and PVs were well matched. (b) QSM was processed in a transformed, MPRAGE, space (in blue). Distributions and PVs were significantly altered.
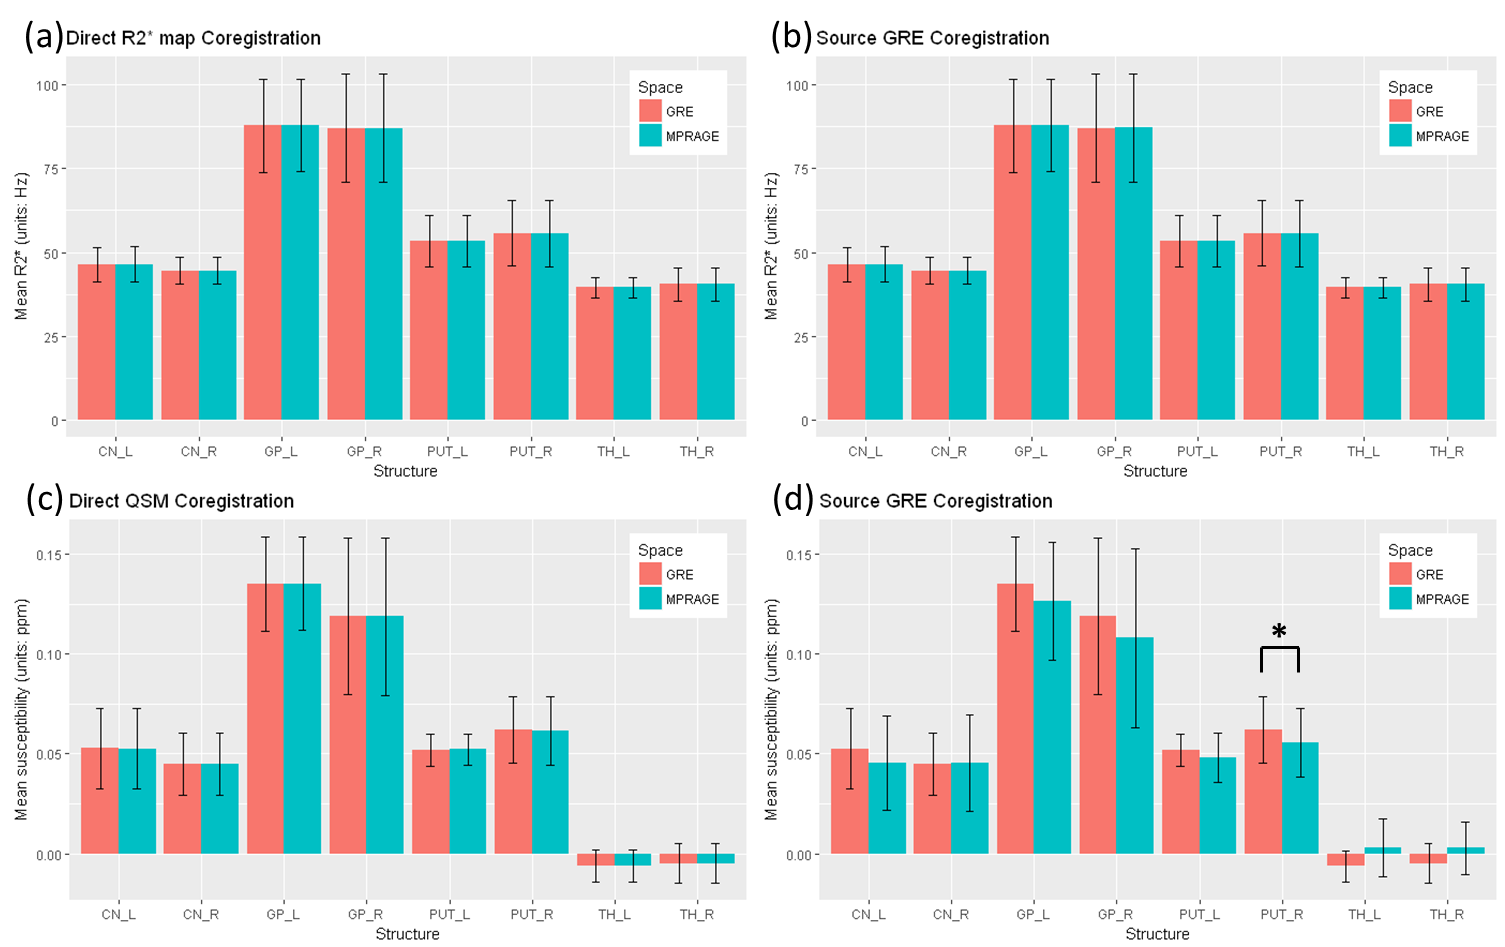
Figure2: Comparison of mean values of R2* and susceptibility in 8 structural labels over 8 participants. (a) Mean R2* values were reliable to direct coregistration and (b) source GRE image coregistration in all 8 structural labels. While (c) QSM was reliable to the direct coregistration, (d) it was less reliable to the coregistration of its source image coregistration. Mean R2* values agree well in it native and transformed spaces. QSM values showed differences when it was processed in the transformed space, although the most of the differences were statistically insignificant. In one structure (PUT_R), we observed a significant difference (d).