2057
Identification of thalamic substructures in ultra-high b-value DWI1Department for Neuroradiology, University Hospital of Tuebingen, Tuebingen, Germany
Synopsis
Precise implantation of deep brain stimulation devices in Parkinson, primary dystonia or epilepsy patients requires precise structural information about the thalamic region. Purpose of this study was to evaluate the capability of DWI in identifying thalamic substructures. Eight healthy volunteers underwent ultra-high b-value DWI (5000 s/mm2) at 3T. Images were denoised using total generalized variation and 7 substructures (Pulvinar and six nuclei) within the thalamus were drawn in and compared to histological atlases. In all volunteers, all seven structures could be identified due to signal intensities. High b-value diffusion weighted imaging therefore shows great potential in determining thalamic substructures.
Introduction
In recent years, deep brain stimulation (DBS) was discovered for treatment of various neurological and psychological diseases. Primarily used in treatment of Parkinson patients, the options nowadays include primary dystonia, epilepsy, depression and others 1,2. New targets, especially different thalamic nuclei, have been identified as target regions for DBS 3. Implantation of modern stimulation devices requires precise structural information of the human brain fitted to patients’ individual anatomy. Planning of DBS implantation is usually performed by conventional MRI- or CT-scans combined with stereotactical anatomical atlases based on post mortem images. Stereotactical data have to be applied to the patients’ brain 4,5. Therefore, it would be helpful and lead to an increased accuracy of DBS implantation to identify intrathalamic substructures, such as the different thalamic nuclei in pre-interventional MR-imaging. Various approaches have been proposed during the last years 6-8.Purpose
To evaluate the capability of ultra-high b-value DWI in separating and identifying intrathalamic substructures and to compare these images with post mortem histological stereotactic atlases of the human brain. Finally, to introduce a measurement protocol that could allow the pre-interventional and individual stereotactical planning of DBS implantations.Material and methods
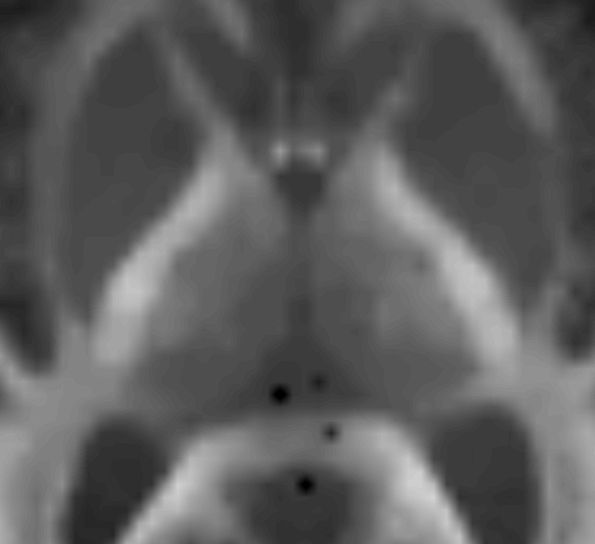
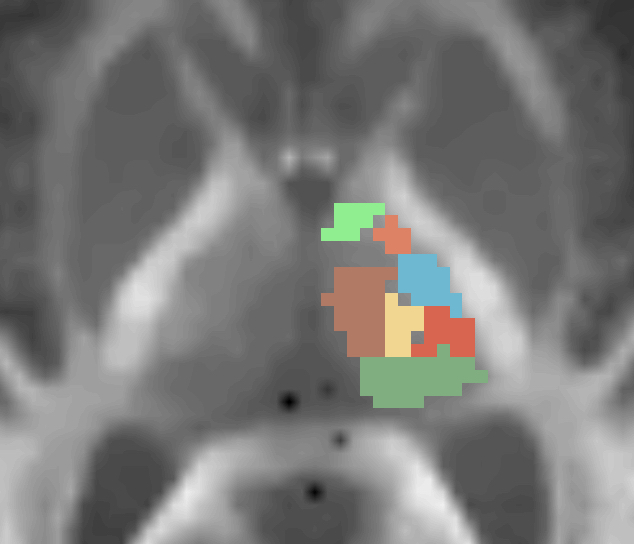
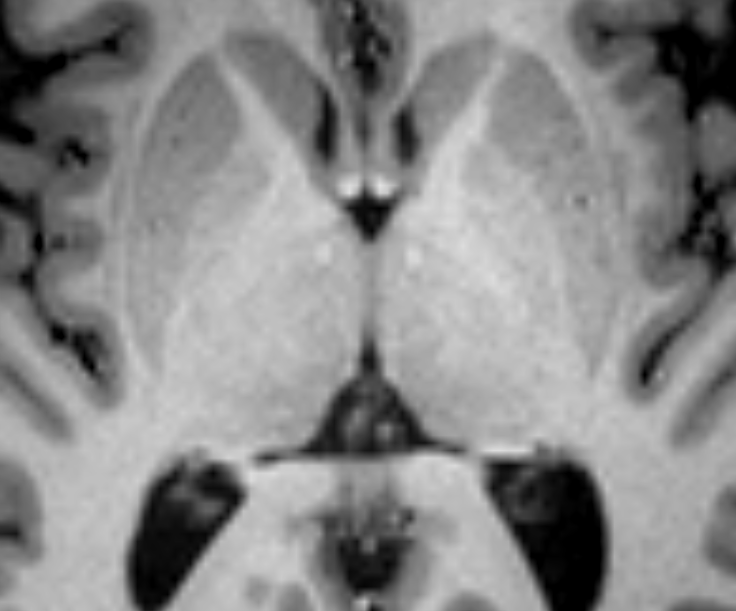
Eight healthy volunteers (mean age: 22.5 years, 4 male, 4 female) were recruited in a prospective MRI-study, approved by the local institutional review board of our university hospital. All subjects provided written informed consent, had to be healthy without any cerebral illnesses or injuries, never underwent surgical intervention in the brain region and didn’t receive steroid therapy at that time. No contrast medium was used. Measurements were performed on a 3T-MRI-scanner (Prisma Fit, Siemens, Erlangen Germany), able to obtain relatively high b-values with acceptable noise and vibration levels. MPRAGE 3D sequence was used to reconstruct anatomically correct images of the test persons’ brain and to plan acquisition of diffusion-weighted images (DWI) in AC/PC orientation. Spin-echo echo-planar imaging DWI sequence with b-values of 0 (b0) and 5000 s/mm2 (b5000) was used and diffusion was encoded in 64 directions. For b0, two and for b5000, five averages were measured. Other imaging parameters were as follows: TR: 3300 ms, TE: 84 ms, FoV: 220x220 mm2, slice thickness: 2 mm, slice number: 30. DWI acquisition was focused on the thalamic and subthalamic region. Following to the MRI-Scan, images were denoised using total generalized variation 9. The images were evaluated on a Linux-Fedora-workstation and 7 intrathalamic substructres (Pulvinar, Nuclei centrales, Nucleus medialis, Nuclei ventrointermedii, Nuclei ventrocaudales, Nuclei ventroorales and Nucleus lateropolaris thalami), defined prior to the evaluation, were identified and drawn in by hand in the slice 4 mm above the AC/PC line. Later, the defined substructures were compared to a histological stereotactical atlas of the brain 12.Results
In all volunteers, all seven intrathalamic substrucutres could be identified due to different signal intensities. Nuclei, which were drawn in based on DWI, corresponded very well with the histological data from the atlas 12. In addition, high concordance between the drawn in nuclei in the different subjects could be shown. No movement artefacts were observed and no noise and vibration problems were declared by the patients.Discussion
Various techniques for identification of intrathalamic nuclei have been reported previously 8, 10, 11. Unfortunately, they are often associated with long acquisition time and complicated post-processing procedures. High b-value DWI seems to present a new and simple way to separate different thalamic substructures in pre-interventional MR-imaging. Although, no movement artefacts were observed in healthy subjects, acquisition time (17 minutes) may provide problems when applied in patients. Reduction of measured directions could reduce acquisition time while capability of identification remains consistent.Conclusion
High b-value diffusion weighted imaging shows great potential in determining thalamic substructures. Therefore, as it allows individual mapping of the thalamic nuclei in pre-interventional MRI, it could lead to better planning of DBS implantation in neurological and psychiatric patients. Further investigations, trying to reduce the needed acquisition time, may provide sequences that are more easily applicable to patients.Acknowledgements
Nils Christoph Nuessle was supported by the doctoral scholarship IZKF of the medical faculty of Tuebingen.References
1. Almeida L, Deeb W, Spears C, Opri E, Molina R, Martinez-Ramirez D, et al. Current Practice and the Future of Deep Brain Stimulation Therapy in Parkinson's Disease. Semin Neurol. 2017;37(2):205-14.
2. Deeb W, Giordano JJ, Rossi PJ, Mogilner AY, Gunduz A, Judy JW, et al. Proceedings of the Fourth Annual Deep Brain Stimulation Think Tank: A Review of Emerging Issues and Technologies. Front Integr Neurosci. 2016;10:38.
3. Chen XL, Xiong YY, Xu GL, Liu XF. Deep brain stimulation. Interv Neurol. 2013;1(3-4):200-12.
4. Rasul FT, Bal J, Pereira EA, Tisdall M, Themistocleus M, Haliasos N. Current surgical options for the epileptic patients. Curr Pharm Des. 2017.
5. Ackermans L, Duits A, van der Linden C, Tijssen M, Schruers K, Temel Y, et al. Double-blind clinical trial of thalamic stimulation in patients with Tourette syndrome. Brain. 2011;134(Pt 3):832-44.
6. Bender B, Wagner S, Klose U. Optimized depiction of thalamic substructures with a combination of T1-MPRAGE and phase: MPRAGE. Clin Neuroradiol. 2016.
7. Bender B, Manz C, Korn A, Nagele T, Klose U. Optimized 3D magnetization-prepared rapid acquisition of gradient echo: identification of thalamus substructures at 3T. AJNR Am J Neuroradiol. 2011;32(11):2110-5.
8. Tourdias T, Saranathan M, Levesque IR, Su J, Rutt BK. Visualization of intra-thalamic nuclei with optimized white-matter-nulled MPRAGE at 7T. Neuroimage. 2014;84:534-45.
9. Knoll F, Bredies K, Pock T, Stollberger R. Second order total generalized variation (TGV) for MRI. Magn Reson Med. 2011;65(2):480-91.
10. Deoni SC, Josseau MJ, Rutt BK, Peters TM. Visualization of thalamic nuclei on high resolution, multi-averaged T1 and T2 maps acquired at 1.5 T. Hum Brain Mapp. 2005;25(3):353-9.
11. Gringel T, Schulz-Schaeffer W, Elolf E, Frolich A, Dechent P, Helms G. Optimized high-resolution mapping of magnetization transfer (MT) at 3 Tesla for direct visualization of substructures of the human thalamus in clinically feasible measurement time. J Magn Reson Imaging. 2009;29(6):1285-92.
12. Schaltenbrand G, Wahren W, Atals for Stereotaxy of the human brain, 2. Edition, Thieme, 1977, ISBN: 9783133937023
Figures