2053
Improved Identification of MCI Converters and Non-Converters using Voxel-Based Morphometry and Low-Rank Plus Sparse Matrix Decomposition1Center for Advanced Imaging Innovation and Research (CAI2R), NYU School of Medicine, New York, NY, United States, 2Center for Biomedical Imaging, Department of Radiology, NYU School of Medicine, New York, NY, United States
Synopsis
Early identification of mild cognitive impairment (MCI) patients presents significant challenges due to mild symptoms and low sensitivity of the algorithms proposed for MCI identification. In this study we employed low-rank plus sparse (L+S) matrix decomposition for identifying gray matter volume differences in bilateral hippocampi between MCI patients who converted to Alzheimer’s disease within 18 months and MCI patients who did not. The L+S decomposition identifies features that are common across subjects while minimizing the influence of individual variabilities and outliers. Sensitivity and accuracy are greatly improved and voxel-wise differences that couldn’t be assessed by previous analyses are also identified.
Introduction
Neuroimaging methods for predicting Alzheimer’s disease (AD) have been pursued for years. Many studies reported over 90% accuracy through various imaging modalities and machine learning algorithms.1 On the other hand, detection of MCI, a prodromal stage of AD 2 and a good target for therapeutic interventions, is challenging due to its mild modulation of cognitive function. Consequently, algorithms proposed for MCI identification often suffer from low sensitivity. Here we employ a low-rank plus sparse (L+S) matrix decomposition method 3,4 to reduce individual variability components from modulated gray matter (GM) volume map in MCI patients who converted to AD within 18 months (MCIc) as well as MCI patients who did not (MCInc). We also performed a linear classification on the GM maps before and after decomposition. Voxel-Based Morphometry (VBM) statistical analysis was subsequently performed to assess whether the decomposition improved the effect size for voxel-wise GM volumetric changes associated with MCI.Method
T1-weighted MR images for this study were obtained from the Alzheimer’s disease Neuroimaging Initiative (ADNI) database (http://www.loni.ucla.edu/ADNI), and pre-processed according to their standard protocol.5 We selected the same 76 MCIc and 134 MCInc participants as in Cuingnet et al..6 Each group of subjects were split into two sets of the same size: training set and testing set. The division process preserved the age and sex distribution. Since the MCInc group had more subjects than the MCIc group, we randomly picked the same number of subjects from the MCInc training set to match the MCIc training set, and put the remainder of the subjects into the MCInc testing set to avoid class imbalance across diagnostic groups.
All MR images were spatially normalized using the DARTEL registration algorithm 7 with default parameters. The DARTEL transformations were applied to the GM tissue map, which was segmented using the SPM unified segmentation routine,8 and masked with bilateral hippocampal ROIs from the FSL Harvard-Oxford subcortical atlas.9–12 All maps were modulated to preserve the overall tissue amount. No smoothing was performed at this stage.
The warped GM maps of each group were assembled into a matrix M respectively (rows: voxels in the ROI, columns: subjects). We split each M into multiple patches with 40 rows in each matrix patch. The L+S algorithm decomposed normalized patches into a low-rank matrix L containing common components and a sparse matrix S containing individual variability and outliers. A linear kernel based support vector machine (SVM) classifier implemented by LIBLINEAR package 13 was employed to perform the group classification on the original matrix M and the low-rank matrix L separately. To find the optimal margin hyperplane 14,15 that separates the two groups, a search process was used to look for the best constrained parameter by cross-validating training sets. Performance of the SVM classifier model was evaluated with testing datasets of both groups.
For VBM statistical analysis, unsmoothed L and smoothed M (FWHM 6mm) were tested using FSL randomise.16 Age, sex and intracranial volume were included as nuisance covariates. Multiple comparisons were corrected with the Threshold-Free Cluster Enhancement (TFCE) method (p<0.005).17
Results and Discussion
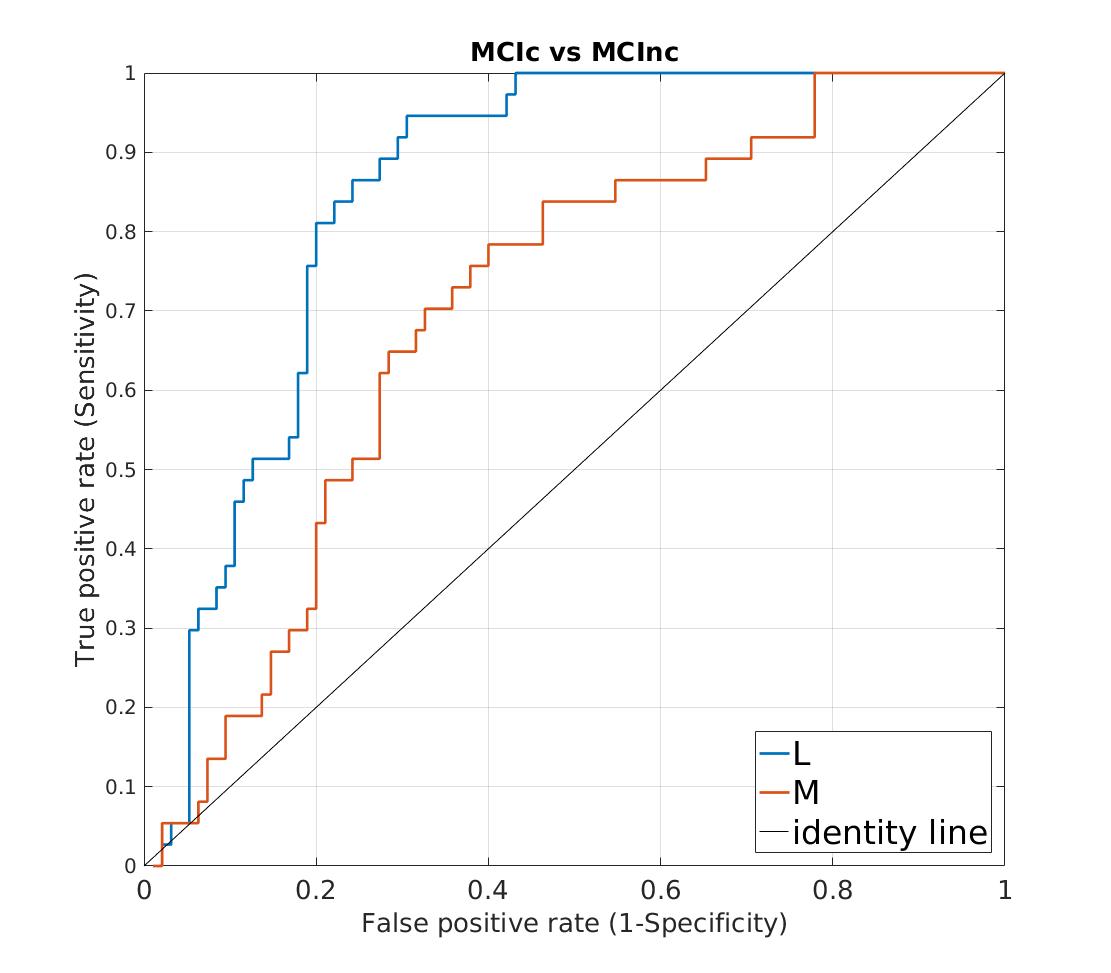
L+S decomposition of
VBM GM maps provided a significant improvement in machine learning
based discrimination between MCIc and MCInc subjects. Classification
accuracy for M is 68.18%, with 67.57% sensitivity and 68.42%
specificity, while the accuracy for L is 78.78%, with 83.78%
sensitivity and 76.84% specificity. Area under the ROC curve (AUC) is
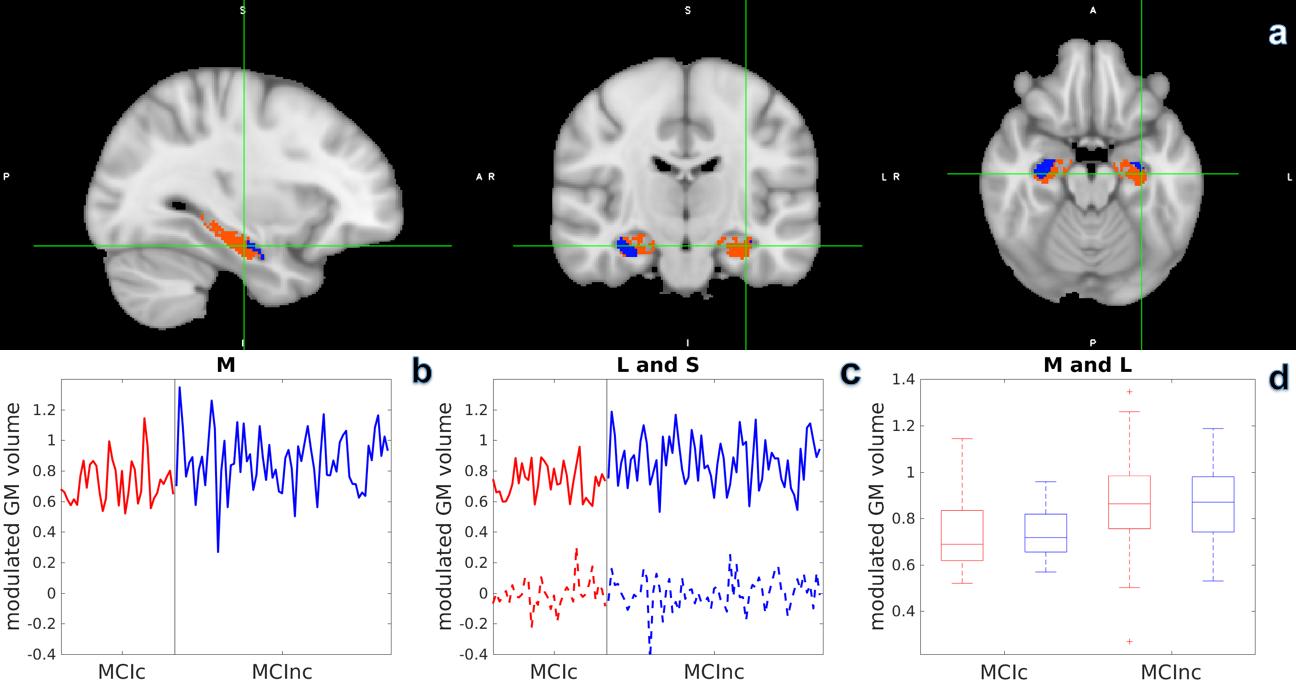
0.7021 versus 0.8495 for M and L respectively (Figure 1). The VBM
analysis showed that there are regions in left hippocampus not
significant in smoothed M but significant in L even without smoothing
(Figure 2a, orange voxels). Variance within each group is reduced
after L+S decomposition (Figure 2d), and group difference is more
obvious in L (Figure 2c, solid line) than in M (Figure 2b). Our
findings indicate that the L+S method can be employed to distinguish
MCIc and MCInc with high accuracy and high sensitivity, compared to
the classification based on original modulated GM volume maps.
Further analysis could be implemented on functional and structural
connectivity to pursue single subject level classification.18
Conclusion
This study demonstrated a L+S decomposition approach to improve the classification accuracy when investigating group differences between MCIc and MCInc. Specifically, the L+S decomposition was applied to GM maps to uncover subtle group differences masked by individual variability. More significantly, different hippocampal regions were found in variability-reduced GM maps than in the original ones. VBM statistical analysis also complemented the machine learning classification results. By maintaining common features across subjects and reducing individual variability, L+S decomposition will be a useful addition to neuroscientific group studies.Acknowledgements
This project is supported in part by PHS grants R01-CA111996, R01-NS082436 and R01-MH00380. Data collection and sharing for this project was funded by the Alzheimer's Disease Neuroimaging Initiative (ADNI; Principal Investigator: Michael Weiner; NIH grant U01 AG024904). ADNI is funded by the National Institute on Aging, the National Institute of Biomedical Imaging and Bioengineering (NIBIB), and through generous contributions from the following: Pfizer Inc., Wyeth Research, Bristol-Myers Squibb, Eli Lilly and Company, GlaxoSmithKline, Merck & Co. Inc., AstraZeneca AB, Novartis Pharmaceuticals Corporation, Alzheimer's Association, Eisai Global Clinical Development, Elan Corporation plc, Forest Laboratories, and the Institute for the Study of Aging, with participation from the U.S. Food and Drug Administration. Industry partnerships are coordinated through the Foundation for the National Institutes of Health. The grantee organization is the Northern California Institute for Research and Education, and the study is coordinated by the Alzheimer's Disease Cooperative Study at the University of California, San Diego. ADNI data are disseminated by the Laboratory of Neuro Imaging at the University of California, Los Angeles.References
1. Arbabshirani MR, Plis S, Sui J, Calhoun VD. Single subject prediction of brain disorders in neuroimaging: Promises and pitfalls. Neuroimage. 2017;145(Pt B):137-165.
2. Gauthier S, Reisberg B, Zaudig M, et al. Mild cognitive impairment. Lancet. 2006;367(9518):1262-1270.
3. Otazo R, Candès E, Sodickson DK. Low-rank plus sparse matrix decomposition for accelerated dynamic MRI with separation of background and dynamic components. Magn Reson Med. 2015;73(3):1125-1136.
4. Kang Z, Peng C, Cheng Q. Robust PCA Via Nonconvex Rank Approximation. In: 2015 IEEE International Conference on Data Mining. ; 2015. doi:10.1109/icdm.2015.15.
5. Jack CR Jr, Bernstein MA, Fox NC, et al. The Alzheimer’s Disease Neuroimaging Initiative (ADNI): MRI methods. J Magn Reson Imaging. 2008;27(4):685-691.
6. Cuingnet R, Gerardin E, Tessieras J, et al. Automatic classification of patients with Alzheimer’s disease from structural MRI: a comparison of ten methods using the ADNI database. Neuroimage. 2011;56(2):766-781.
7. Ashburner J. A fast diffeomorphic image registration algorithm. Neuroimage. 2007;38(1):95-113.
8. Ashburner J, Friston KJ. Unified segmentation. Neuroimage. 2005;26(3):839-851.
9. Makris N, Goldstein JM, Kennedy D, et al. Decreased volume of left and total anterior insular lobule in schizophrenia. Schizophr Res. 2006;83(2-3):155-171.
10. Frazier JA, Chiu S, Breeze JL, et al. Structural brain magnetic resonance imaging of limbic and thalamic volumes in pediatric bipolar disorder. Am J Psychiatry. 2005;162(7):1256-1265.
11. Desikan RS, Ségonne F, Fischl B, et al. An automated labeling system for subdividing the human cerebral cortex on MRI scans into gyral based regions of interest. Neuroimage. 2006;31(3):968-980.
12. Goldstein JM, Seidman LJ, Makris N, et al. Hypothalamic abnormalities in schizophrenia: sex effects and genetic vulnerability. Biol Psychiatry. 2007;61(8):935-945.
13. Chang C-C, Lin C-J. LIBSVM. ACM Transactions on Intelligent Systems and Technology. 2011;2(3):1-27.
14. Cristianini N, Shawe-Taylor J. Support Vector Machines. In: An Introduction to Support Vector Machines and Other Kernel-Based Learning Methods. ; :93-124.
15. Shawe-Taylor J, Cristianini N. Kernel Methods for Pattern Analysis.; 2004.
16. Winkler AM, Ridgway GR, Webster MA, Smith SM, Nichols TE. Permutation inference for the general linear model. Neuroimage. 2014;92:381-397.
17. Smith SM, Nichols TE. Threshold-free cluster enhancement: addressing problems of smoothing, threshold dependence and localisation in cluster inference. Neuroimage. 2009;44(1):83-98.
18. Wee C-Y, Yap P-T, Zhang D, et al. Identification of MCI individuals using structural and functional connectivity networks. Neuroimage. 2012;59(3):2045-2056.
Figures