2050
Quantitative comparison of image quality between averaged MPRAGE, averaged multi-echo MPRAGE, MP2RAGE and multi-echo MP2RAGE images at high field1MRI Lab, Center for Mind/Brain Sciences, University of Trento, Trento, Italy
Synopsis
T1 structural neuroimaging is challenged by spatial inhomogeneities of B1 and B0, especially at high fields (>= 3T). Different strategies have been proposed, MP2RAGE (less sensitive to ΔB1, giving also a T1 map) and multi-echo MPRAGE (MEMPRAGE, less sensitive to ΔB0, giving also a T2* map). Here we evaluate the combination of both approaches: MEMP2RAGE. We compare gray-white matter contrast (tissue_CNR) and intensity non-uniformity (INU), between MEMP2RAGE and 3 sets of images under comparable acquisition time: MP2RAGE, two averages MPRAGE, two averages MEMPRAGE. Both MP2RAGE images provide higher tissue_CNR and INU correction than standard MPRAGE images.
Introduction
The benefit of increased signal to noise ratio for structural imaging at high fields (>= 3T) is challenged by artifacts due to B0 and B1 field inhomogeneities. To overcome this issue, new versions of the MPRAGE sequence, the standard T1-weighted sequence for brain structural imaging, have been recently proposed: a) a multi-echo MPRAGE (MEMPRAGE) sequence characterized by smaller image distortions that can also be used for T2* mapping [1], and b) a sequence combining T1 and Proton Density weighted images (MP2RAGE) to correct for image intensity inhomogeneities that can be also used for T1 mapping [2], [3]. In this study we propose a novel method integrating these two sequences (MEMP2RAGE) and characterize its image quality in comparison with different sets of T1-weighted images obtained combining two 3D structural sequences of identical duration (5 min and 30 sec) in order to keep acquisition time comparable across them. Specifically we calculated and compared the gray to white matter contrast to noise ratio (tissue_CNR) and image intensity inhomogeneities among the following set of T1-weighted images: 1) multi-echo MP2RAGE (MEMP2RAGE), 2) MP2RAGE, 3) average of two single echo MPRAGE (Avg. SE), 4) average of two multi-echo MPRAGE (Avg. ME).Method
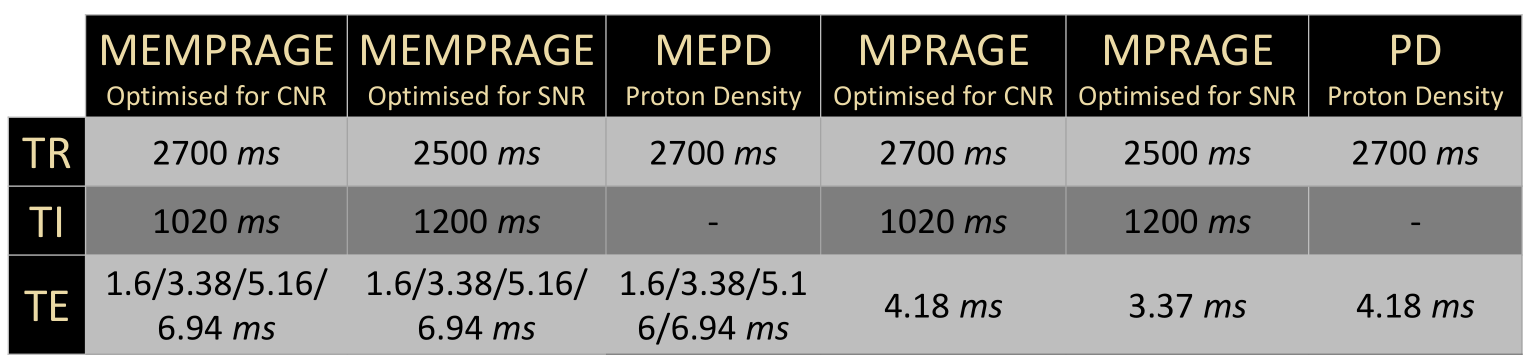
Participants and MRI acquisition: 11 healthy volunteers (7 M, age = 29.0±7.5 yo) participated in this study approved by the local ethical committee. For each subject 3 single and 3 multi-echo T1-MPRAGE and Proton Density weighted sequences were acquired at a Bruker 4T scanner. The main acquisition parameters of each sequence are reported in Table 1.
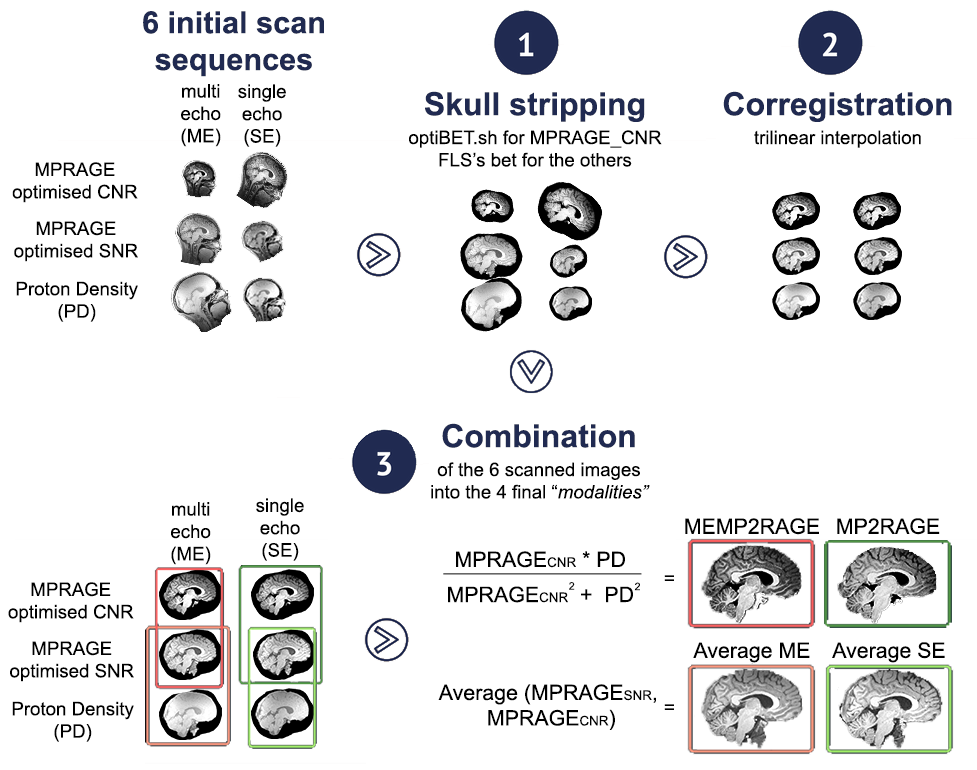
Image pre-processing: Images were skull-stripped, co-registered and combined as illustrated in Figure 1 to obtain the 4 images analyzed in this study: MEMP2RAGE, MP2RAGE, Avg. ME and Avg. SE. For each subject and each image gray and white matter maps were obtained using the FSL segmentation tool (FAST, threshold 0.5).
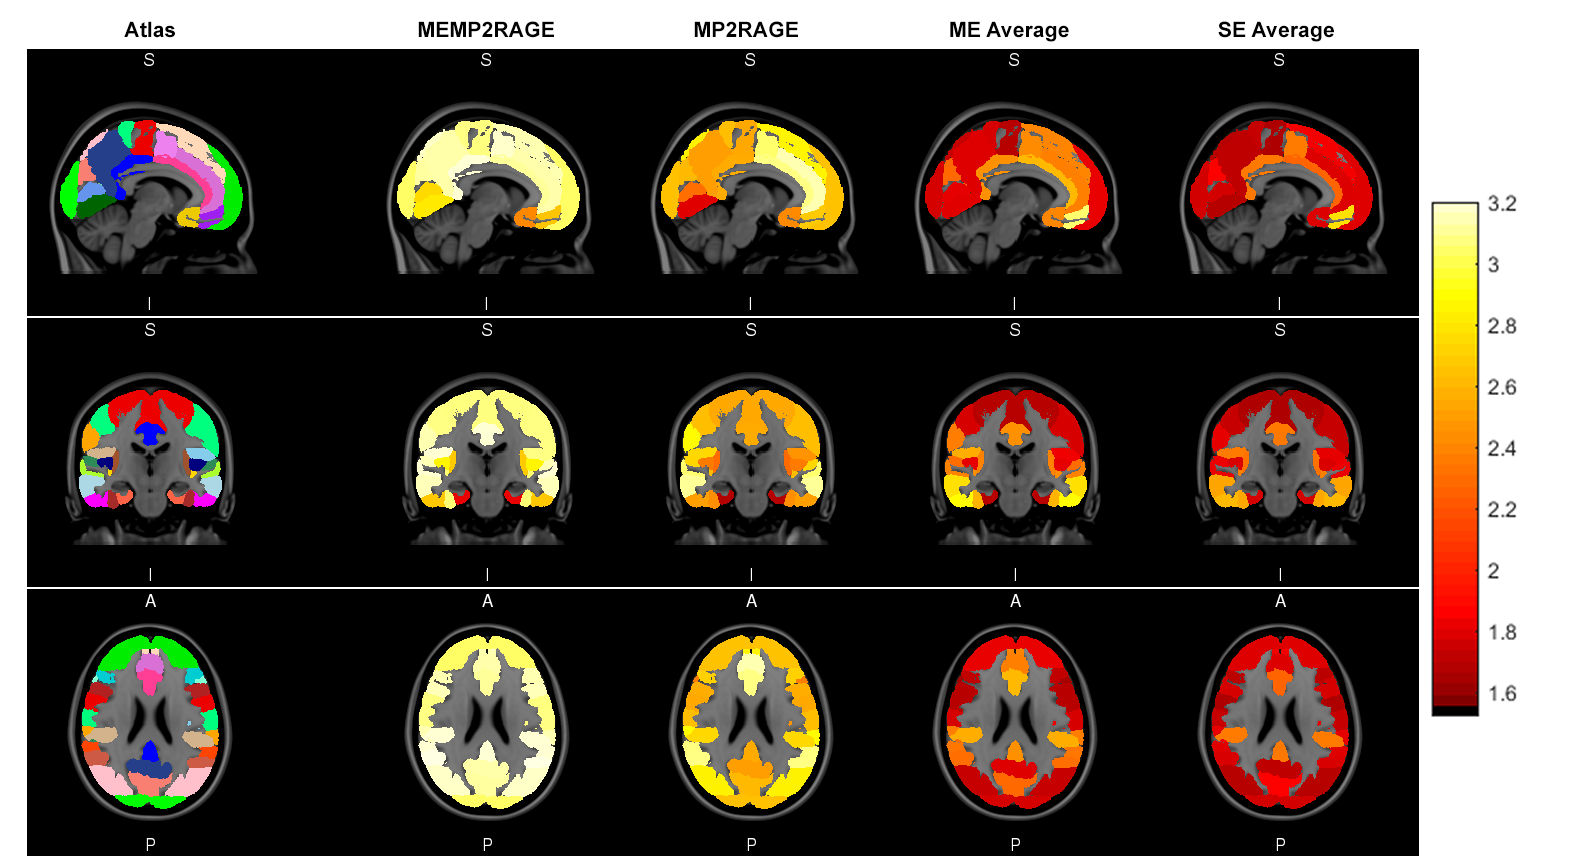
Tissue_CNR was calculated for each image in 60 atlas based ROIs of the Harvard-Oxford Cortical and Subcortical Atlas as defined below:
$$tissue\_CNR_{i,j} = {\frac{\langle S_{WM} \rangle - \langle S_{GM} \rangle}{\sqrt{\sigma^2_{WM} + \sigma^2_{GM}}}}\Biggr|_{\substack{i,j}}$$
where i = subject index, j = ROI index, SGM = signal of the Gray Matter in each ROI, SWM = signal of the White Matter adjacent to Gray Matter in the same ROI, σGM/WM = standard deviation of the GM/WM signal in each ROI. Non parametric ANoVA (Kruskal-Wallis) with paired comparisons was performed to assess differences in tissue_CNR across the 4 images. Statistical significance was considered at p<0.05 corrected for multiple comparison with Bonferroni correction.
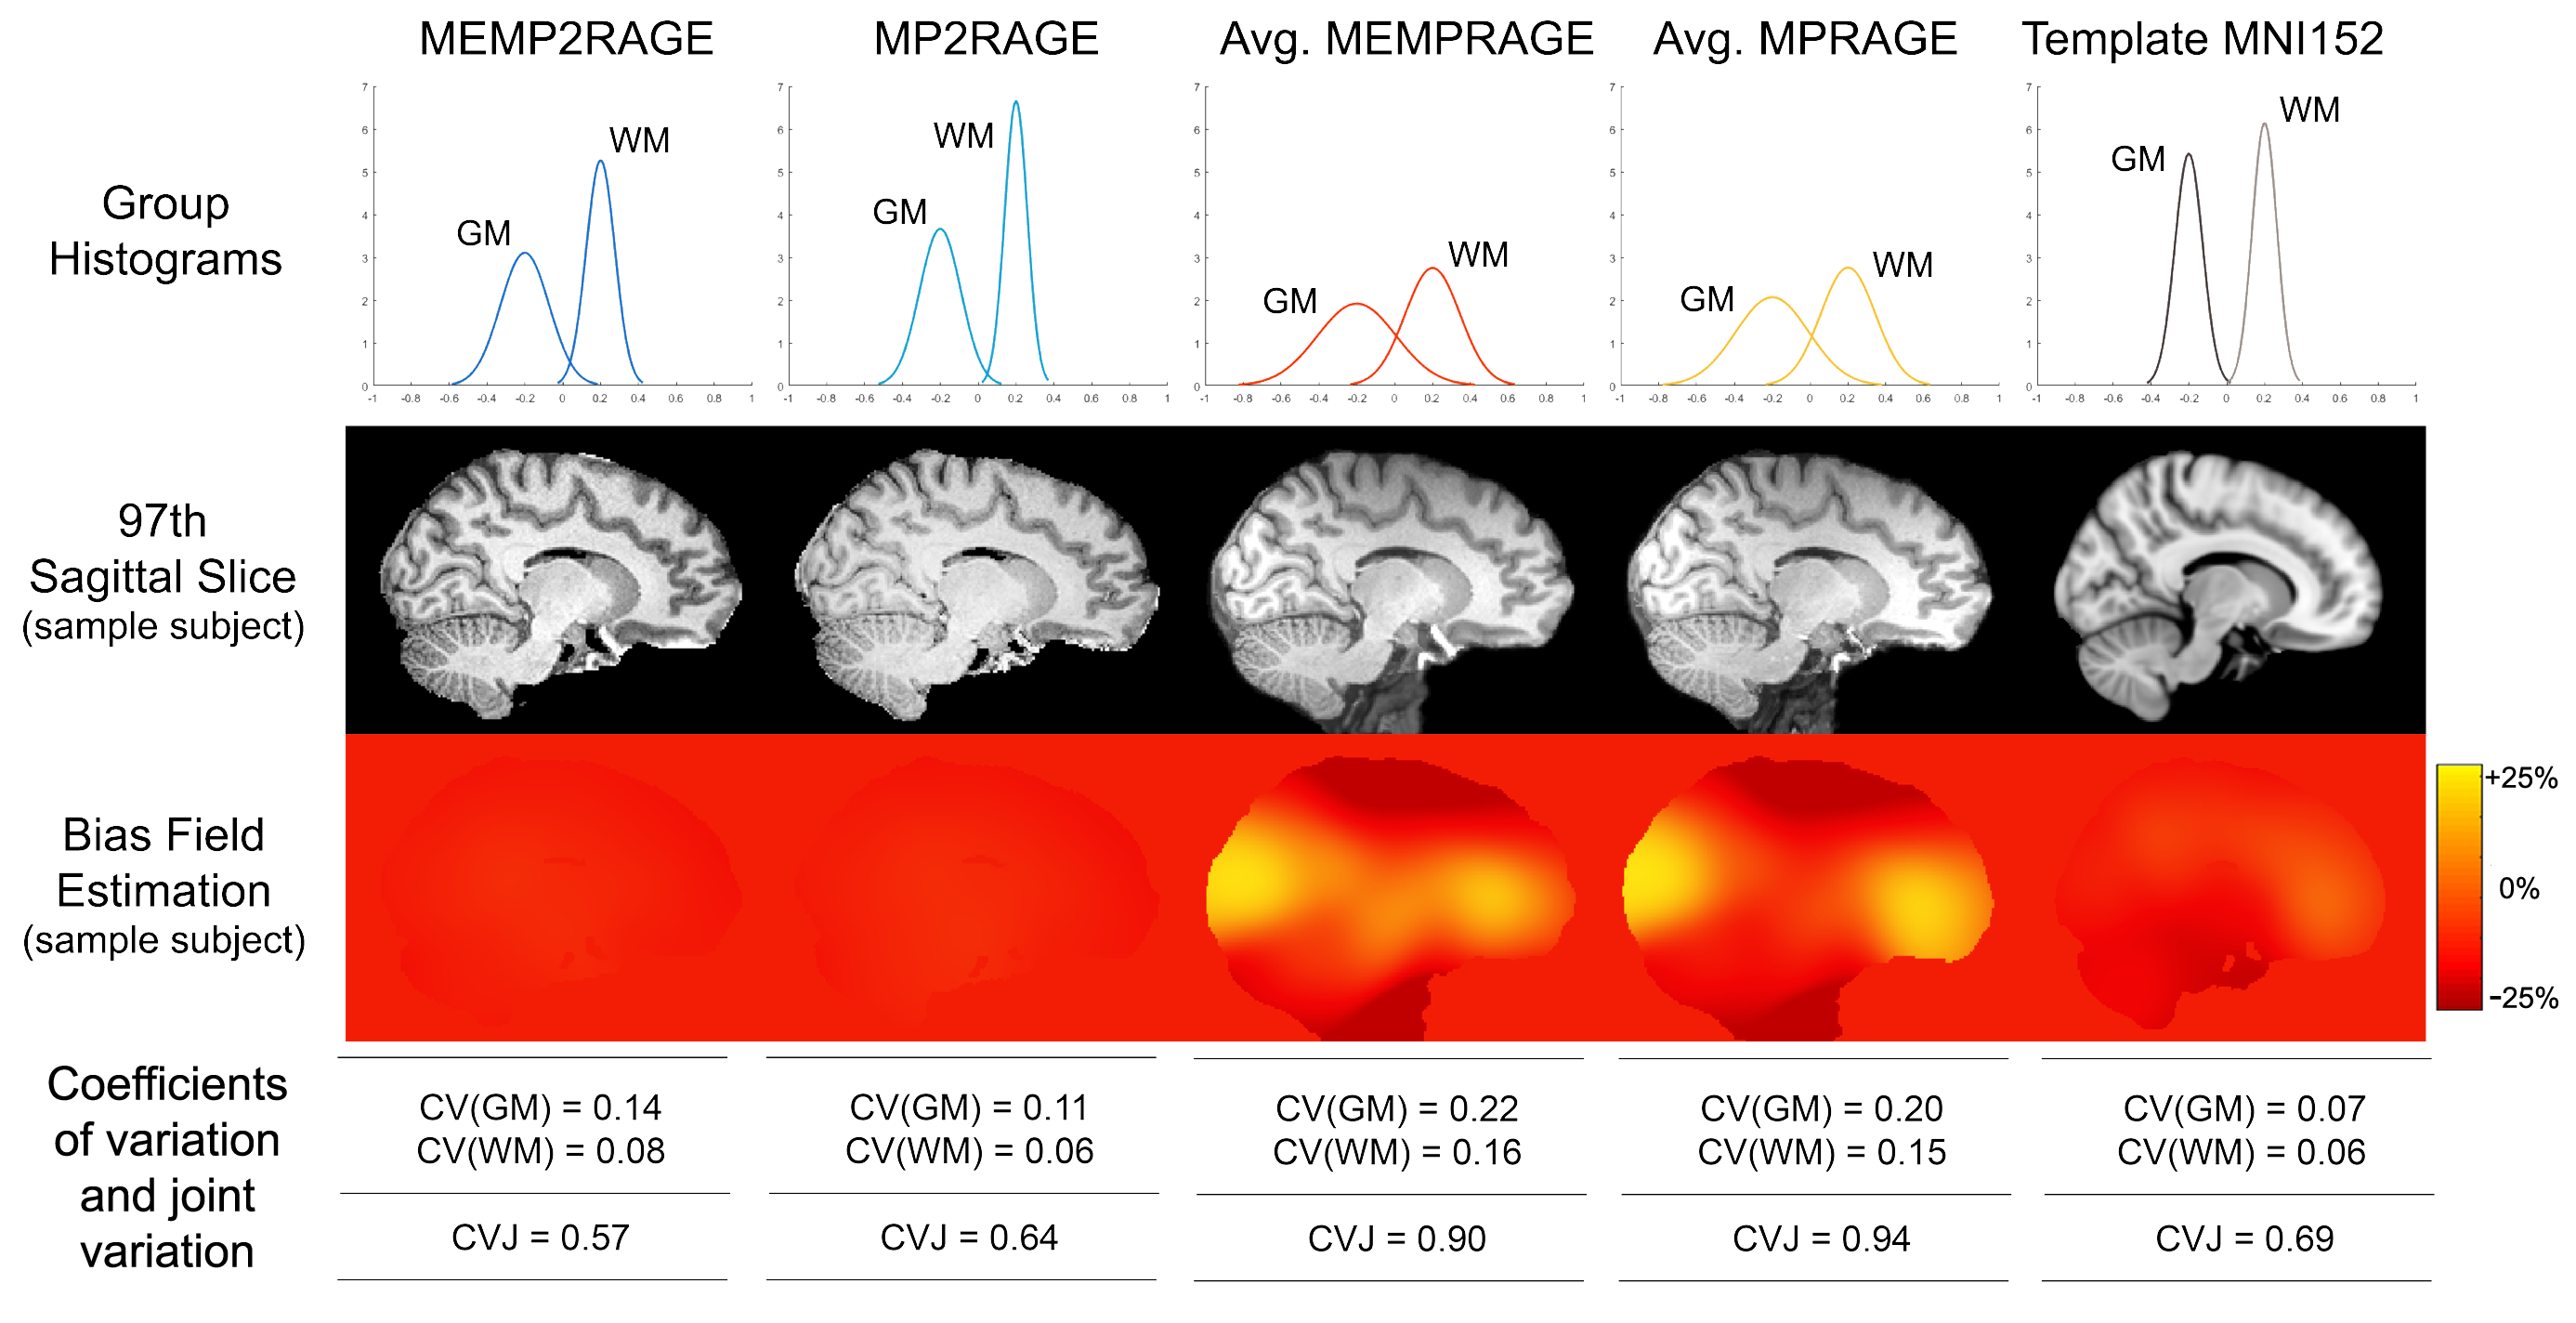
Intensity Uniformity (IU) was quantitatively estimated for each of the 4 images by computing the coefficients of variation and joint variation of the histograms representing the distribution of GM and WM across all the slices and all the subjects and measuring the bias field across the images using FSL [4].
Results
The mean across subjects tissue_CNR values for each image in each ROI of the Harvard-Oxford Cortical and Subcortical Atlas are shown in Figure 2. The Kruskal-Wallis test showed a significant difference in 58/60 ROIs (p ≤ 0.05). According to the pairwise comparisons, the MP2 images had the highest tissue_CNR in 50/60 of the total ROIs (p ≤ 0.05 corrected for multiple comparisons). Of these 50 ROIs, 9/50 showed a significant improvement in tissue_CNR between MEMP2RAGE and single echo MP2RAGE. Coefficients of variation for GM, WM and joint histograms were lower for the MP2 images as reported in Figure 3 (fourth and fifth row). The Intensity Non Uniformity (INU) was self-corrected by the “MP2” images, as shown by the uniform value around 0% for bias field estimation on these images (Figure 3, third row).Discussion and Conclusions
The results of this study show that for accelerated T1-weighted imaging protocols with acquisition of two structural sequences (same acquisition duration, ~11 min), single-echo and multi-echo MP2RAGE images provide higher gray-white matter CNR and lower image intensity inhomogeneities with respect to standard averaged MPRAGE images. This information may be helpful for optimizing T1-weighted imaging protocols at high fields (>=3T) using multichannel coils, where total acquisition time may be further reduced with acceleration factors higher than 2 without compromising signal to noise ratio. Future work may assess the accuracy of automatic segmentation of brain structures provided by these images.Acknowledgements
No acknowledgement found.References
[1] van der Kouwe AJW, Benner T, Salat DH, Fischl B. “Brain morphometry with multiecho MPRAGE”, Neuroimage. 2008 Apr 1; 40(2):559-569.
[2] Marques et al. “MP2RAGE, a self bias-field corrected sequence for improved segmentation and T1-mapping at high field”, Neuroimage. 2010 Jan 15; 49(2):1271-81.
[3] O’Brien et al. “Robust T1-Weighted Structural Brain Imaging and Morphometry at 7T Using MP2RAGE”, PLOS ONE. 2014 Jun 16; 9(6): e99676.
[4] Zin Yan Chua et al. “Evaluation of performance metrics for bias field correction in MR brain images”, Journal of magnetic resonance imaging. 2009 Jun; 29(6):1271–1279
Figures