2049
A Simplified Method to Estimate Perfusion Characteristics of Gliomas based on Diffusion-weighted Imaging1Department of Radiology, Renji Hospital, School of Medicine, Shanghai Jiao Tong University, Shanghai, P.R. China, Shanghai, China, 2Department of Neurosurgery, Renji Hospital, School of Medicine, Shanghai Jiao Tong University, Shanghai, P.R. China, Shanghai, China, 3GE Healthcare China, Shanghai, P.R. China, Shanghai, China
Synopsis
The purpose of the study was to evaluate the application of a simplified method to estimate the perfusion characteristics of glioma as an alternative less time-consuming approach. Fifty patients confirmed with glioma were assessed with multi-b-value DWI and DCE MR imaging. Results indicated that the simplified perfusion fraction (SPF) based on DWI acquired with three b-values showed strong correlation with IVIM-derived f and D*, and showed medium correlation with DCE MR imaging-derived Ktrans and vp. SPF achieved the highest accuracy for gliomas grading. SPF may serve as a valuable alternative to measure tumor perfusion in gliomas.
Purpose
Although dynamic contrast-enhanced (DCE) magnetic resonance (MR) imaging and intravoxel incoherent motion (IVIM) has been applied in gliomas to estimate the perfusion characteristics and to differentiate low- from high-grade tumors.1, 2 However, it is necessary to develop a less time-consuming and no contrast agent needed approach. The purpose of this study was to evaluate the feasibility of simplified perfusion fraction (SPF) based on diffusion-weighted imaging (DWI) acquired with three b-values to measure tissue perfusion linked to microcirculation, to validate it against from perfusion-related parameters derived from intravoxel incoherent motion (IVIM) and dynamic contrast-enhanced (DCE) magnetic resonance (MR) imaging, and to investigate its utility to differentiate low- from high-grade gliomas.Methods
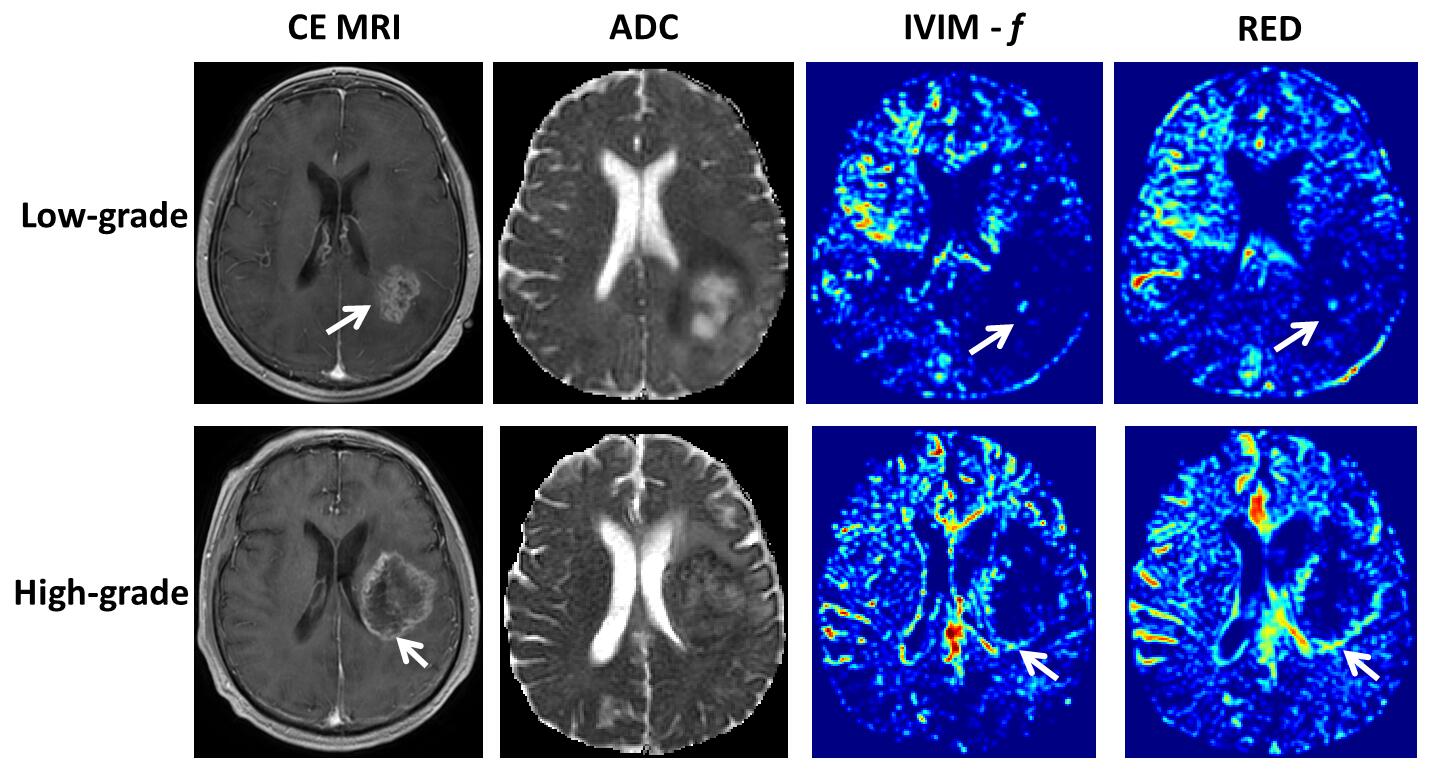
The prospective study was approved by the local institutional review board and written informed consent was obtained from all patients. Between May 2016 and May 2017, a total of 50 patients with pathologically confirmed gliomas were included in this study, 19 of 50 patients (38%) were confirmed with low-grade (WHO grade II) gliomas and 31 patients (62%) with high-grade (WHO grades III and IV) gliomas. All MR images were obtained with a 3.0-T MR imager (Signa HDxt; GE Medical Systems, Milwaukee, Wis). All patients received multi-b-value DWI and DCE MR imaging. For DWI, we performed a single shot echo-planar sequence in the axial plane with the following parameters: repetition time msec/echo time msec, 3000/106; section thickness, 5 mm; intersection gap, 1 mm; field of view , 260 × 260 mm; matrix, 192 × 192; number of sections, 15; b-values, 0, 20, 50, 80, 150, 200, 300, 500, 800, 1000 sec/mm2. Dynamic contrast-enhanced MR images were obtained with a three-dimensional gradient-echo T1-weighted sequence. Besides conventional apparent diffusion coefficient (ADC0,1000) map, perfusion-related parametric maps for IVIM-derived perfusion fraction (f) and pseudodiffusion coefficient (D*), DCE MR imaging-derived pharmacokinetic metrics, including Ktrans, ve, and vp, as well as SPF, were generated. We introduced an additional parameter called SPF (SPF=(ADC0,200-ADC200,1000)/ADC0,200), which represents the relative fraction of perfusion. Similar simplified method was confirmed by Thoeny et al and Teruel et al,3, 4 respectively. Two neuroradiologists carefully placed round-shaped regions of interest (ROI) in the solid portion of tumor on parametric maps with reference to conventional MR images by using the hot-spot method.5, 6 Correlation between perfusion-related parameters was computed by using the nonparametric Spearman rank correlation. The Mann-Whitney U test was used for the comparison of each parameter between low- and high-grade gliomas. Receiver operating characteristic (ROC) curves were employed to calculate the area under the curve (AUC) and to determine the optimal thresholds for grading gliomas by maximizing the Youden index.Result
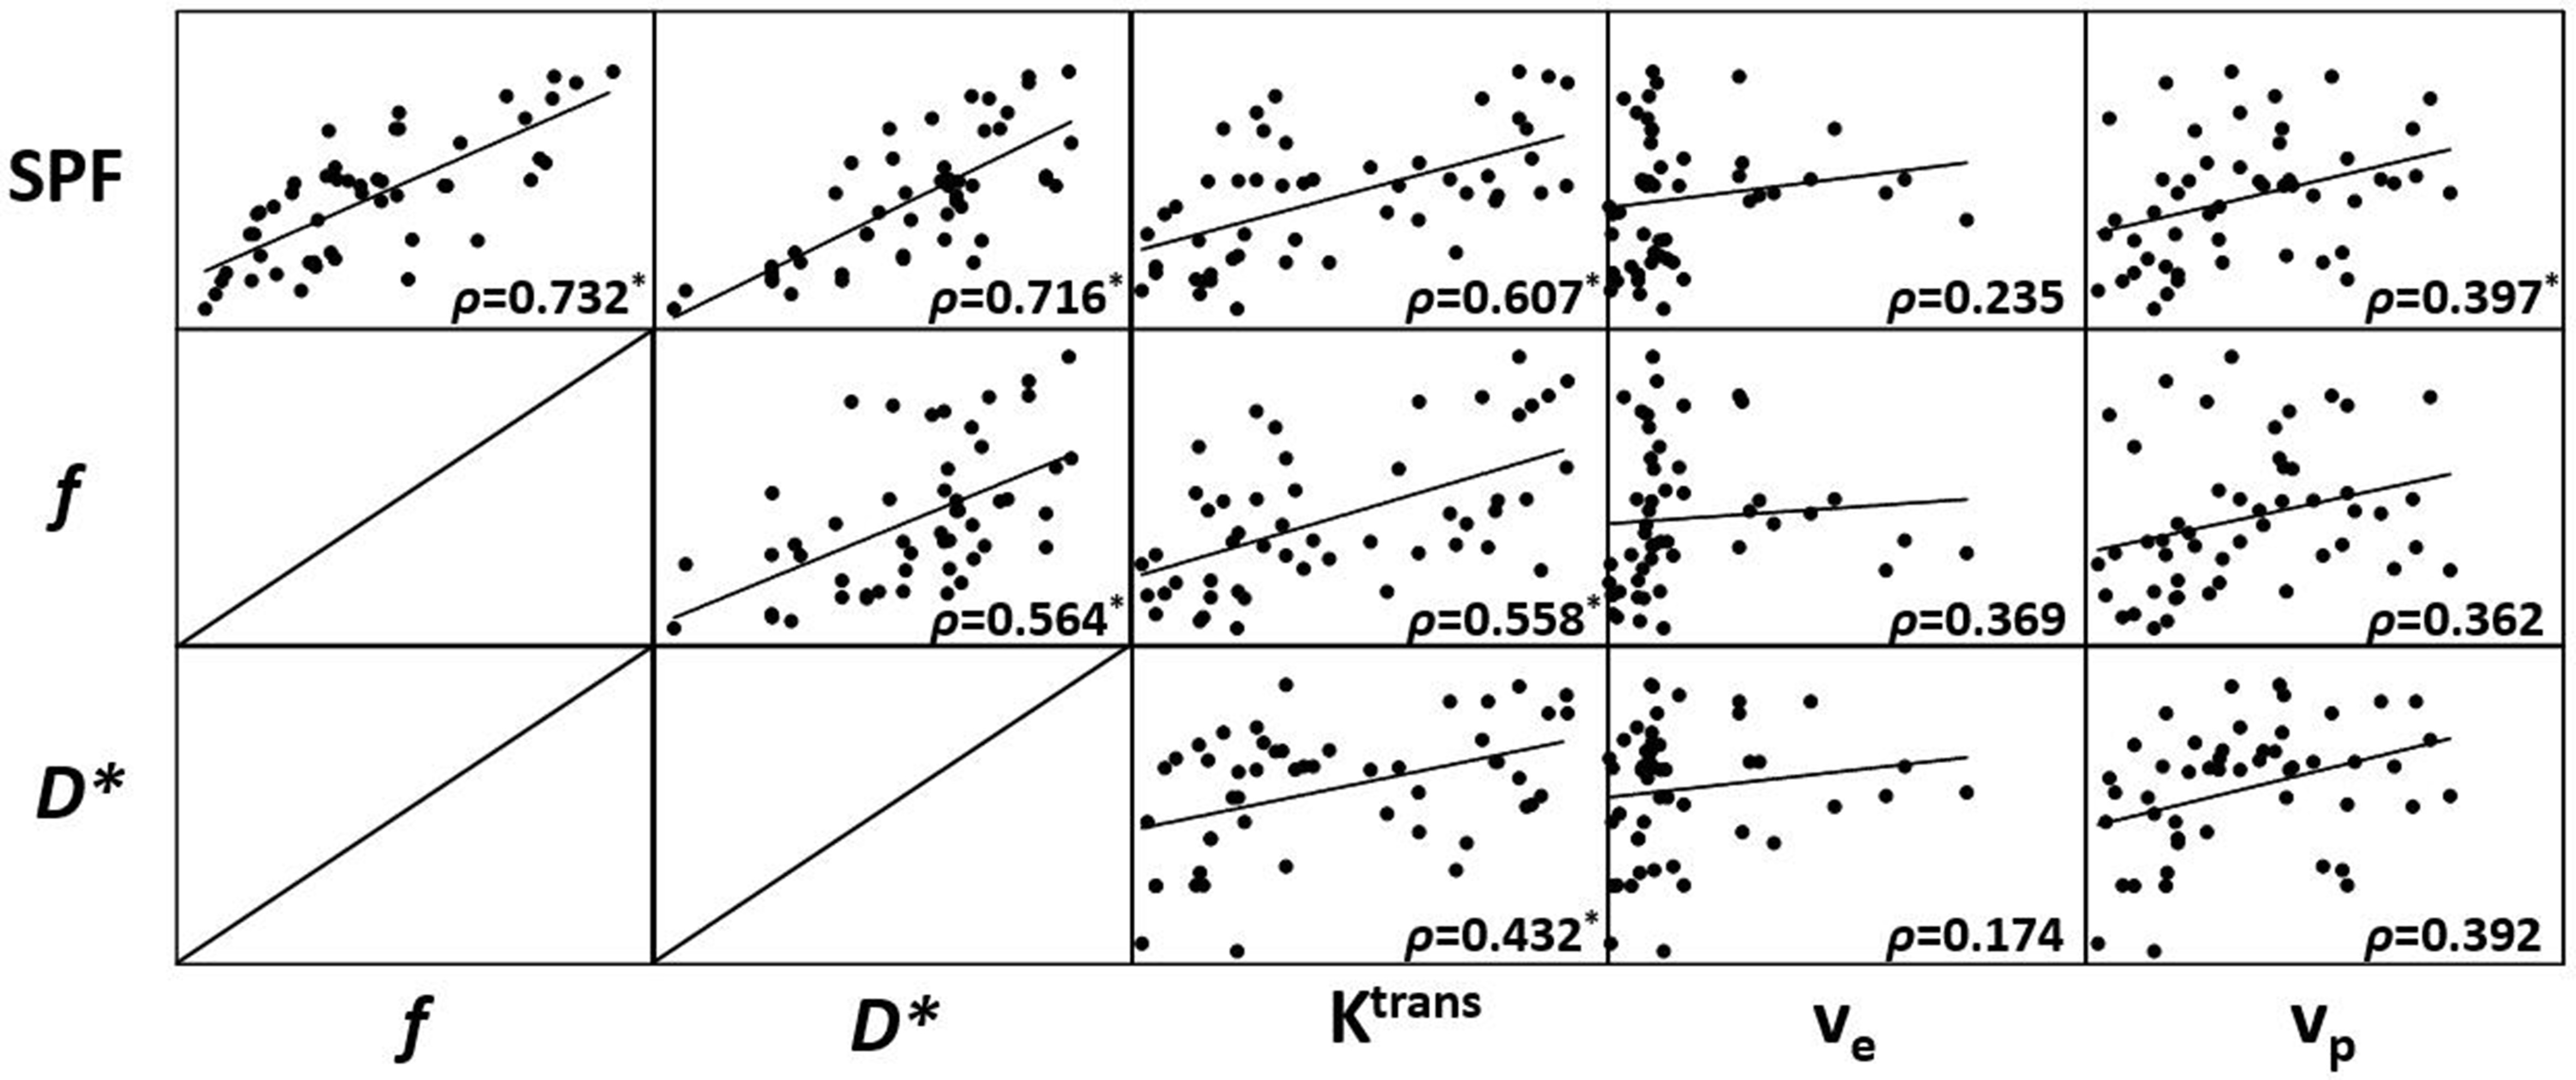
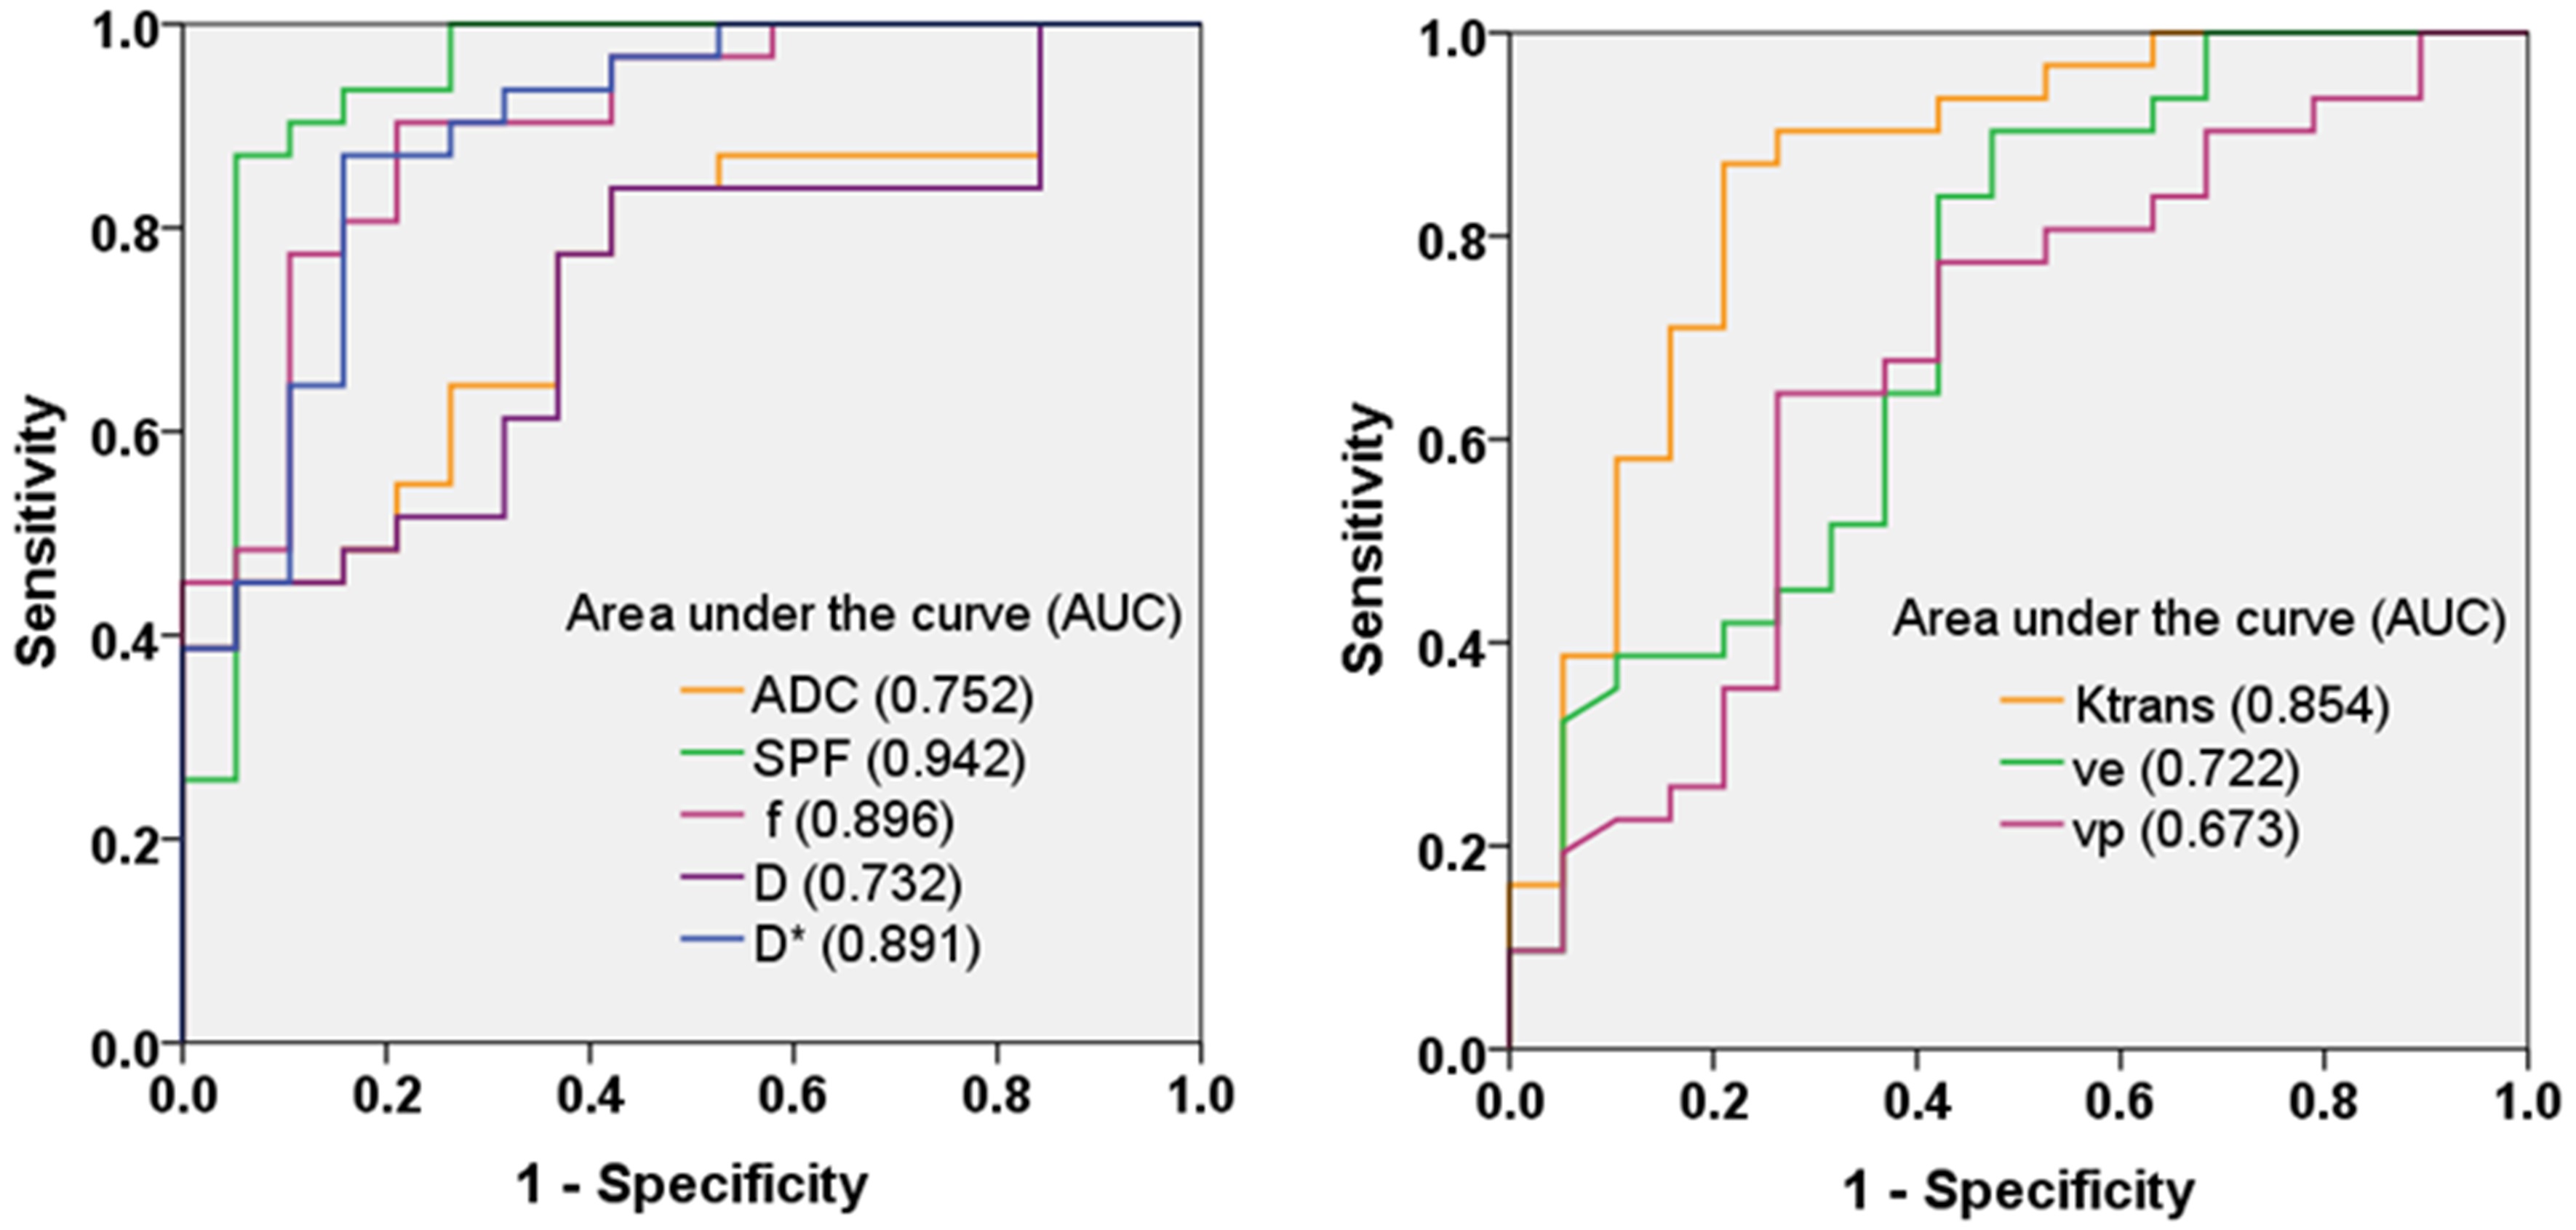
There was a statistically significant strong positive correlation between SPF and f (ρ = 0.732; P < 0.001), and between SPF and D* (ρ = 0.716; P < 0.001). Notably, SPF exhibited a stronger correlation with Ktrans compared with f (ρ = 0.607 and 0.558, respectively; both P < 0.001). Additionally, we also observed a weak correlation between SPF and vp (ρ = 0.397; P = 0.004), which was more significant than the correlation between f and vp (ρ = 0.362; P = 0.010). Perfusion-related parameters including DWI derived SPF, f, and D*, and DCE-MR imaging derived Ktrans, ve and vp all exhibited significantly elevated values in high-grade gliomas than those in low-grade gliomas (all P < 0.05). Among all imaging parameters, SPF achieved the highest AUC value of 0.942, followed by f (0.896), D* (0.891) and Ktrans (0.854), whereas the AUC values of diffusion indexes were relatively low (0.752 for ADC0,1000 and 0.732 for D, respectively). Further, the AUC of SPF was significantly higher than that of ADC0,1000 (P = 0.004). No significant difference in AUC values was detected between SPF and f (P = 0.317), as well as between SPF and Ktrans (P = 0.065).Discussion and Conclusion
The preliminary results showed that the perfusion-related parameter obtained from this 3-b-value approach, named SPF, correlated well with IVIM derived f and D*, and DCE MR imaging derived Ktrans and vp. Furthermore, SPF proved to be useful in differentiating low- from high-grade gliomas, and showed higher diagnostic accuracy compared with ADC, IVIM and DCE MR imaging parameters. Thus, SPF may serve as a valuable alternative to measure tumor perfusion in gliomas in a noninvasive, convenient and efficient way.Acknowledgements
Funded by National Natural Science Foundation of China (grants 81501458, 81701642 and 81571650), Shanghai Science and Technology Committee Medical Guide Project (western medicine) (grant 17411964300), and Medical Engineering Cross Research Foundation of Shanghai Jiao Tong University (grant YG2015QN37).References
1. Heye AK, Culling RD, Valdés HMC, et al. Assessment of blood-brain barrier disruption using dynamic contrast-enhanced MRI. A systematic review. Neuroimage Clinical. 2014;6(4):262-274.
2. Federau C, Meuli R, O'Brien K, et al. Perfusion measurement in brain gliomas with intravoxel incoherent motion MRI. Ajnr American Journal of Neuroradiology. 2014;35(2):256.
3. Thoeny HC, De KF, Vandecaveye V, et al. Effect of vascular targeting agent in rat tumor model: dynamic contrast-enhanced versus diffusion-weighted MR imaging. Radiology. 2005;237(2):492-499.
4. Teruel JR, Goa PE, Sjøbakk TE, et al. A Simplified Approach to Measure the Effect of the Microvasculature in Diffusion-weighted MR Imaging Applied to Breast Tumors: Preliminary Results. Radiology. 2016;281(2):373.
5. Togao O, Hiwatashi A, Yamashita K, et al. Differentiation of high-grade and low-grade diffuse gliomas by intravoxel incoherent motion MR imaging. Neuro Oncol. 2016;18(1):132-141.
6. Suh CH, Kim HS, Lee SS, et al. Atypical imaging features of primary central nervous system lymphoma that mimics glioblastoma: utility of intravoxel incoherent motion MR imaging. Radiology. 2014;272(2):504-513.
Figures