2047
Application of support vector machines to multi-modal hemo-metabolic data for classification of disease severity in patients with extreme arterial steno-occlusive diseases1Chemical and Physical Biology Program, Vanderbilt, Nashville, TN, United States, 2Radiology and Radiological Sciences, Vanderbilt, Nashville, TN, United States, 3Neurosurgery, Vanderbilt, Nashville, TN, United States, 4Pediatrics - Division of Pediatric Neurology, Vanderbilt, Nashville, TN, United States
Synopsis
Traditional hemodynamic imaging approaches such as arterial spin labeling (ASL) and hypercapnic blood oxygenation level-dependent (BOLD) reactivity provide contrasts that are frequently difficult to interpret using conventional analyses in arterial steno-occlusive disease patients with extreme blood arrival and vascular reactivity delay times. We investigated applying a supervised learning procedure to exploit endovascular and vascular compliance artifacts as potential indicators of disease severity; results show that less-conventional variables which report on endovascular blood signal and delayed vascular compliance outperform conventional variables, such as mean ASL signal and BOLD signal change.
Introduction
We aimed to utilize support vector machine (SVM) algorithms along with novel imaging contrasts to distinguish brain regions with vs. without clinical indicators of hemodynamic impairment in patients with arterial steno-occlusive disease. In patients with multi-focal intracranial arterial steno-occlusive disease, such as moyamoya, arterial stenosis can lead to development of elaborate collateral networks and escalated stroke risk1. Conventional MRI metrics such as arterial spin labeling (ASL)-measured cerebral blood flow (CBF) and blood oxygenation level-dependent (BOLD)-measured cerebrovascular reactivity (CVR) may be inaccurate indicators of vascular health in these populations when using standard acquisition and post-processing routines due to extreme delays in blood arrival2 and vascular reactivity onset time3. However, these apparent artifacts, which often complicate interpretation4, may also be viewed as novel contrast sources that convey information regarding pathology. We hypothesize that these novel contrasts may provide more accurate classification of disease severity in moyamoya patients compared to conventional markers when incorporated into supervised learning models such as SVMs.Methods
Study participants. Patients with moyamoya (n=44; mean age=45+/-14 years) provided informed, written consent and were scanned at 3.0T (Philips). Each hemisphere was considered independently since lateralizing steno-occlusion is often present5; brain hemispheres with prior surgical revascularization were excluded.
Experiment. CVR measurements were acquired with blood oxygen level-dependent (BOLD; TR/TE=2000/30 ms) imaging in response to mild hypercapnia (5% CO2). The paradigm consisted of 180s hypercapnia interleaved with 180s normocapnia repeated once. CBF measurements were acquired with pseudo-continuous arterial spin labeling (pCASL; TR/TE=4000/11 ms; labeling duration=1500 ms; post-labeling delay=1550 ms). Note that the pCASL post-labeling delay was shorter than expected arterial circulation times in this population, which enabled endovascular signal to be included as a candidate marker of impairment.
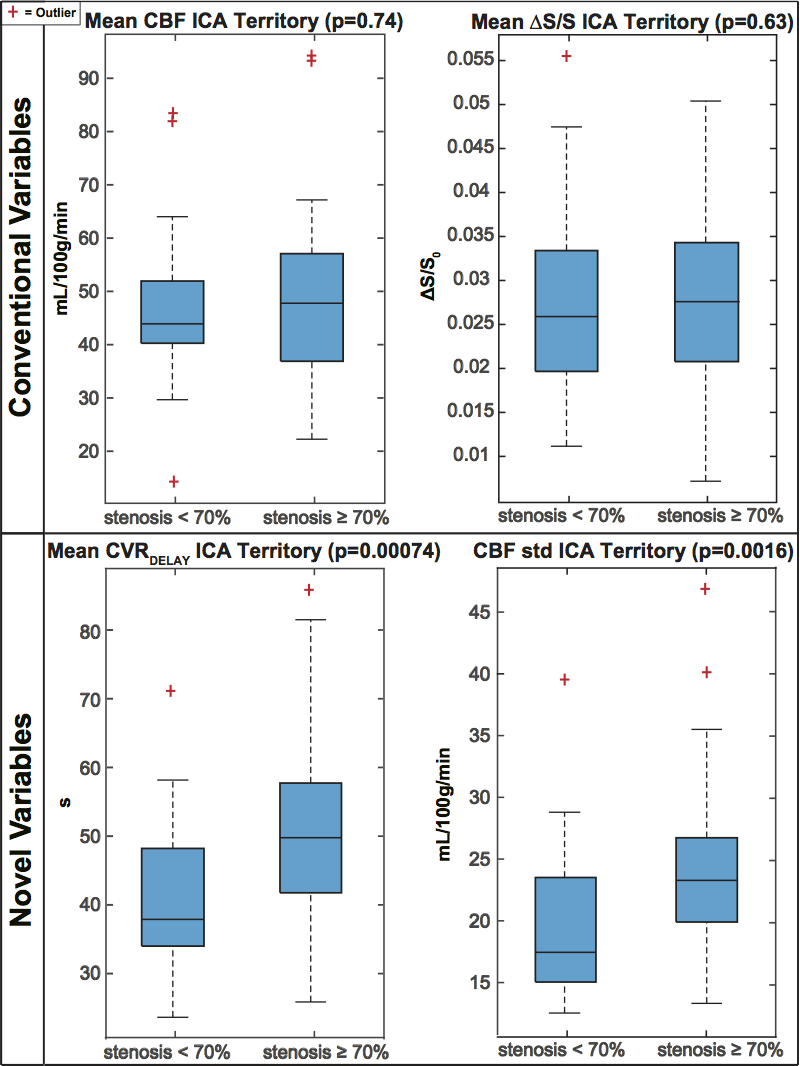
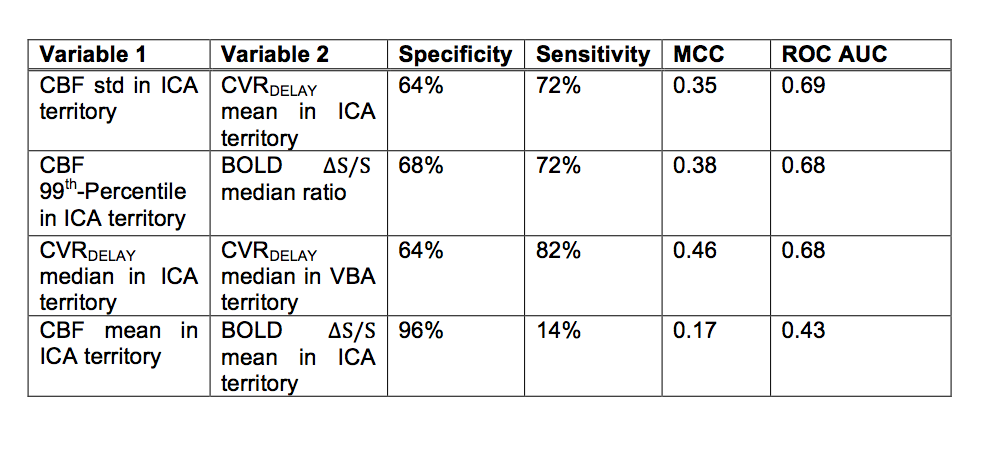
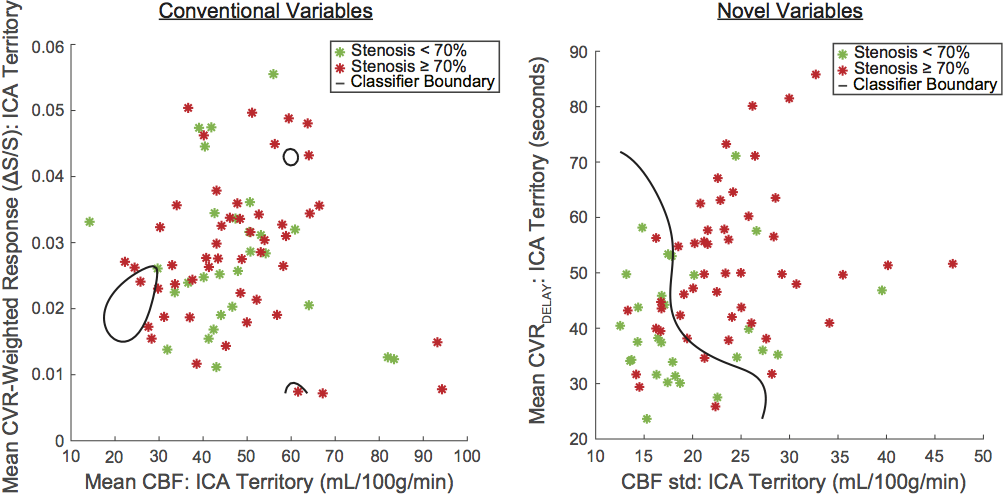
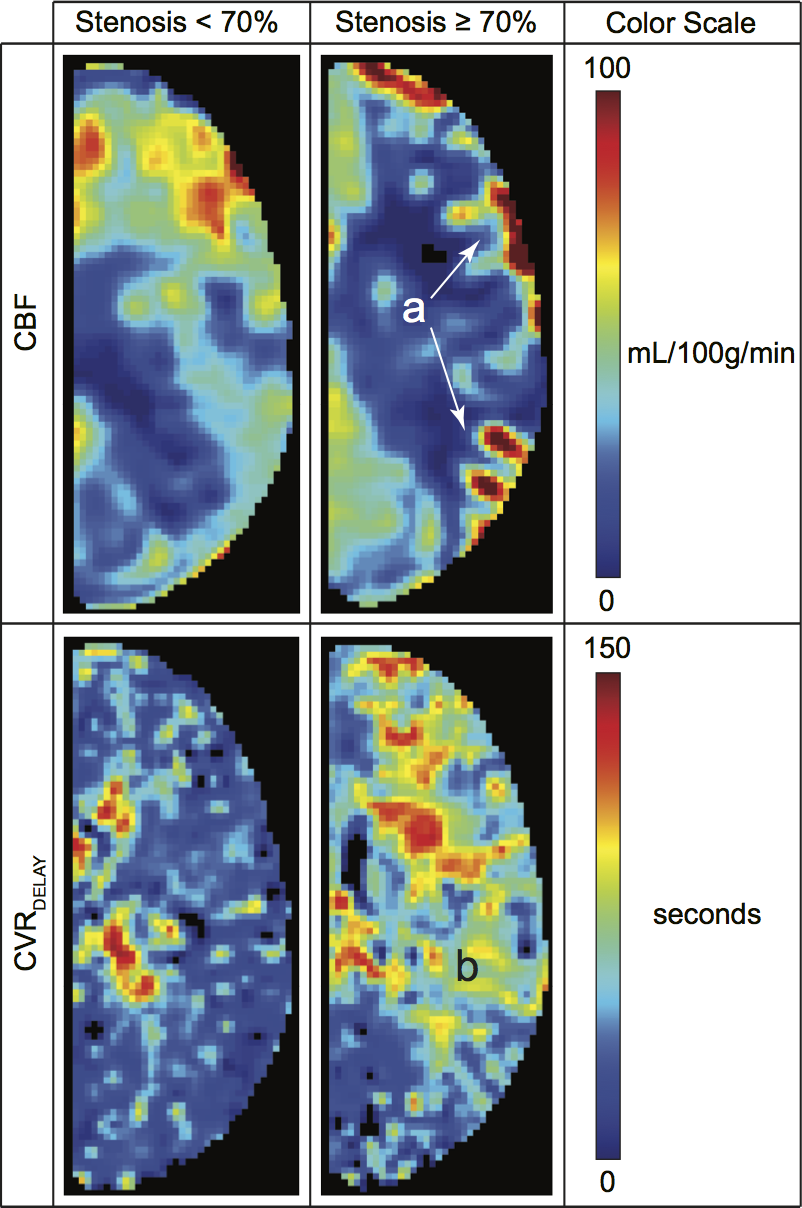
Analysis. From BOLD data, we quantified the parameters mean, median, 99th-Percentile, standard deviation (std), and kurtosis of the (i) signal change (ΔS/S), (ii) CVRDELAY, and (iii) CVRMAX (Figure 1). The same parameters were calculated for ASL signal. All parameters were calculated in bilateral internal carotid artery (ICA) and vertebrobasilar artery (VBA) flow territories. The ratio of each observable in the ICA to VBA territory was also calculated. Hemispheres supplied by at least one major intracranial artery with angiography-confirmed stenosis≥70% were classified as more diseased and all others were classified as less diseased. To determine which variables were most discriminatory for more diseased hemispheres, a bivariate analysis was performed using a Wilcoxon rank-sum test (two-sided p<0.05). Next, an SVM with Gaussian transformation was applied for multiple combinations of candidate variables. An SVM operates by defining a hyperplane which optimally separates the data clusters in parameter space after transforming the space to a higher dimension. Sensitivity, specificity, Matthews Correlation Coefficient (MCC), and Receiver Operator Characteristic (ROC) were calculated using a leave-one-out approach (Figure 1).
Results
The number of hemispheres meeting inclusion criteria were 28 in the less diseased and 49 in the more diseased groups. The hemodynamic properties conventionally used to identify MMS severity (mean CBF and BOLD ΔS/S) were outperformed by several non-conventional variables. The individual discriminatory capacity of the novel variables (p<0.001; mean CVRDELAY and CBF standard deviation) was greater than from conventional variables (p≥0.63) (Figure 2). Applying SVM with conventional variables produced a specificity=96%, sensitivity=14%, MCC=0.17, and ROC-AUC=0.43; applying SVM with novel variables produced a specificity=64%, sensitivity=72%, MCC=0.35, and ROC-AUC=0.69 (Figures 3-5).Discussion
In patients with delayed vascular compliance, endovascular ASL signal can be elevated due to inefficient time for labeled blood water to reach the capillary exchange site. Furthermore, increased time for vessels to respond maximally to hypercapnia causes a greater CVRDELAY mean value in the more diseased hemispheres. These phenomena provide two physiological explanations for the origins of the predictive capacity of ASL signal heterogeneity and CVRDELAY respectively. One analysis feature to be addressed is the physiological non-orthogonality of variables. For example, a brain hemisphere with long CVRDELAY is likely to also have a high ASL standard deviation, indicating that though these variables are experimentally independent, they may not be physiologically independent. The SVM classification will likely become more robust once variables containing the most complementary information are identified. Ongoing work is focused on using SVMs with a greater number of variables to increase predictive power for diseased flow territories or even recurrent stroke risk.Conclusion
Using supervised machine learning, we showed that apparent signal artifacts resulting from delayed vascular compliance, such as CVRDELAY and ASL standard deviation, may hold greater potential for distinguishing brain hemispheres with hemodynamic impairment compared to conventional parameters such as mean ASL signal and mean BOLD reactivity.Acknowledgements
No acknowledgement found.References
1. Su P, Mao D, Liu P, Li Y, Pinho MC, Welch BG, Lu H. Multiparametric estimation of brain hemodynamics with MR fingerprinting ASL. Magn Reson Med. 2017 Nov;78(5):1812-1823. doi: 10.1002/mrm.26587.
2. Fan A., Guo J., Khalighi M., Gulaka P., Shen B., Park J.H., Gandhi H., Holley D., Rutledge O., Singh P., Haywood T., Steinberg G., Chin F., Zaharchuk G. Long-Delay Arterial Spin Labeling Provides More Accurate Cerebral Blood Flow Measurements in Moyamoya Patients. Stroke. 2017;48(9):2441-2449
3. Donahue M., Strother M., Lindsey K., Hocke L., Tong Y. and Frederick B. Time delay processing of hypercapnic fMRI allows quantitative parameterization of cerebrovascular reactivity and blood flow delays. Journal of Cerebral Blood Flow & Metabolism 2016;36:1767–1779
4. Hendrikse J, Petersen ET, Golay X. Vascular disorders: insights from arterial spin labeling. Neuroimaging Clin N Am. 2012 May;22(2):259-69, x-xi.
5. C. Heyn, J. Poublanc, A. Crawley, D. Mandell, J.S. Han, M. Tymianski, K. terBrugge, J.A. Fisher and D.J. Mikulis. Quantification of Cerebrovascular Reactivity by Blood Oxygen Level–Dependent MR Imaging and Correlation with Conventional Angiography in Patients with Moyamoya Disease. American Journal of Neuroradiology 2010;31:862–867
Figures