2046
MP2RAGE, enhanced T1 contrast and beyond1Center for Biomedical Imaging Research, Department of Biomedical Engineering, School of Medicine, Tsinghua University, Beijing, China, 2Epilepsy Center, Tsinghua University Yuquan Hospital, Beijing, China, 3School of Computer Science and Technology,Beijing Institute of Technology, Beijing, China, 4Vascular Imaging Laboratory, Department of Radiology, University of Washington, Seattle, WA, United States
Synopsis
MP2RAGE has been modified to acquire two image volumes that can be used to suppress the signals from white matter and CSF respectively. In this study, we show that based on the two intrinsically co-registered volumes, enhanced T1 contrast images compared to traditional MPRAGE images as well as other contrasts such as gray matter image and angiogram can be generated using simple post-processing.
Introduction
MP2RAGE1 has been modified to acquire two image volumes that can be used to suppress the signals from white matter (WM) and CSF, respectively2. In this study, we show that based on the two intrinsically co-registered volumes, enhanced T1 contrast images compared to traditional MPRAGE images as well as other contrasts such as gray matter image and angiogram can be generated using simple post-processing.Methods
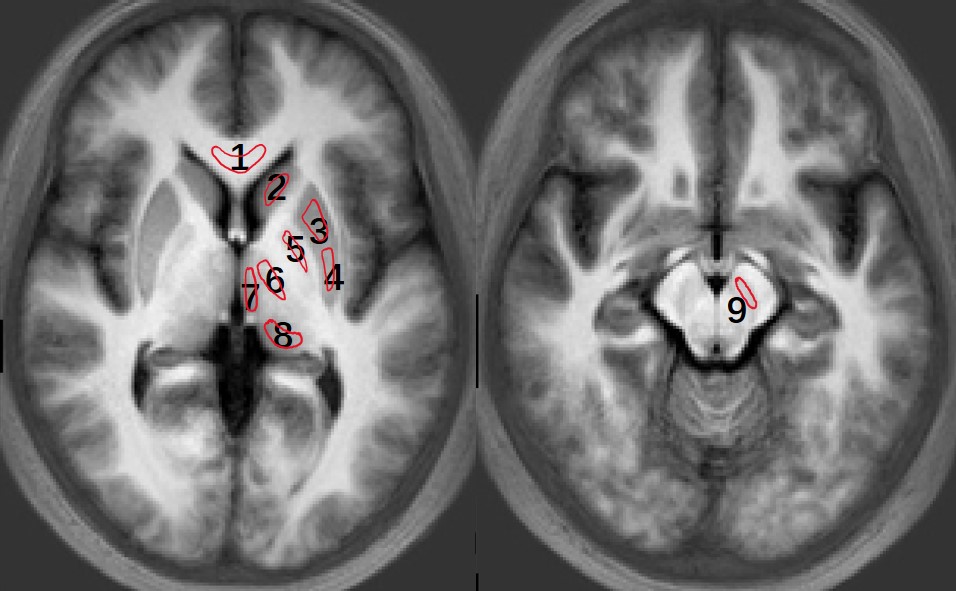
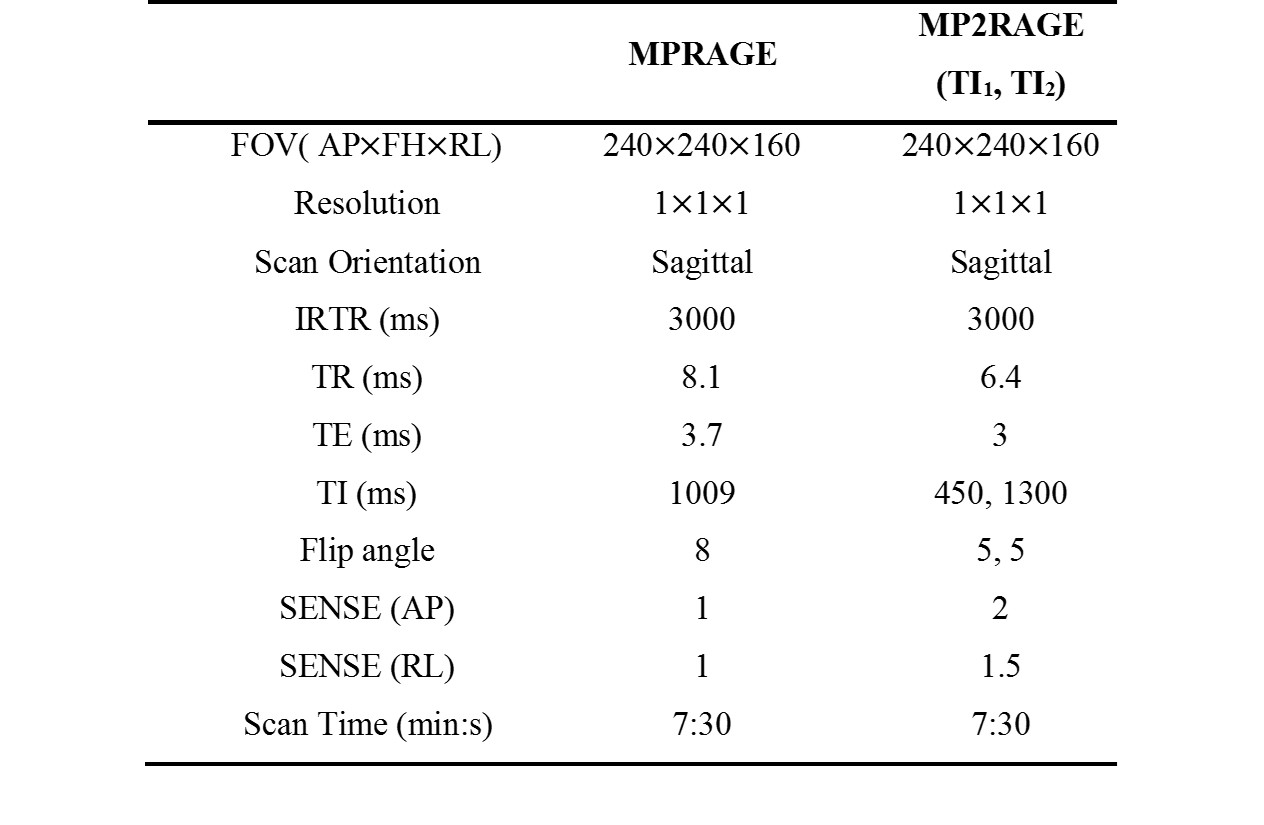
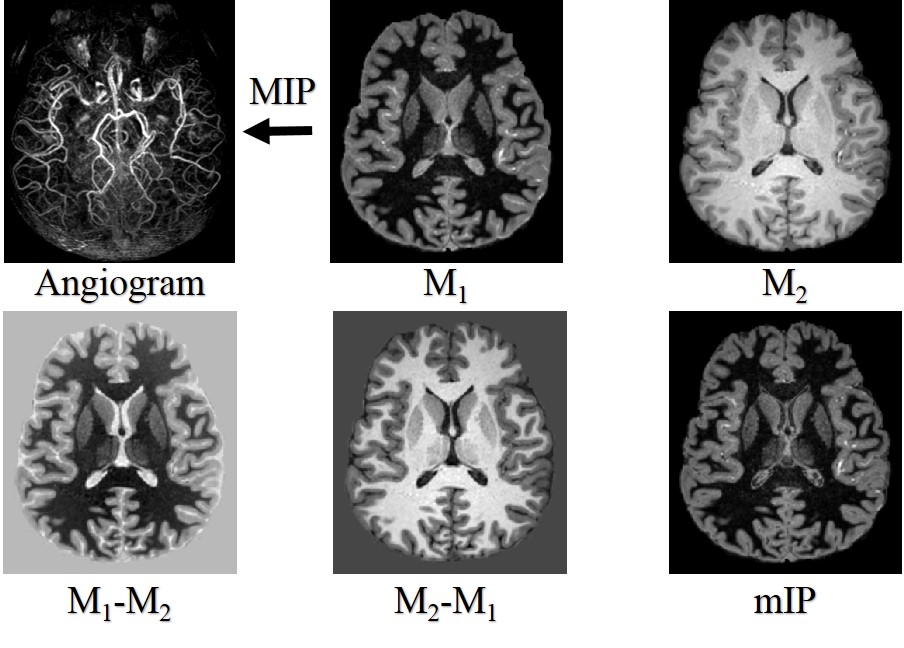
The MP2RAGE sequence was implemented on a Philips 3T scanner. The sequence parameters were optimized to suppress WM in the first volume (M1) and CSF in the second (M2)2. 3D MP2RAGE and T1 weighted MPRAGE images were acquired using a 32 channel head coil with radio frequency (RF) parallel transmission3 and RF shimming (See Table 1 for detailed parameters). Twelve volunteers were recruited (9 males and 3 females, age 23-62y, mean 36.9y). This study was IRB approved and written informed consent was obtained from all participants. For each subject, an enhanced T1 contrast volume was generated simply by enh_T1 = M2 - M1. To compare the contrast ratio (CR) and contrast to noise ratio (CNR), both enh_T1 and the MPRAGE volume of each subject were normalized to the Montreal Neurological Institute (MNI) space using SPM12. The mean of the normalized enh_T1 from all the subjects was used to select 8 gray matter (GM) ROIs (caudate head, anterior and posterior putamen, globus pallidus, lateral and medial thalamus, pulvinar and substantia nigra) and one WM ROI (genu of corpus callosum, GCC) for CR and CNR quantification, as shown in Figure 1. For each ROI, CR=|(mean of ROI) – (mean of GCC)| / (mean of GCC) * 100, CNR=|(mean of ROI) – (mean of GCC)| / (standard deviation of GCC). The CRs and CNRs were compared between MPRAGE and enh_T1 using a paired t-test. The maximum intensity projection (MIP) of M1 was used to generate an angiogram, the minimum intensity projection (mIP) of M1 and M2 was used to generate a GM image. In addition, the twin of enh_T1, i.e. M1-M2 was also calculated.Results
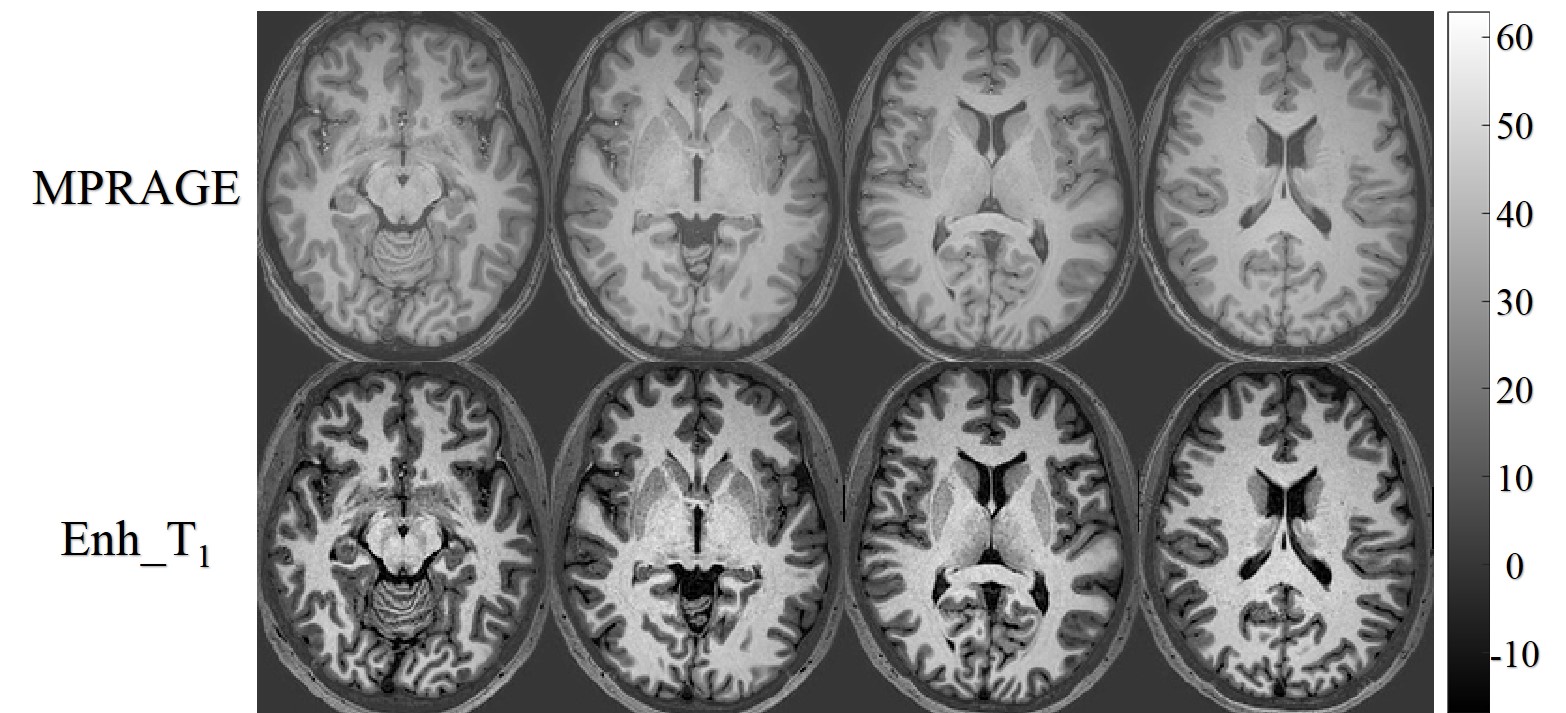
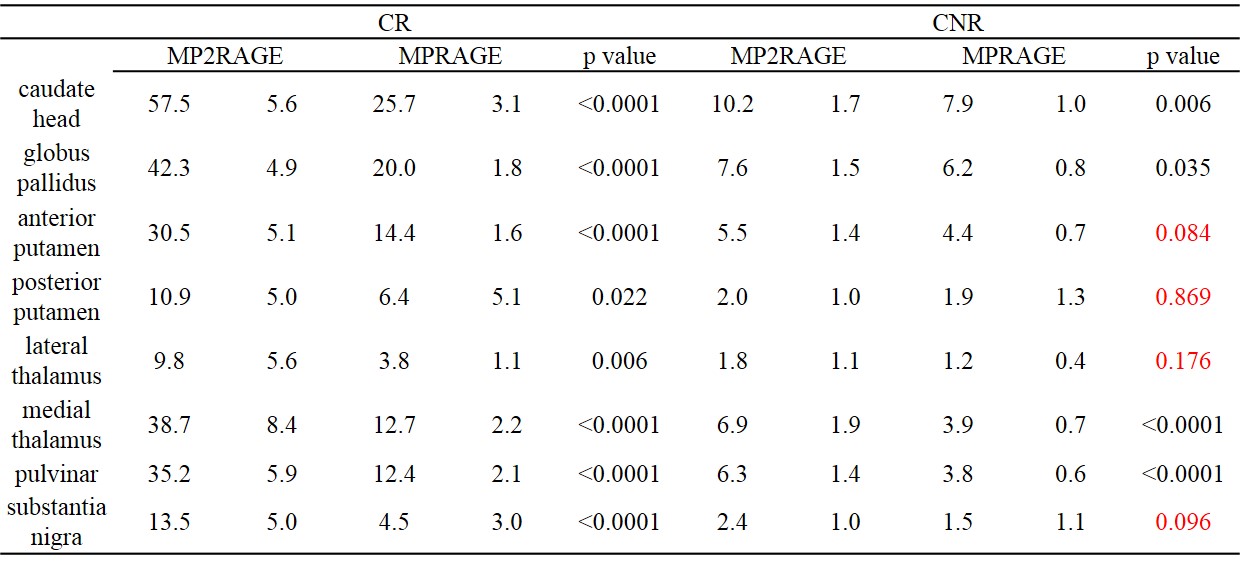
Figure 2 demonstrates the MPRAGE images and enh_T1 images from one subject in the MNI space. The signal intensity of both MPRAGE and Enh_T1 was normalized by their maximum intensity respectively and the same window width and level were used in Figure 2. By visual inspection, enh_T1 had better tissue contrast than MPRAGE. The mean and standard deviation of CR and CNR as well as the Holm-Bonferroni corrected p values are summarized in Table 1. For all GM ROIs, the CR of enh_T1 was significantly higher than that of MPRAGE. For CNR, only four ROIs showed significantly difference. Figure 3 shows all the image contrasts from MP2RAGE.Discussion and Conclusion
This study shows the possibility of generating enhanced T1 weighted images with simple post-processing based on MP2RAGE as well as other possible contrasts such as GM image and angiogram. The multiple contrasts may be beneficial to applications such as segmentation and lesion detection and renders this technique versatile compared to the traditional MPRAGE.Acknowledgements
No acknowledgement found.References
1. Marques JP, Kober T, Krueger G, van der Zwaag W, Van de Moortele P-F, Gruetter R. MP2RAGE, a self bias-field corrected sequence for improved segmentation and T1-mapping at high field. NeuroImage 2010;49(2):1271-1281.
2. Tanner M, Gambarota G, Kober T, Krueger G, Erritzoe D, Marques JP, Newbould R. Fluid and white matter suppression with the MP2RAGE sequence. Journal of Magnetic Resonance Imaging 2012;35(5):1063-1070.
3. Katscher U, Börnert P. Parallel RF transmission in MRI. NMR in Biomedicine 2006;19(3):393-400.
Figures