2045
Comparison Study between Quantitative Susceptibility Mapping and CT1Department of Diagnostic Radiology and Nuclear Medicine, Graduate School of Medicine, Kyoto University, Kyoto, Japan, 2Human Brain Research Center, Graduate School of Medicine, Kyoto University, Kyoto, Japan
Synopsis
Quantitative susceptibility mapping (QSM) is a technique which can provide quantitative values of magnetic susceptibility. In this study, we compared magnetic susceptibility values with computed tomography (CT) numbers of brain structures and intracranial lesions in 30 subjects. QSM was able to differentiate between paramagnetic and diamagnetic substances. Susceptibility values showed positive correlations with CT numbers in globus pallidus and lesions with positive susceptibility, and negative correlations in choroid plexus and lesions with negative susceptibility.
Introduction
Quantitative susceptibility mapping (QSM) is a post-processing technique that uses phase images of gradient echo imaging to provide quantitative measures of magnetic susceptibility. QSM enables differentiating paramagnetic lesions such as iron and deoxyhemoglobin from diamagnetic lesions such as calcification 1, 2 . The aim of this study is to assess the relationship between QSM and computed tomography (CT), which is one of the quantitative imaging methods.Methods
Subjects
This study was approved by the institutional review board. We retrospectively enrolled 12 patients and 18 healthy elderly volunteers (13 males and 17 females; mean age 66, range 18-85 years) who underwent both CT and multi-echo gradient echo magnetic resonance (MR) imaging (mean interval between CT and MR imaging, 96.7 days; range, 0 day-2.3 years). The underlying diseases of the patients were as follows: intracranial neoplasm (n = 7), neurodegenerative disease (n = 4), and brain aneurysm (n = 1).
Image Acquisition
MR imaging
Three-dimensional gradient echo imaging was acquired on 3T MR scanners (Magnetom Skyra, Siemens Healthcare GmbH, Erlangen, Germany) with 32-channel head coils. Imaging parameters were as follows: repetition time (TR)/echo time (TE)/echo spacing (ΔTE), 44 ms/3.6-39.1 ms/5.92 ms; field of view, 240×240 mm; resolution, 0.9×0.9×1.0 mm; and acquisition time, 5 min 3 sec.
CT
CT was performed with 64-, 80-, and 320- detector CT scanners (Aquilion, Aquilion PRIME, and Aquilion ONE, respectively, Toshiba Medical Systems Corporation, Otawara, Japan). Parameters for patients were as follows: helical acquisition; beam pitch, 0.825; X-ray tube current, 150-300 mA; exposure, 150-300 mAs; filter type, SMALL; and exposure time, 750-1000 ms. For volunteers, wide-volume acquisition with relatively low exposure dose was used.
Post-imaging Procedure
QSM
QSM calculation was conducted using STI Suite version 2.2 (http://people.duke.edu/~cl160/). Phase mask images were generated from magnitude images by threshold for background phase removal. For phase unwrapping and background phase removal, a sophisticated harmonic artifact reduction for phase data (SHARP) method with a variable radius of the spherical kernel at the brain boundary (V-SHARP) was conducted, and then QSM was calculated from each local tissue phase by solving an inverse problem using the iLSQR method.
Fusion
CT images were co-registered to QSM images using fusion function of Syngo workstation (Siemens Healthcare GmbH).
ROI
Regions of interest (ROIs) were manually placed on QSM images and applied to CT images. These regions included putamen (PT), globus pallidus (GP), caudate nucleus (CN), internal capsule (IC), substantia nigra (SN), red nucleus (RN), dentate nucleus (DN), choroid plexus (CP), and pathological lesions. The mean susceptibility values and CT numbers were measured. The mean value of right and left lateral ventricles was subtracted from each ROI value as reference.
Statistics
The correlation of susceptibility values and CT numbers was assessed using linear regression.
Results
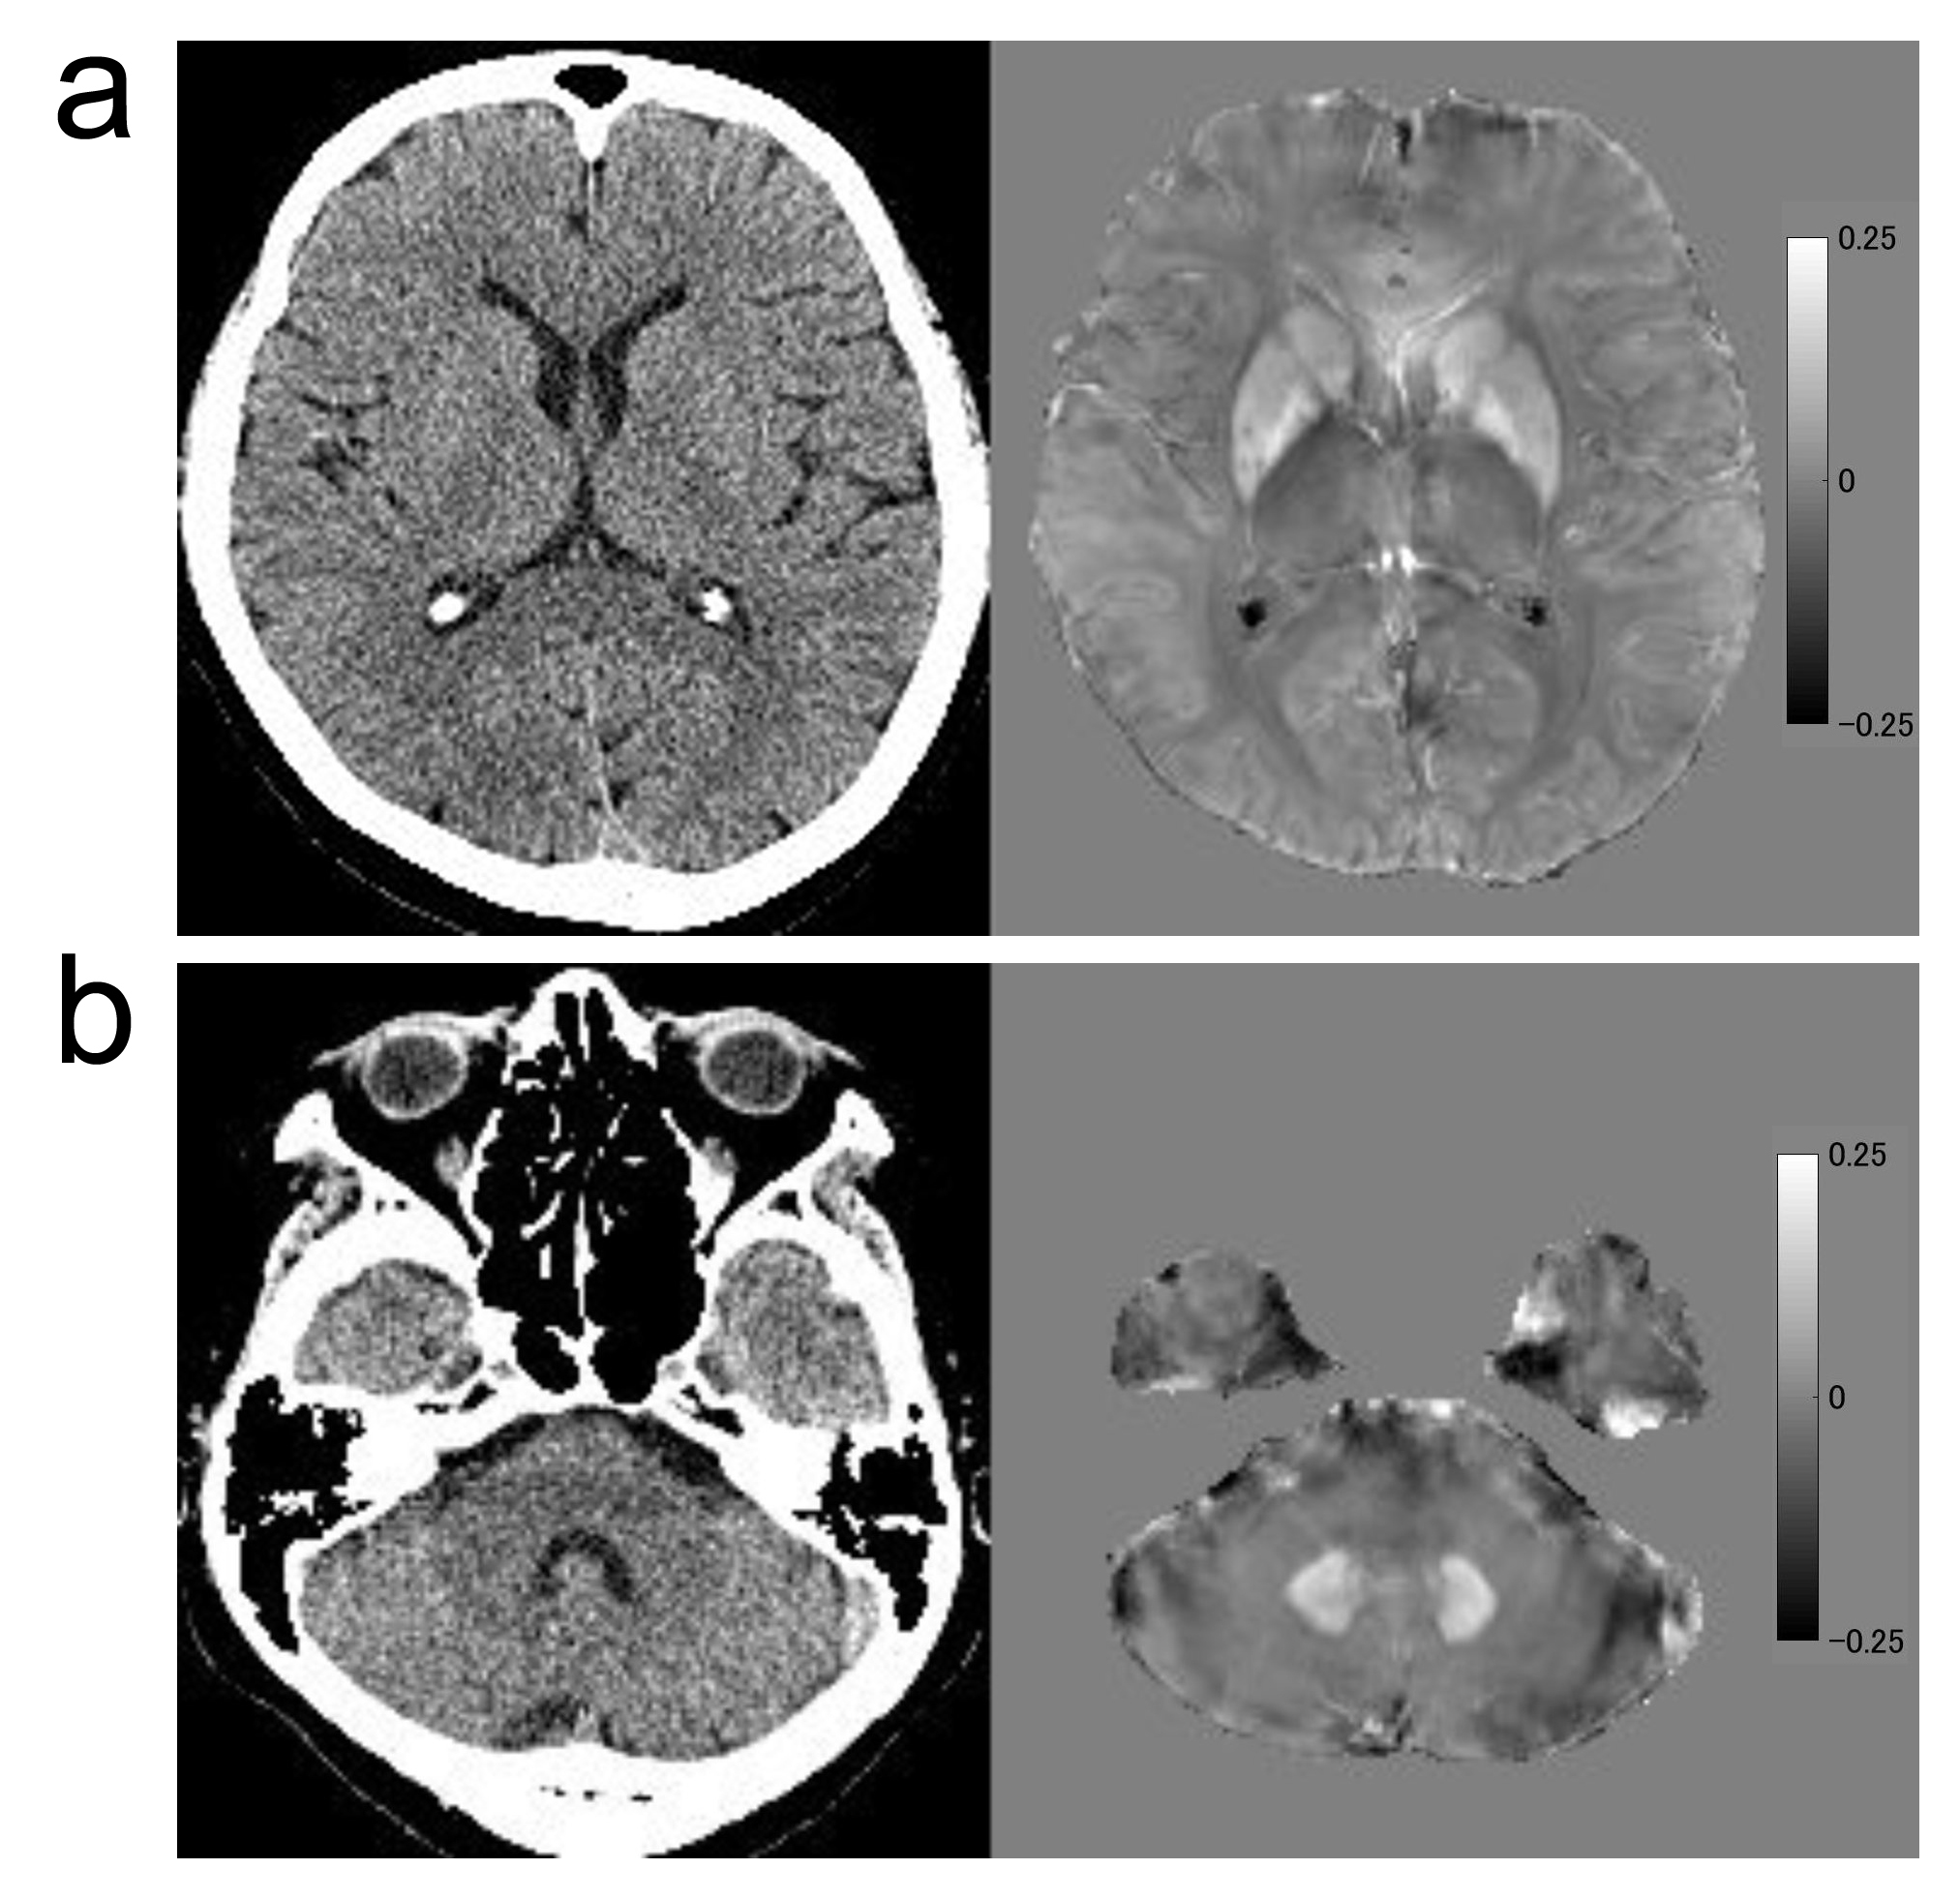
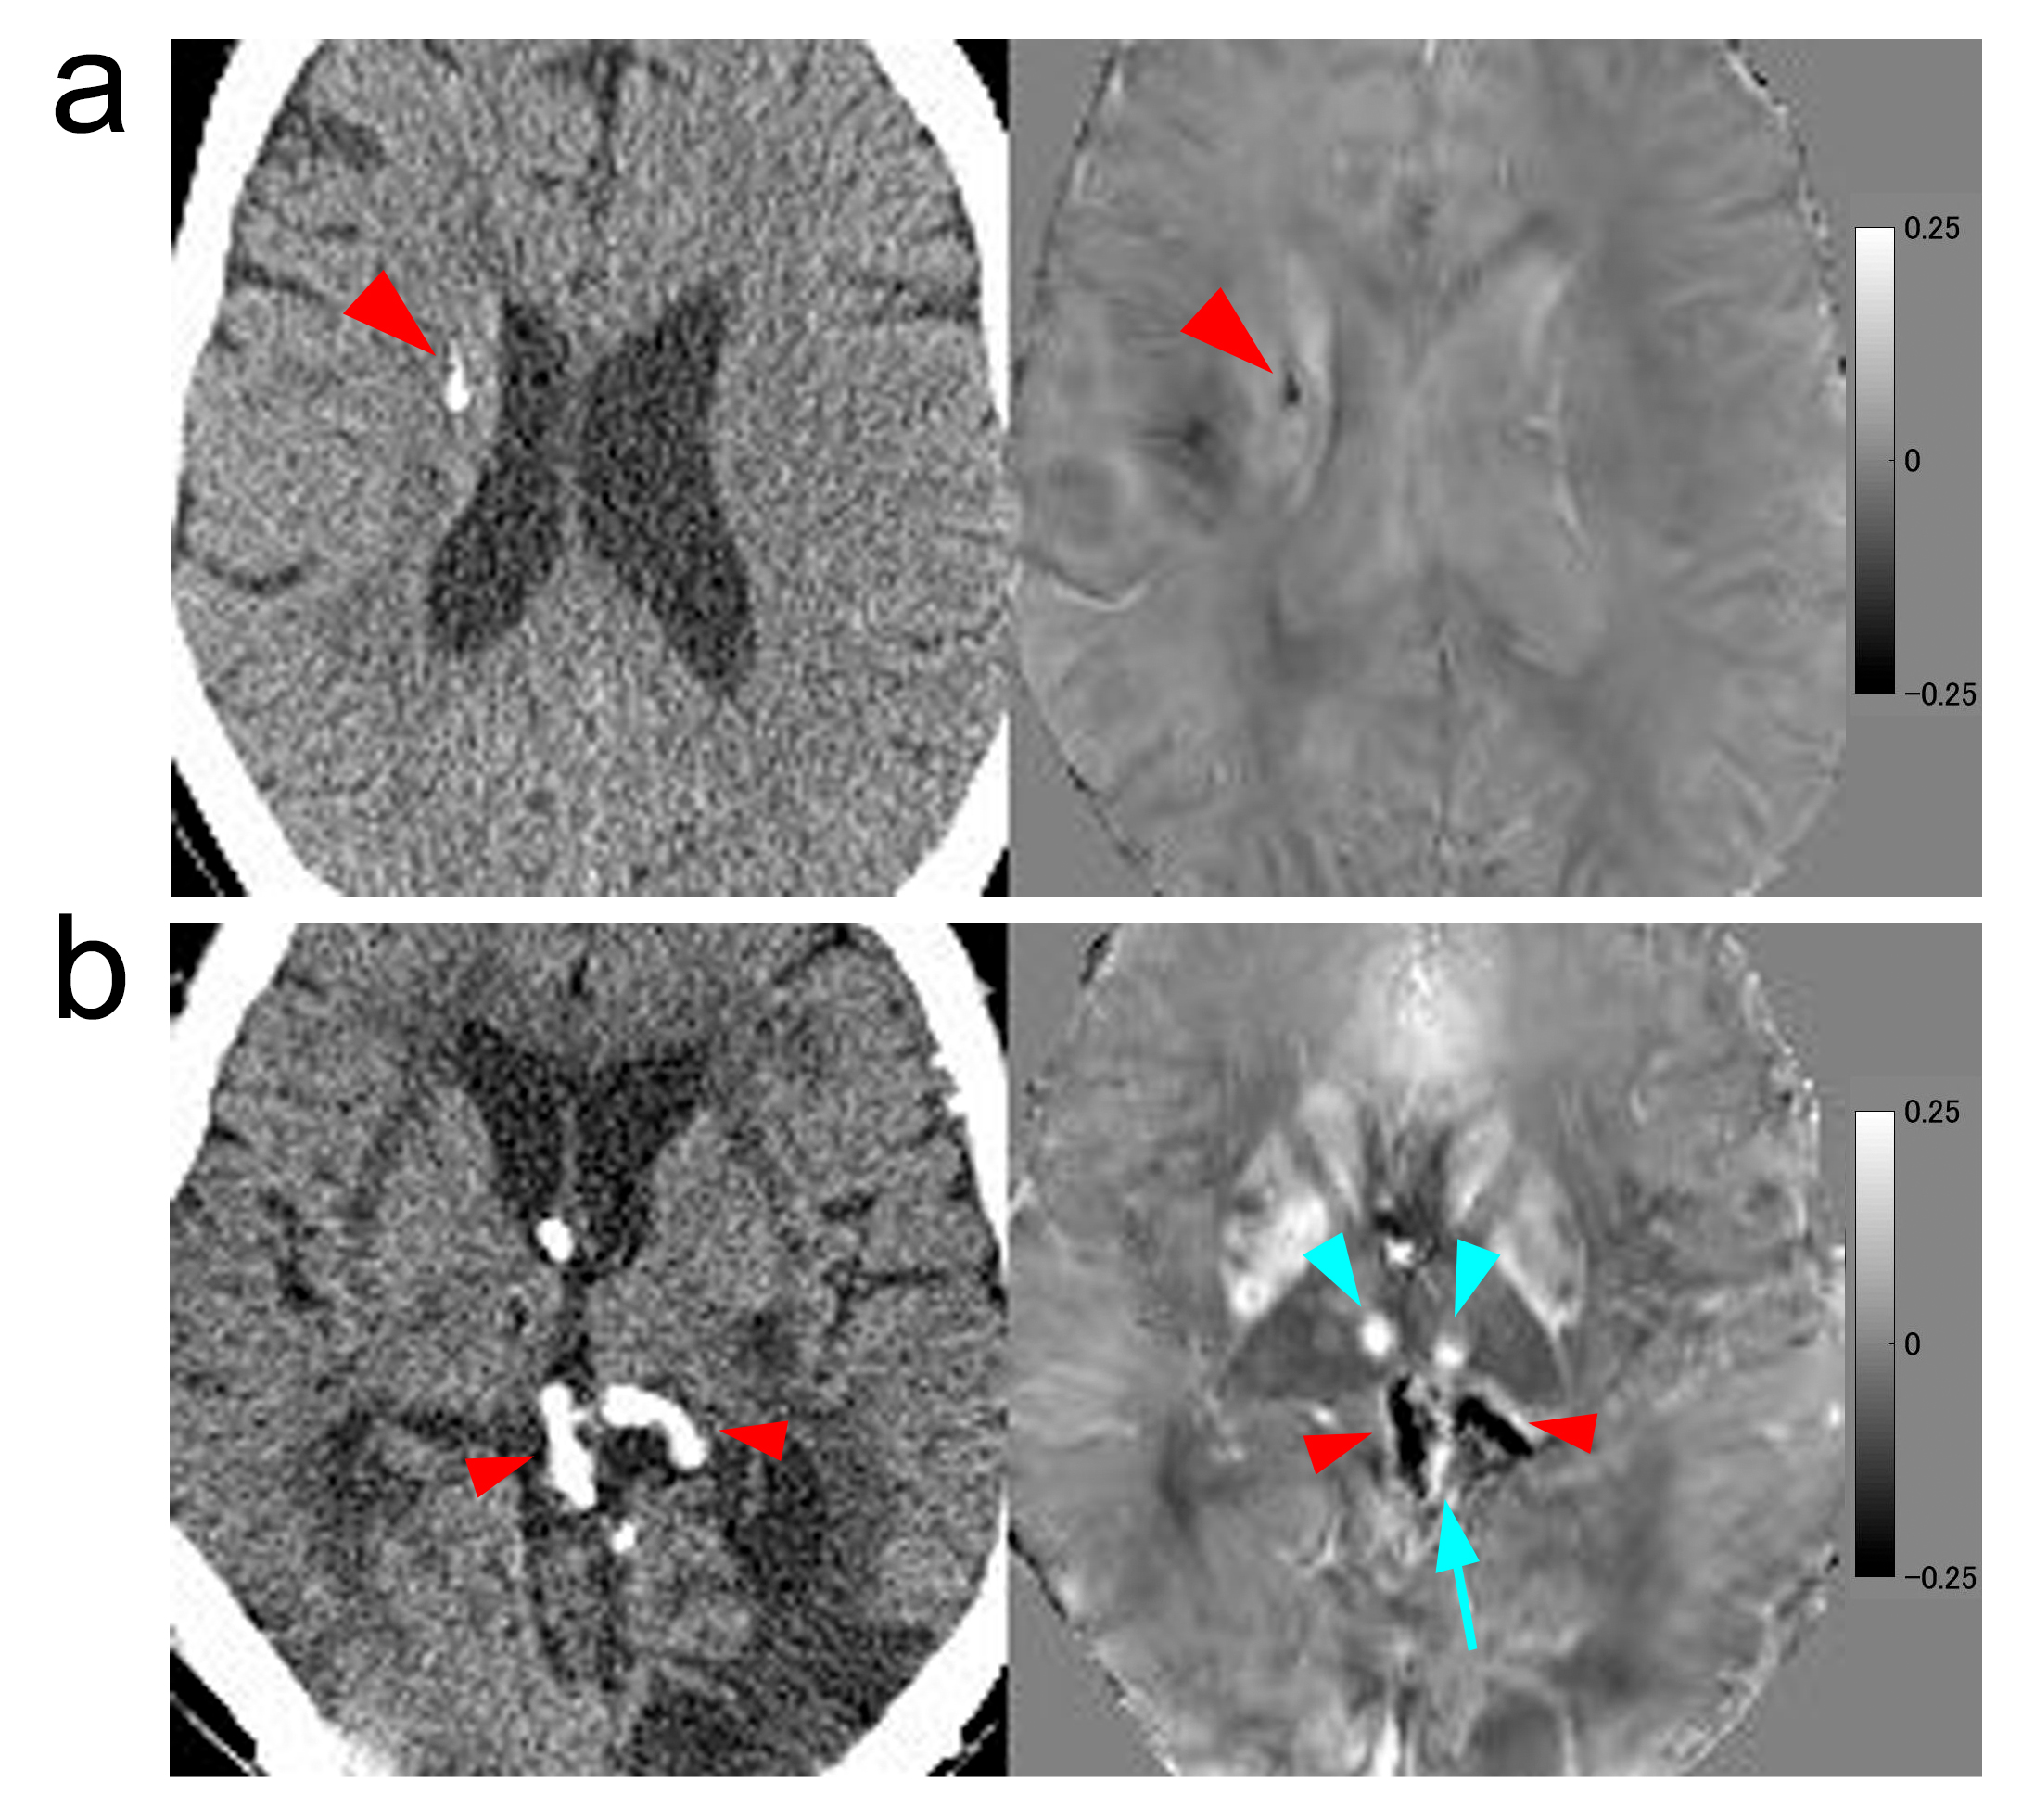
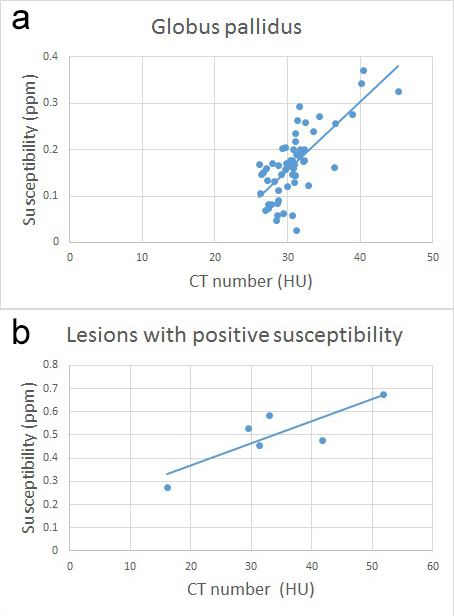
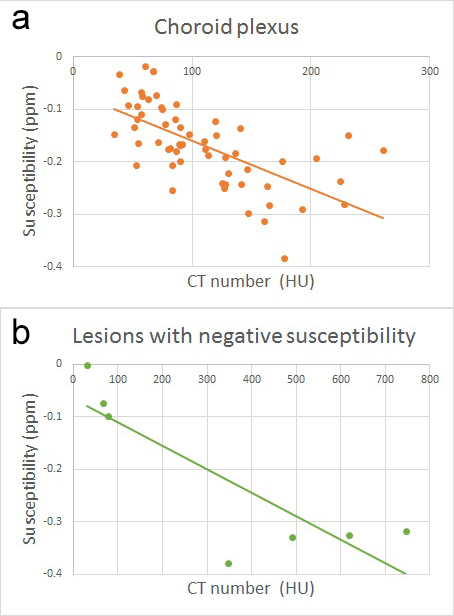
Representative images are shown in Figure 1 and 2. There were 6 lesions with positive susceptibility (3 metastatic brain tumors with hemorrhage and 3 chronic hemorrhagic lesions) and 7 lesions with negative susceptibility (4 calcified lesions associated with tumors, 2 intracranial tumors, and 1 calcified aneurysmal wall). Susceptibility values showed positive correlations with CT numbers in GP (R2 = 0.52) and in lesions with positive susceptibility (R2 = 0.71) (Figure 3). Negative correlations were seen in CP (R2 = 0.41) and in lesions with negative susceptibility (R2 = 0.71) (Figure 4). No significant correlation was observed in other ROIs.Discussion
Our result showed a significant correlation between susceptibility and CT numbers in GP (R2 = 0.52), which is consistent with the previous findings that the highest amount of iron deposition was found in GP3-6. All of the lesions with positive susceptibility were hemorrhagic ones, and a significant positive correlation between susceptibility and CT numbers was observed as well (R2 = 0.71). It has been reported that less iron deposition is observed in PT, CN, SN, RN, and DN than GP3-6. These ROIs showed small dispersion in susceptibility values and no significant correlation with CT numbers was found. It is also known that calcification is hyperattenuating on CT and exhibits negative susceptibility on QSM. In this study, CP and most of the lesions with negative susceptibility contained calcification, and negative correlations between susceptibility and CT numbers were seen (R2 = 0.41 and 0.71, respectively).Conclusion
Acknowledgements
We are grateful to Mr. Katsutoshi Murata, Mr. Yuta Urushibata, and Mr. Hirokazu Kawaguchi, Siemens Healthcare Japan K. K., for their kind help.References
1. Chen W, Zhu W, Kovanlikaya I, et al. Intracranial calcifications and hemorrhages: characterization with quantitative susceptibility mapping. Radiology, 2014. 270(2): p. 496-505.
2. Deistung A, Schweser F, Wiestler B, et al. Quantitative susceptibility mapping differentiates between blood depositions and calcifications in patients with glioblastoma. PLoS One 2013;8: e57924.
3. Langkammer, C, Schweser F, Krebs N, et al. Quantitative susceptibility mapping (QSM) as a means to measure brain iron? A post mortem validation study. Neuroimage, 2012. 62(3): p. 1593-9.
4. Drayer B, Burger P, Darwin R, et al. MRI of brain iron. AJR Am J Roentgenol, 1986. 147(1): p. 103-10.
5. Aquino D, Bizzi A, Grisoli M, et al. Age-related iron deposition in the basal ganglia: quantitative analysis in healthy subjects. Radiology, 2009. 252(1): p. 165-72.
6. Li W, Wu B, Batrachenko A, Bancroft-Wu V, et al. Differential developmental trajectories of magnetic susceptibility in human brain gray and white matter over the lifespan. Hum Brain Mapp, 2014. 35(6): p. 2698-713.
Figures