2044
Magnetic Resonance Electrical Impedance Tomography in Salamander Retina Neuronal Activity Imaging1Arizona State University, Tempe, AZ, United States
Synopsis
Magnetic resonance electrical impedance tomography (MREIT) is an innovate potential technique for imaging neural activity. To test its capability, we used salamander retina as a neuronal activity source. The neuronal activity activation was modulated by light, which enables us to compare the result between with and without neuronal activity. After obtained phase images, we expected that the standard deviation of phase in the region of interest (ROI) for the experiment group with neuronal activity is higher than that for the group without activity.
Introduction
Functional Magnetic resonance electrical impedance tomography (fMREIT) is a novel neural activity imaging technique1,2,3. The technique requires application of small electrical currents to tissue. Any conductivity changes in cell membranes during neural activity should be reflected in current flow patterns, causing differential phase accumulation in MR images. The salamander retina was used as a neural activity source in this study. We observed spiking in the retina around the onset of light exposure, in a benchtop experiment where retina activity was monitored using microelectrode arrays. Therefore, we performed experiments where imaging currents were applied synchronously with a light stimulus, and compared these images with those collected without light stimulus, to determine if this activity could be detected in fMREIT phase images.Methods
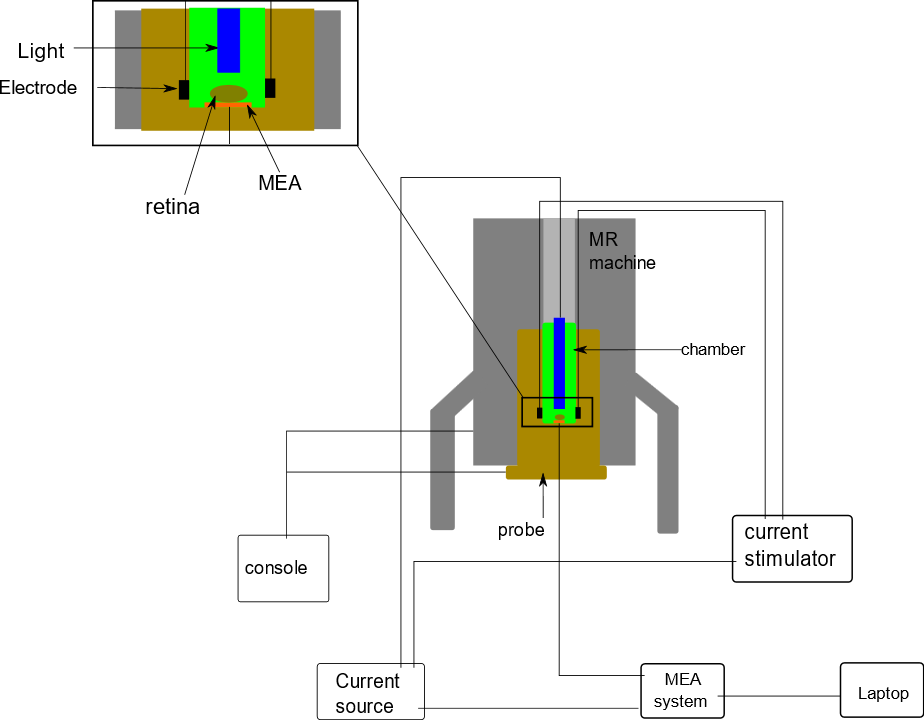
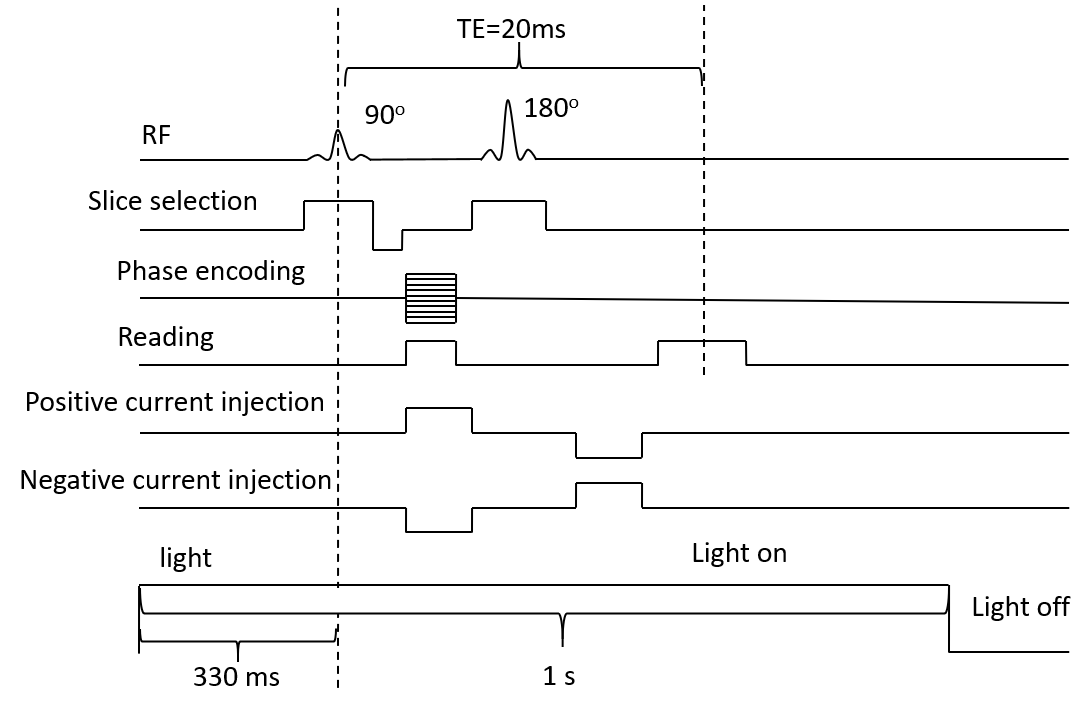
Salamander retina dissection was performed under dim red light to prevent the retina bleaching. After removal, the retina was placed on a flexible multi-electrode array (flexMEA) (Multichannel Systems, Reutlingen, Germany) within a 3D-printed sample chamber. MC_Rack software was used to record and detect neural activity and spiking rates. After placement of retina, the sample chamber was then placed into an MR imaging probe (Doty Scientific, Columbia, SC), within an 18.8 T VNMRS (800 MHz) system (Fig. 1). The sample chamber had 4 equally-spaced circular carbon electrodes attached to the wall, which were used to apply MREIT currents. MREIT currents were injected via a constant current source (TDT Inc., Alachua, FL) during the experiment, at an amplitude of 200 µA and total pulse width of 18 ms, between opposing pairs of electrodes. During data acquisition, the current injection was synchronized with a multi spin echo MRI sequence2 (Fig. 2). Imaging parameters were TR/TE = 2000/20 ms, FOV = 14 x 14 mm2, slice thickness = 500 μm, NEX = 3, matrix size = 128 x 128 (pixel dimension 109 μm) and number of slices = 1. Each scan took 13 mins to acquire. Retinal illumination with a white LED was triggered by logic signals synchronized to the MREIT current source, such that the light was on for 1 second of each 2-second TR period (Fig. 2). The LED was turned on 330 ms ahead of the 90 RF pulse to ensure that the retina activity peaked as current was injected. The experimental protocol is shown in Figure 3. To examine differences between images with and without light-evoked activity, experiments were split into two sets — the first involving light stimulation and the second without light. fMREIT imaging was interleaved with flexMEA recordings lasting one minute each. The first two of the six scans in each set were obtained with no current injection, two were with current application via electrodes 1 and 3 (separate positive and negative current injection images) and the last two were obtained similarly with current applied to electrodes 2 and 4. MREIT phase images were obtained by complex dividing positive and negative current MRI data. A homogeneous area within the tissue was chosen as region of interest (ROI). The standard deviation of phase within the ROI was calculated and compared.Result
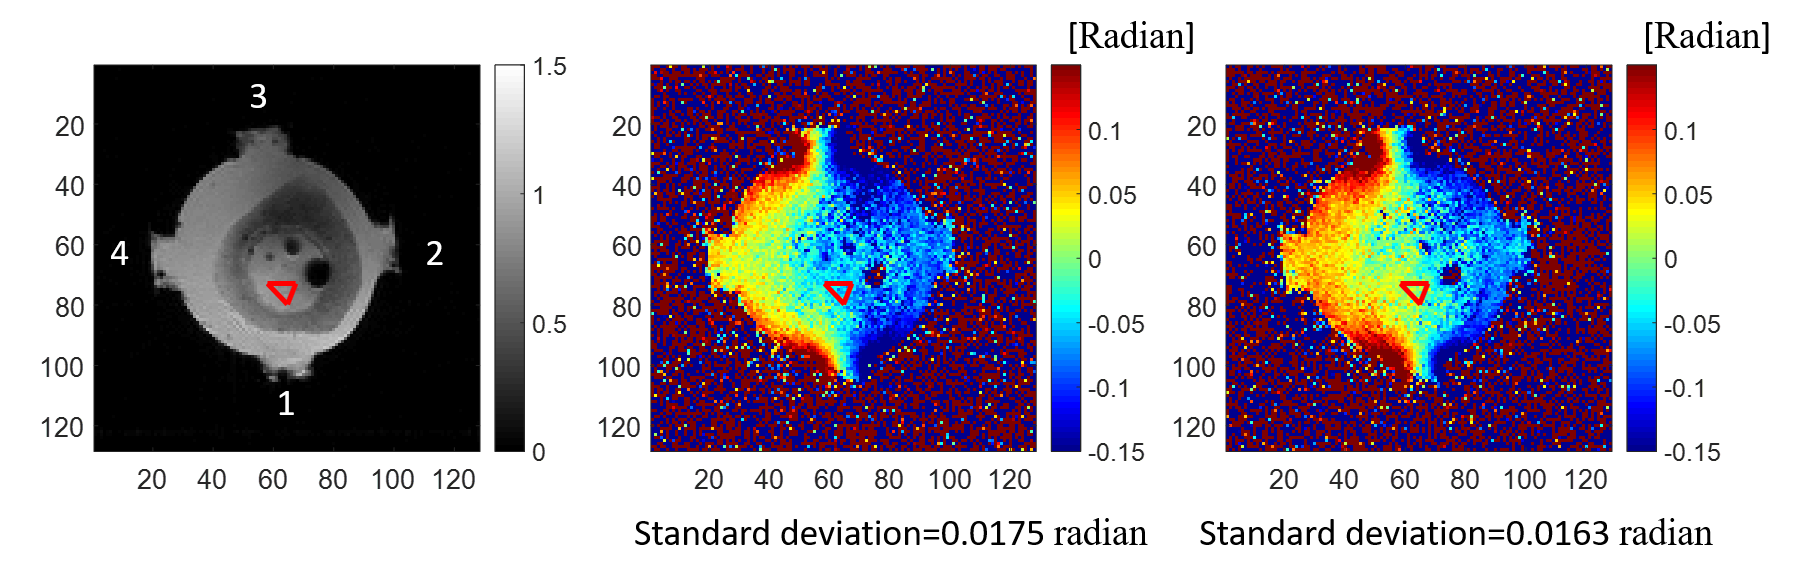
Example results are shown in Figure 4. The phase standard deviation (SD) inside the red triangle was calculated. Because light stimulation activates retina neuronal activity, and this can cause the average membrane conductivity of retina to be more variable. This should be reflected in high phase variation in the subtracted MREIT phase images gathered with light stimulation (Fig. 4 (b)). The ROI SD for the group without light stimulation (Fig. 4 (c)) was lower than that with stimulation, which indicated that there was less phase variation without neuronal activity.Discussion
The phase difference could be caused by conductivity changes in retinal cell membranes. We will use pixel-by-pixel statistical analysis of MR phase data from multiple retina to assess changes in images with and without light stimulation. This will be correlated with MEA recordings of neural activity co-registered with MR images to determine if the results are related to changes in spiking activity levels.Conclusion
MREIT is potentially useful for functional analysis since its contrast directly relates to neuronal activity. Since fMREIT involves current injection, it may be of use in studies involving brain stimulation such as transcranial direct-current stimulation (tDCS) or deep brain stimulation (DBS).Acknowledgements
Research reported in this publication was supported by the NIH-NINDS under Award Number R01NS077004.References
1. Sadleir RJ, Grant S, Woo EJ. Can high-field MREIT be used to directly detect neural activity? Theoretical considerations. NeuroImage 2010;52(1):205-216.
2. Seo JK, Woo EJ. Magnetic resonance electrical impedance tomography (MREIT). SIAM review 2011;53(1):40-68.
3. Sadleir RJ, Fu F, Falgas C, Holland S, Boggess M, Grant SC, Woo EJ. Direct detection of neural activity in vitro using magnetic resonance electrical impedance tomography (MREIT). NeuroImage 2017;161:104-119.
Figures