2043
USING MACHINE LEARNING TO CLASSIFY EARLY STAGES OF COGNITIVE DECLINE FROM TYPICAL AGEING - THE CEREBELLUM MORE THAN JUST A BYSTANDER1Centre for Neuroimaging Sciences, King's College London, London, United Kingdom, 2Advanced Baby Imaging Lab, Memorial Hospital of Rhode Island, Providence, RI, United States, 3Veterans Affairs Medical Center, Providence, RI, United States, 4Neurology, Butler Hospital, Providence, RI, United States, 5Human Behavior and Psychiatry, Warren Alpert Medical School at Brown University, Providence, RI, United States, 6Warren Alpert Medical School at Brown University, Providence, RI, United States
Synopsis
Alzheimer’s disease (AD) is one of the most common forms of dementia, marked by progressively degrading cognitive function. The cerebellum plays a role in AD development, but its predictive contribution to early stages of AD remains unclear. We used MRI machine learning based classification within myelin and grey matter of the whole, anterior and posterior cerebellum and the whole brain, between individuals within the first two early stages of dementia and typically ageing controls. Our findings suggest myelin and grey matter loss in early stages of AD, with distinct patterns of anterior and posterior cerebellar atrophy for each tissue property.
INTRODUCTION
Alzheimer’s disease (AD) is one of the most common forms of dementia, progressively degrading cognitive function and following topographic patterns of grey and white matter atrophy1. Increasing evidence suggests that white matter and myelin alterations occur at the earliest stages of the disease, potentially preceding grey matter changes, and are associated with cognitive decline2. While traditionally focus has been placed on neocortical and hippocampal atrophies, recent evidence has demonstrated that the cerebellum undergoes focal atrophy in concert with interconnected cerebral nodes in both AD and fronto-temporal dementia3. Histopathology studies of AD have found cerebellar amyloid-ß to be affected counter-clock wise during disease progression starting in the posterior cerebellar lobe, paralleling neocortical atrophy staging and associated symptom progression4. However, the role of cerebellar white matter in disease progression and classifying stages of early cognitive decline from typical ageing remain a challenge. We used machine learning based classification to derive anatomical and myelin water fraction images weighted on differences within the whole, anterior and posterior cerebellum as well as the whole brain between individuals within the first two early stages of dementia and typically ageing controls.METHODS
Participants. Forty-three age- and gender-matched participants (15 control: 17 Mild Cognitive Impairment; MCI: 11 Mild/Moderate) were included. Assignment to the healthy, MCI and Mild/Moderate groups was based on Clinical Dementia Rating and Mini-Mental State Exam scores, as well as a clinical interview.
MRI acquisition. MR data was acquired on a Siemens Tim Trio 3T scanner with a 32-channel head RF array. Scanning sequences were based on standardized T1-weighted MP-RAGE anatomical and mcDESPOT myelin water imaging5 Following acquisition, data were visually checked for motion-related artefacts and then a standardised processing pipeline was performed to account for subtle inter-scan motion and create individual myelin water fraction (MWF) maps. MRI analysis. For the whole brain, we used the following steps for analysis: grey and white matter tissue class segmentation, DARTEL registration6 to a common inter-subject space, a DARTEL utility to create Jacobian images. For the cerebellum, we used the following steps for analysis: SPM12's SUIT toolbox7 to isolate the structure; DARTEL registration to SUIT space, a DARTEL utility to create Jacobian images. After applying a thresholded mask created in Matlab to fit whole brain or whole/anterior/posterior cerebellum to exclude extracerebral or extracerebellar voxels, we used a linear support vector machine learning algorithm, implementing the C cost support vector classifier at a fixed value of C=1 throughout all classifications. Using freely available Matlab code (https://github.com/leonaksman/lpr), we created Jacobian weighted images, forward maps, as well as p and t thresholded maps at p≤.005.
RESULTS
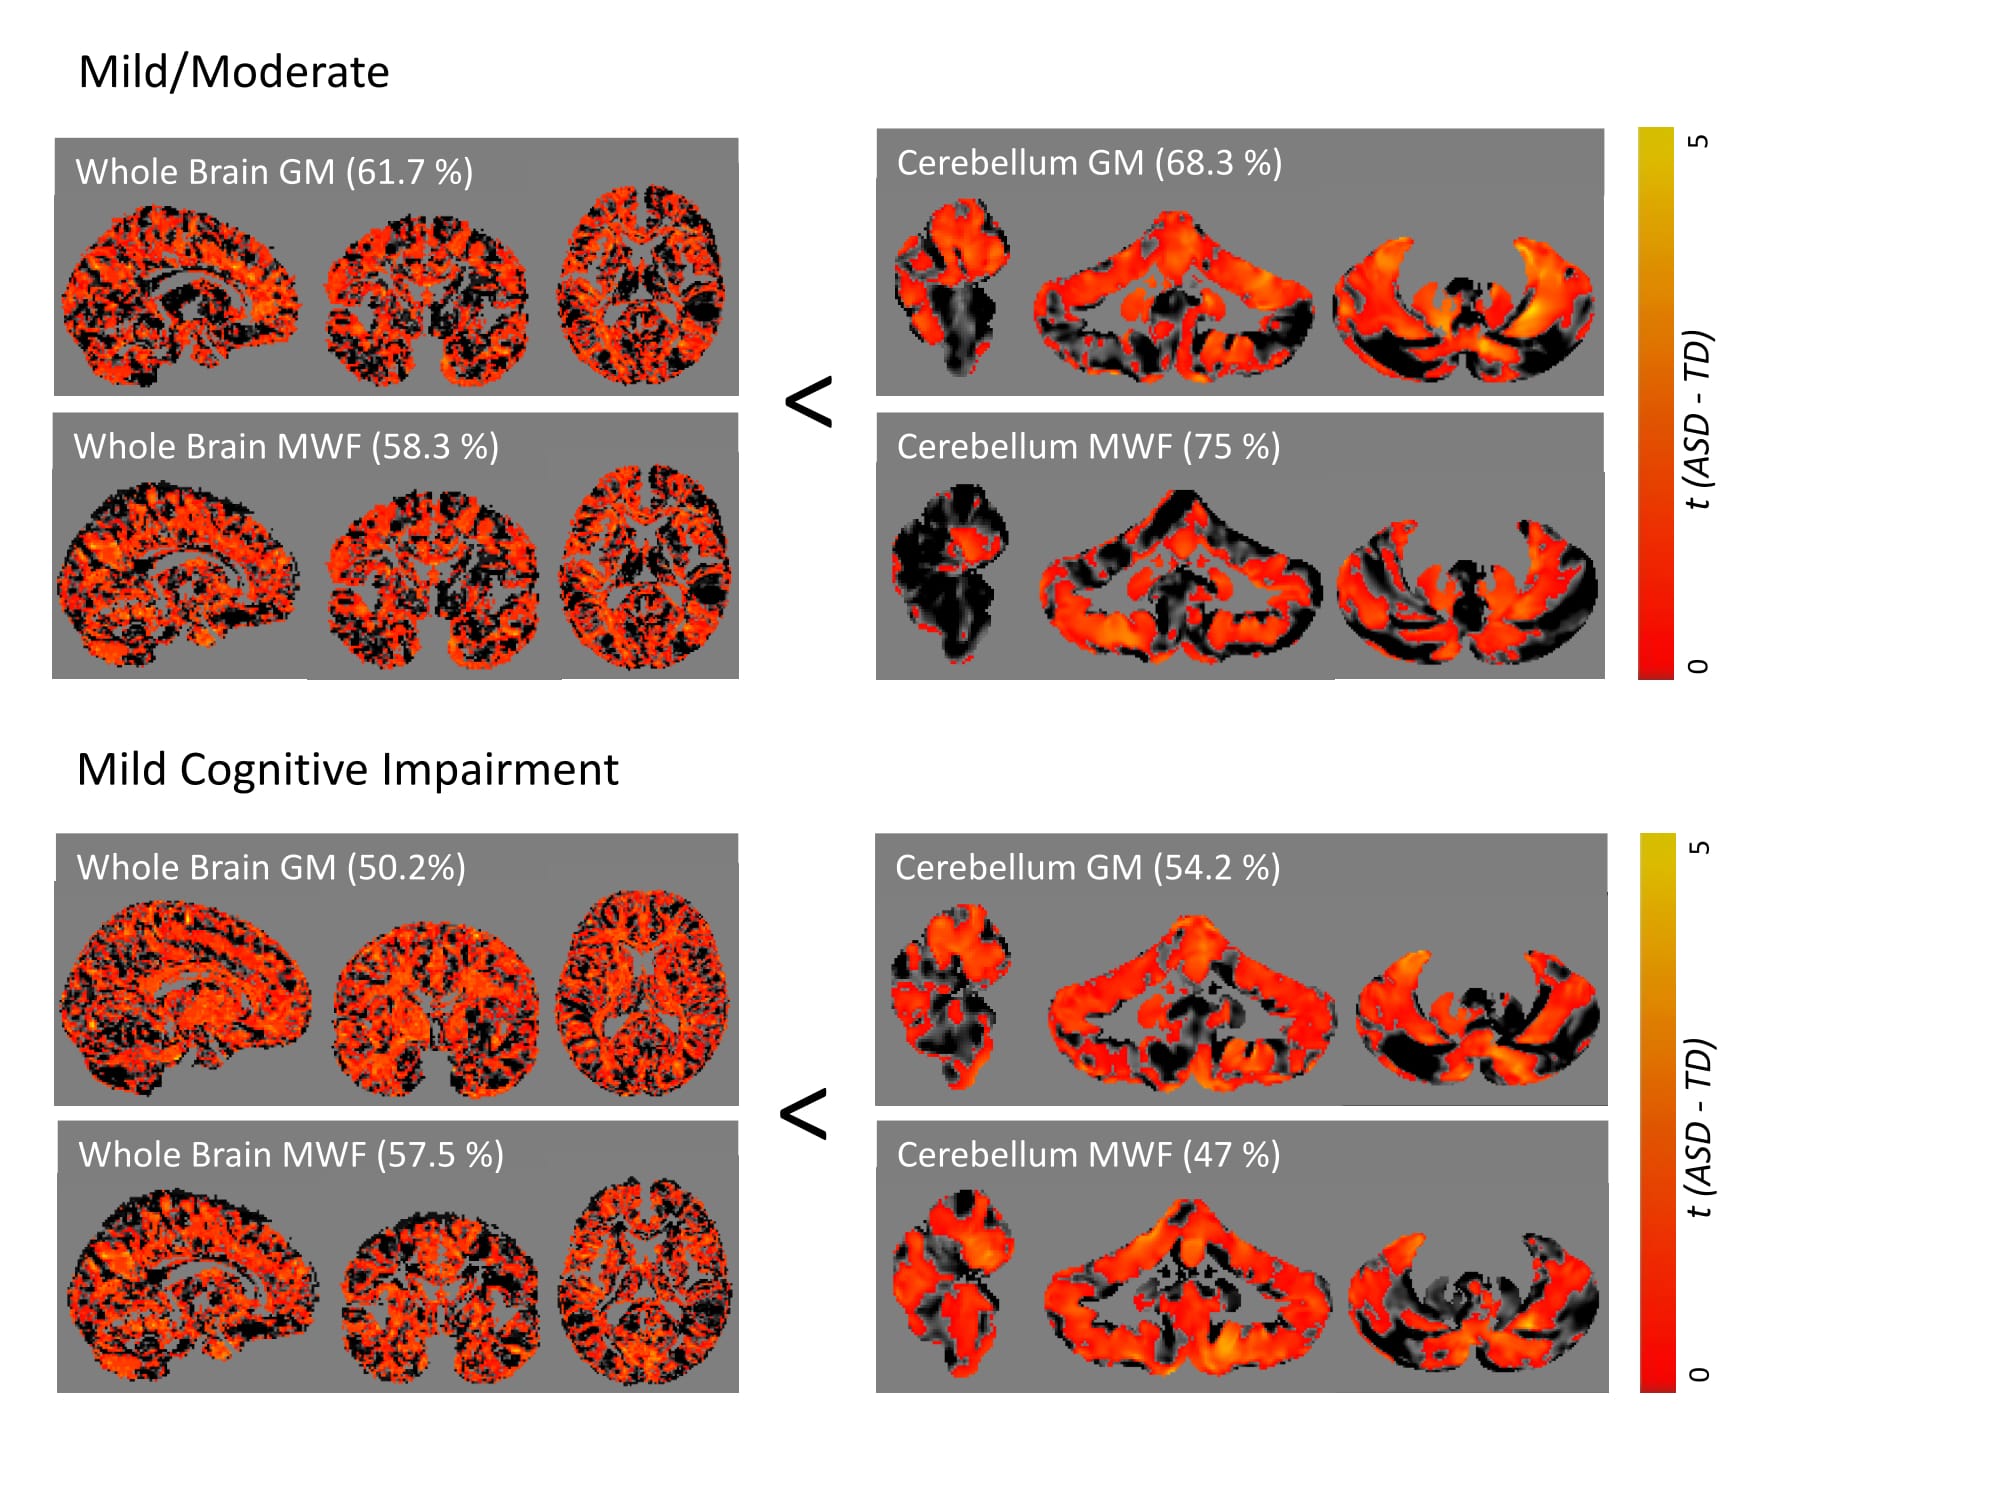
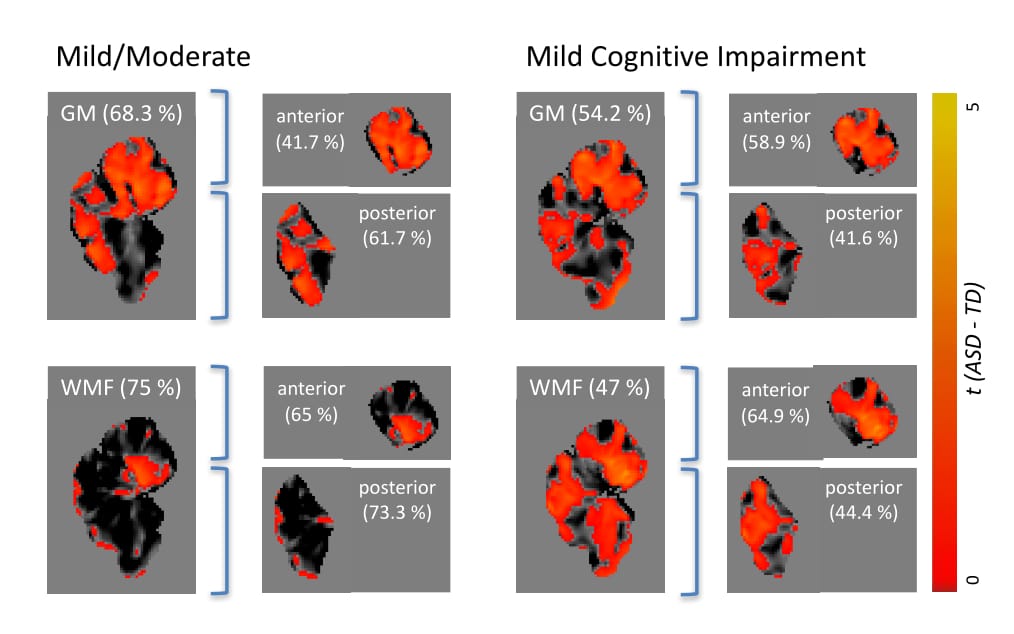
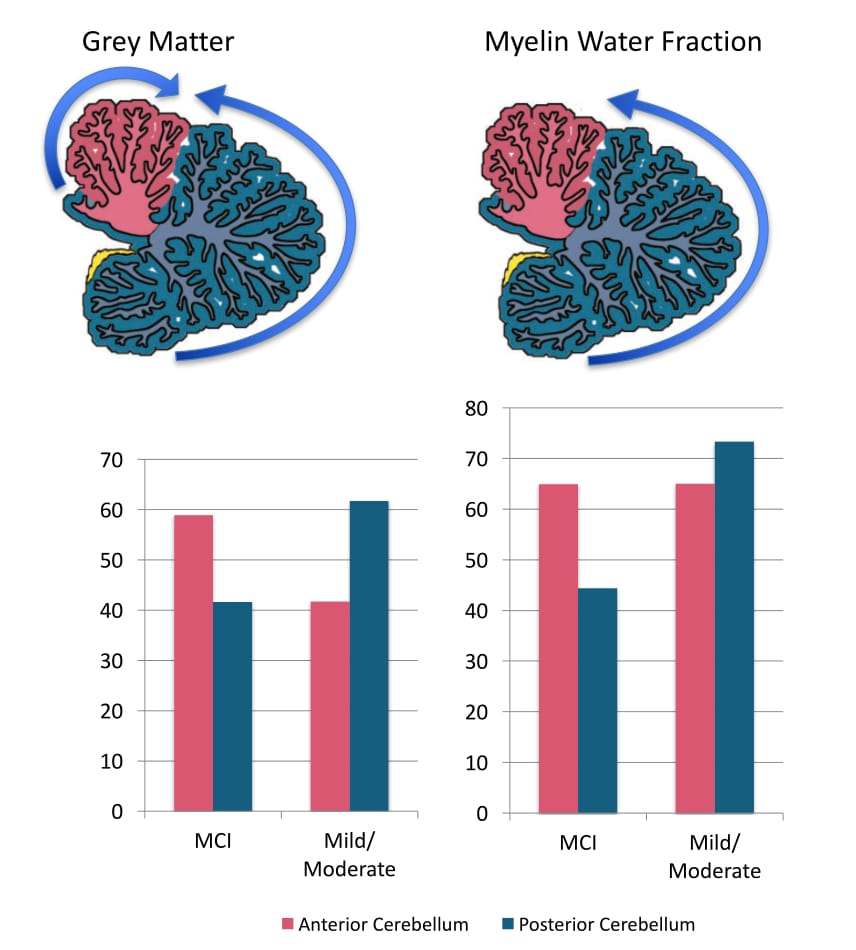
The cerebellum as a region of interest displayed up to 18% increase in classification accuracy when compared with the whole brain (all results thresholded at p≤.005, Figure 1). While classification accuracy increased with staging, WMF was the best predictor for all early stages of dementia when compared with typically ageing controls. When dividing the cerebellum into its anterior and posterior lobe, the posterior cerebellar contribution increased in both grey matter and MWF (Figures 2, 3). These changes were strongest in the Crus I/II (Figure 2).DISCUSSION
Our findings suggest MWF and grey matter loss occur in early stages of AD, with distinct patterns of anterior and posterior cerebellar atrophy for each tissue property (Figure 3). Specifically, disease classification was driven by differences in the posterior cerebellum with its prediction accuracy increasing with symptom severity, paralleling histopathological findings of cerebellar amyloid-ß staging4. This was coupled with a reverse contribution in the anterior cerebellar grey matter (Figures 1, 2). The degree of cerebellar amyloid-ß is negatively correlated with age of onset, resulting in early-onset patients demonstrating cerebellar pathology 30 years earlier than sporadic patients8, which indicates cerebellar atrophy as a possible biomarker for early stages of dementia. While our cerebellar findings seem to mirror histopathological findings, it remains unclear whether this pattern corresponds to microtissue changes and should be followed up by histopathology. Furthermore, as MWF demonstrated the highest prediction accuracy, our findings underline the role of myelin alterations at the earliest stages of dementia, possibly preceding those in grey matter. While the presented cross-sectional data is unable to determine the predictive validity of our findings, we expect further clarification of longitudinal changes on the disease time-course and in relation to other on-going pathology from planned longitudinal data.CONCLUSION
Using MRI, we were able to non-invasively identify distinct patterns of brain atrophy that contribute to early disease classification, which in turn can help detangle typical ageing from early dementia stages, a process that has been challenging in clinical day-to-day practice.Acknowledgements
No acknowledgement found.References
1. Serra, L., Cercignani, M., Lenzi, D., Perri, R., Fadda, L., Caltagirone, C., Macaluso, E., Bozzali, M. (2010). Grey and white matter changes at different stages of Alzheimer’s disease. J Alzheimer’s Dis., 19(1); 147-159.
2. Braak, H., Del Tredici, K., Schultz, c., Braak, E. (2000). Vulnerability of select neuronal types to Alzheimer’s disease. Annals of the New York Academy of Sciences, 924, pp.53–61.
3. Guo, C.C., Tan, R., Hodges, J.R., Hu, X., Sami, S., Hornberger, M. (2016). Network-selective vulnerability of the human cerebellum in Alzheimer’s disease and frontotemporal dementia. Brain, 139; 1527-1538.
4. Jacobs, H.I.L, Hopkins, D.A., Mayrhofer, H.C., Bruner, E., van Leeuwen, F.W., Raaijmakers, W., Schmahmann, J.D. (2017). The cerebellum in Alzheimer’s disease: evaluating its role in cognitive decline. Brain, 1; 1-11.
5. Deoni, S. C. L. et al. Standardized structural magnetic resonance imaging in multicentre studies using quantitative T1 and T2 imaging at 1.5 T. NeuroImage 40, 662–671 (2008).
6. Ashburner, J. A fast diffeomorphic image registration algorithm. NeuroImage 38, 95–113 (2007).
7. Diedrichsen, J., Balsters, J. H., Flavell, J., Cussans, E. & Ramnani, N. A probabilistic MR atlas of the human cerebellum. NeuroImage 46, 39–46 (2009).
8. Cole, G., Neal, J.W., Singhrao, S.K., Jasani, B., Newman, G.R. (1993). The distribution of amyloid plaques in the cerebellum and brain stem in Down’s syndrome and Alzheimer’s disease: a light microscopical analysis. Acta Neuropathol, 85; 542-552.
Figures