2042
Quantitative assessment of automatic cortical surface reconstructions from Wave-CAIPI MPRAGE: A validation study1Siemens Medical Solutions USA, Boston, MA, United States, 2A. A. Martinos Center for Biomedical Imaging, Radiology, MGH, Charlestown, MA, United States, 3Harvard Medical School, Boston, MA, United States, 4Siemens Magnetic Resonance, Shenzhen, China, 5Medical Physics in Radiology, German Cancer Research Center, Heidelberg, Germany, 6Boston Children's Hospital, Boston, MA, United States
Synopsis
Structural imaging of the brain using conventional MPRAGE at high resolution is vulnerable to motion artifacts due to prolonged scan times. MPRAGE acquired with wave-CAIPIRINHA technique (waveMPRAGE) and a multi-channel receive coil can significantly improve imaging speed with minimal noise penalty. We show that head motion can be observed from multiple waveMPRAGE scans in a time span similar to a single conventional MPRAGE, and that registering and averaging multiple short (approx. 1 min) waveMPRAGE repetitions produces reliable and reproducible cortical surfaces reconstructed automatically using FreeSurfer.
Introduction
Structural MRI is a crucial tool to study the anatomical changes of the human brain both cross-sectionally across patient groups and longitudinally over time. Current structural imaging using MPRAGE at conventional resolution (1 mm) lasts about 5 min and suffers from compromised image quality due to head motion. MPRAGE with wave-CAIPIRINHA (waveMPRAGE)1,2 allows for highly accelerated imaging without elevated SNR penalty due to noise enhancement (i.e., geometry factor) while preserving brain tissue contrast. Here we performed a quantitative comparison of the brain surface reconstructions of the data acquired with waveMPRAGE and conventional MPRAGE, computed automatically with FreeSurfer3.Methods
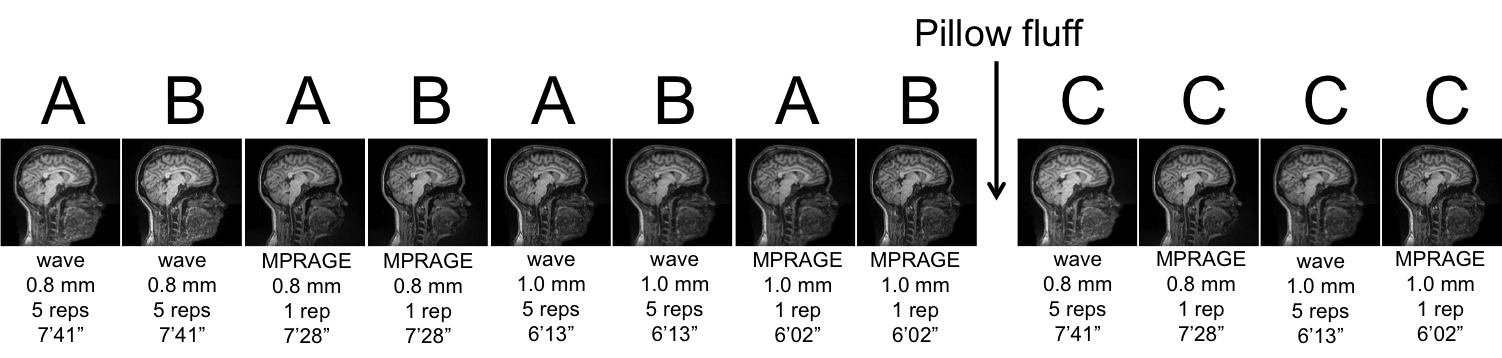
Five subjects between 20 and 30 years of age were imaged at 3T whole-body scanners – two in a MAGNETOM Skyra and three in a MAGNETOM Prisma (Siemens Healthcare, Erlangen, Germany) – and 32-channel head coils. MPRAGE and a prototype waveMPRAGE were acquired at both 0.8 mm and 1 mm isotropic resolutions. Each waveMPRAGE was 3×3 accelerated; a single repetition lasted 1’37” (0.8 mm) or 1’19” (1.0 mm). Acquisition details include: 256×256×192 mm3 FOV sagittal orientation, TR/TI = 2.53 s/1.10 s, PE turbo factor 3, bandwidth 200 Hz/pixel, flip angle = 7˚ non-selective, 16 wave cycles with a maximum gradient amplitude 9 mT/m and a maximum slew rate 160 mT/m/ms. For MPRAGE, TE = 3.42 ms (0.8 mm), 3.30 ms (1.0 mm); for waveMPRAGE, TE = 3.65 ms (0.8 mm), 3.52 ms (1.0 mm). To match the acquisition times of conventional MPRAGE of 7’28” and 6’02”, each waveMPRAGE measurement was repeated 5 times, resulting in total scan times of 7’41” (0.8 mm) and 6’13” (1.0 mm) per run. The experimental design is described in more details in Fig. 1.
For analysis, the 5 repetitions of each waveMPRAGE were motion-corrected and averaged using a robust-template registration4. Thus, in the following analysis, each “run” of waveMPRAGE (consisting of 5 short repetitions) was treated as a single image volume.
The three runs of each protocol were processed using the longitudinal analysis stream in FreeSurfer5,6: Each run was first segmented separately using FreeSurfer, then longitudinal reconstructions were generated for the two pairs (A-to-B and B-to-C) to enable unbiased quantitative comparisons7. Then, between each run pair in each subject, the discrepancy maps for both cortical thickness differences and individual surface position differences (for both the gray-white and gray-CSF interface surfaces) were calculated to assess precision of the reconstruction, as previously described5,8. Finally, these discrepancy maps were aligned across subjects using the fsaverage surface-based atlas to calculate group-level statistics for both the A-to-B and B-to-C comparisons.
Results
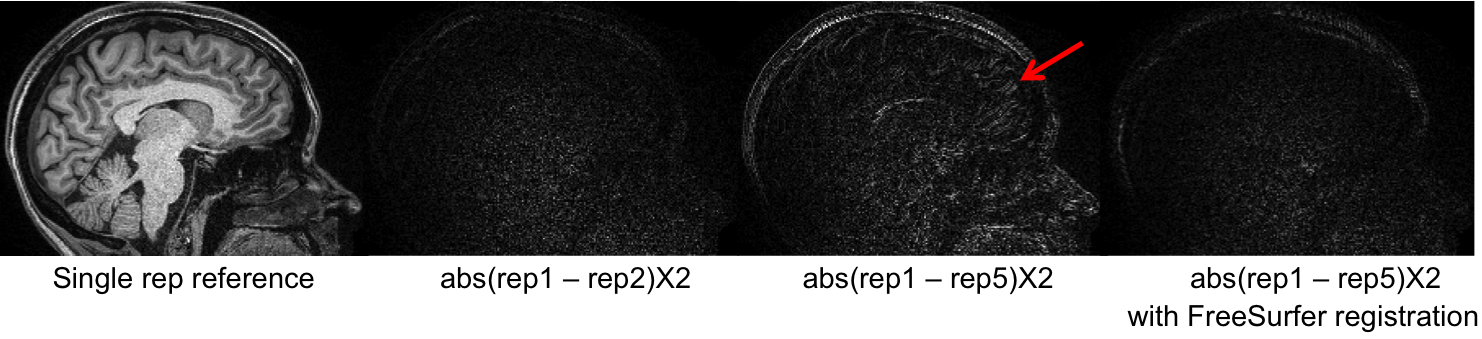
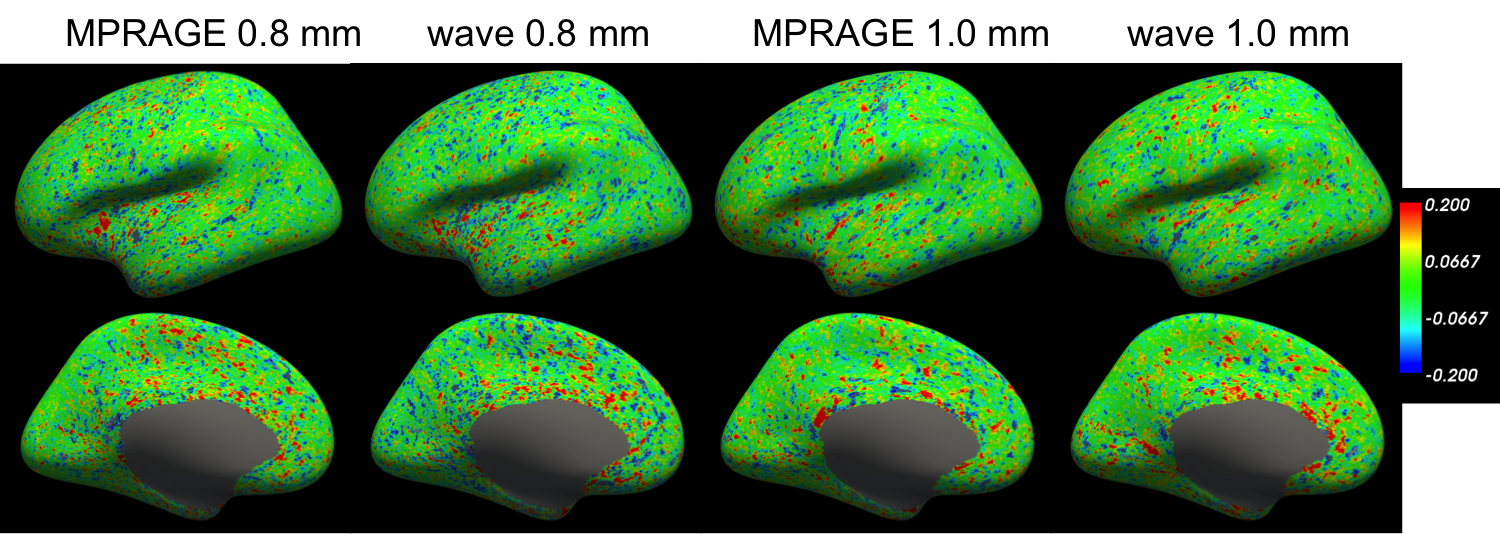
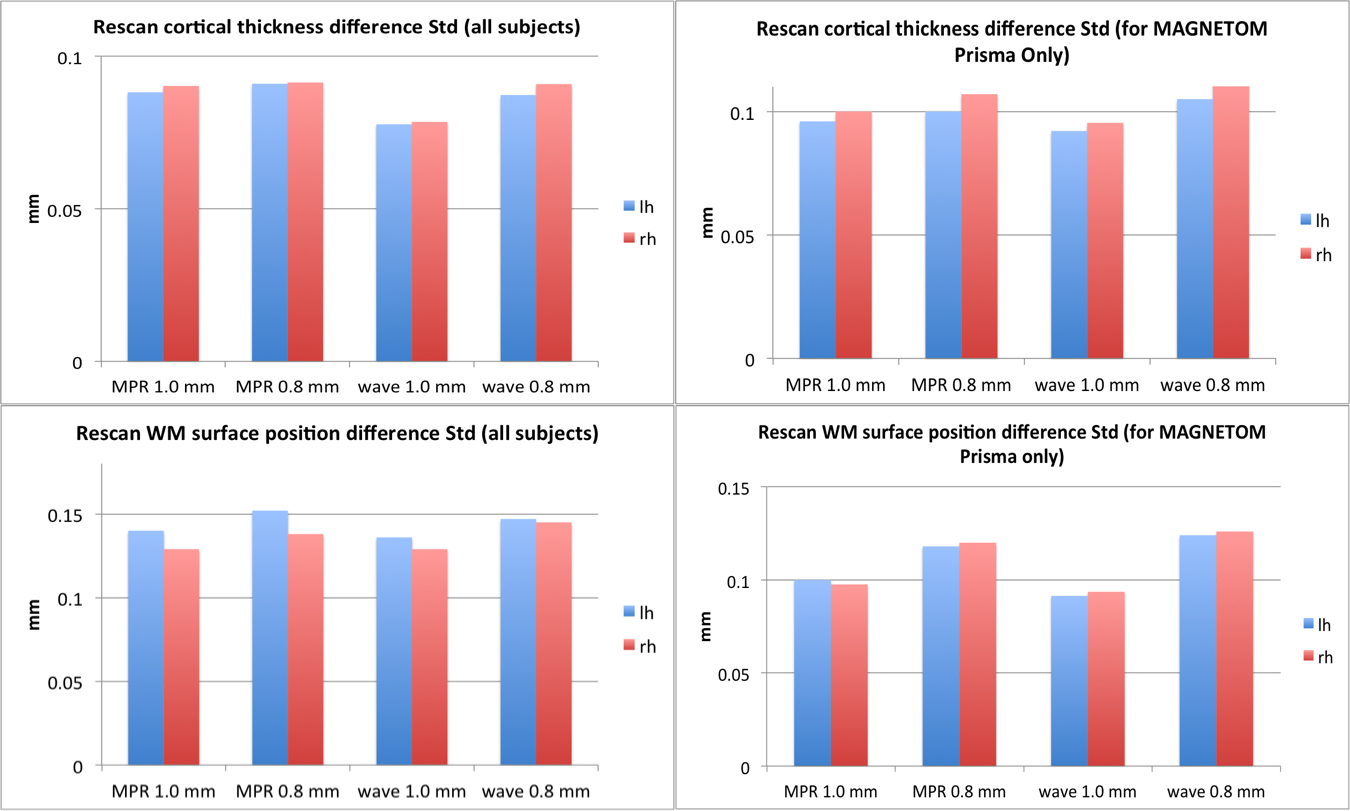
Figure 2 demonstrates that head motion increases with scan time, which can be clearly observed between the first and the fifth repetitions. We found that such motion existed for all subjects, which can be largely reduced with FreeSurfer’s robust-template registration algorithm. A simple image quality comparison is shown in Fig. 3, where the SNR of each single waveMPRAGE repetition is lower than conventional MPRAGE due to shorter scan time, but the averaged waveMPRAGE is similar to conventional MPRAGE. Figure 4 shows average-cortical thickness difference of the left hemisphere between runs B and C. The standard deviation of the signed discrepancy (thickness or position) can be used to indicate the precision of volume segmentation. As expected from Fig. 4, these standard deviations are similar across the protocols, as shown in Fig. 5. We note that the average difference is quite small (~0.01 mm) for any protocol, indicating the signed discrepancies are effectively zero-mean and thus unbiased.Discussion
In this study, we presented a scan-time-matched comparison of waveMPRAGE and conventional MPRAGE to exclude effects resulting from significant SNR differences between the two approaches. It may be possible to reduce the number of repetitions for waveMPRAGE while still maintaining high image quality, and we are currently investigating the minimum scan time for waveMPRAGE that provides identical quality to standard MPRAGE. Since the subjects of this study were healthy and were instructed to stay still during the scan, the comparison may slightly favor conventional MPRAGE compared to applications to patient populations where subjects may have difficulty holding still during a conventional MPRAGE scan. Finally, only magnitude-valued image volumes were to register and average of the 5 waveMPRAGE repetitions; further SNR improvement is expected from complex-valued averaging, which will require slight modification of the registration algorithm.Conclusion
WaveMPRAGE allows for highly-accelerated image acquisition of brain structure. Multiple volumes acquired within the duration of a conventional MPRAGE can be registered to reduce brain motion. Brain surfaces and cortical thickness can be reliably measured from averaged waveMPRAGE volumes.Acknowledgements
This work was supported in part by the NIH NIBIB (P41-EB015896, R01-EB023281, and R01-EB019437), by the BRAIN Initiative (NIH NIMH R01-MH111419), and by the MGH/HST Athinoula A. Martinos Center for Biomedical Imaging; and was made possible by the resources provided by NIH Shared Instrumentation Grants S10-OD010364, and S10-RR023043.References
(1) Bilgic B, Gagoski BA, Cauley SF, Fan AP, Polimeni JR, Grant PE, Wald LL, Setsompop K, Wave-CAIPI for Highly Accelerated 3D Imaging, Med Reson Med 2015:73:2152-2162
(2) Polak D, Setsompop K, Cauley SF, Gagoski BA, Bhat H, Maier F, Bachert P, Wald LL, Bilgic B, Wave-CAIPI for Highly Accelerated MP-RAGE Imaging, Med Reson Med, DOI 10.1002/mrm.26649
(3) Fischl B, FreeSurfer, NeuroImage 2012:62:774-781
(4) Rueter M, Schmansky NJ, Rosas HD, Fischl B, Within-Subject Template Estimation for Unbiased Longitudinal Image Analysis, NeuroImage 2012:61:1402-1418
(5) Fujimoto K, Polimeni JR, van der Kouwe AJW, Reuter M, Kober T, Benner T, Fischl B, Wald LL, Quantitative comparison of cortical surface reconstructions from MP2RAGE and multi-echo MPRAGE data at 3 and 7T, NeuroImage 2014:90:60-73
(6) Reuter M, Schmansky NJ, Rosas HD, Fischl B, Within-Subject Template Estimation for Unbiased Longitudinal Image Analysis, NeuroImage, 2012:61:1402–1418
(7) Reuter, M., Fischl, B., Avoiding asymmetry-induced bias in longitudinal image processing. NeuroImage, 2011:57(1):19–21
(8) Zaretskaya N, Fischl B, Reuter M, Renvall V, Polimeni JR. Advantages of cortical surface reconstruction using submillimeter 7 T MEMPRAGE. NeuroImage, 2017:165:11–26.
Figures