2041
Spiral TAPIR with Compressed Sensing for Fast Sub-Millimetre T1 Mapping of Rapidly Relaxing Compartments at 3 Tesla1Institute of Neuroscience and Medicine – 4, Medical Imaging Physics, Forschungszentrum Juelich GmbH, Juelich, Germany, Juelich, Germany, 2Department of Neurology, Faculty of Medicine, JARA, RWTH Aachen University, Aachen, Germany
Synopsis
TAPIR is a highly accurate, precise and efficient method for T1 mapping of the brain. It combines an efficient slice-interleaving Look-Locker read-out to sample T1 relaxation by acquiring multiple k-space lines in one shot. However, mapping rapidly relaxing tissue requires the number of lines read in one shot to be small, thus increasing total measurement time. In this work we show how incorporating an interleaved spiral read-out into TAPIR enhances its T1 fitting abilities for rapidly relaxing tissue such as white matter myelin. Scanning time can be decreased by factors of up to 3.3 in comparison to classical Cartesian TAPIR.
Introduction
To allow widespread use of quantitative MRI, scanning times need to be as short as possible without loss of accuracy and precision. TAPIR is a highly accurate, precise and efficient method for T1 mapping of the brain1,2. In Cartesian TAPIR, EPI factors of 5 to 9 are used to decrease total scanning time as fewer shots are necessary to fill up the k-space at a given time point on the recovery curve. This however increases TR, reducing the ability to map T1 times of rapidly relaxing tissue. To alleviate this conflict, a spiral read-out was inserted into the TAPIR sequence. Leave-one out under-sampling of interleaves for in vivo measurements provides a further reduction in scanning time and potentially reduces motion artefacts.Materials and Methods
All measurements were performed on a Siemens Magnetom Trio 3T scanner with a 12-channel coil for phantom and a 32-channel coil for in vivo measurements. Matrix size was set to 256, FOV to 240mm and slice thickness to 2mm with 25% gap. EPI factors applied were 5, 7 and 9 and the number of acquired contrasts was 35, 29 and 24. 8 slices were sampled as a single group. TR was 16.6ms, 20.0ms and 24.4ms. This yielded relaxation sampling for 4648ms, 4640ms and 4685ms guaranteeing a fair comparison of fitting performance at approximately 3 times the expected T1 value for grey matter at 3T. Acquisition times were 340s, 275s and 213s for relaxation and 266s, 191s and 152s for the corresponding inversion efficiency measurement2. In the spiral imaging setup, only the k-space read-out module was changed. The read-out trajectory was designed according to 3, with 28 interleaves using a gradient strength and slew rate maximum of 26 mT/m and 130mT/m/s. 41 contrasts with a TR of 14.1ms were acquired, resulting in 4625ms of relaxation sampling. Correction of anisotropic gradient delay was carried out according to 4. The necessary calibration read-outs were added to the end of each measurement. This allowed measuring both planar gradients twice per group of 8 slices while adding only one TR and computing the mean over both calibration runs. Acquisition times were 202s and 108s for relaxation and 143s and 72s for inversion efficiency measurement in case of full sampling and under-sampling by a factor of 2 respectively. Spirally sampled data were reconstructed using an in-house implementation of NUFFT with ADMM L1 regularisation 5. The 32 channels of the coil used for in vivo measurements where compressed to 8 virtual channels via singular value decomposition to ease image reconstruction demands. Data from phantom measurement was compressed to 4 virtual channels by the MR system. T1 fitting was performed using Levenberg-Marquardt minimisation implemented in Matlab as mentioned in 2 with T1 values limited to 5000ms .Results
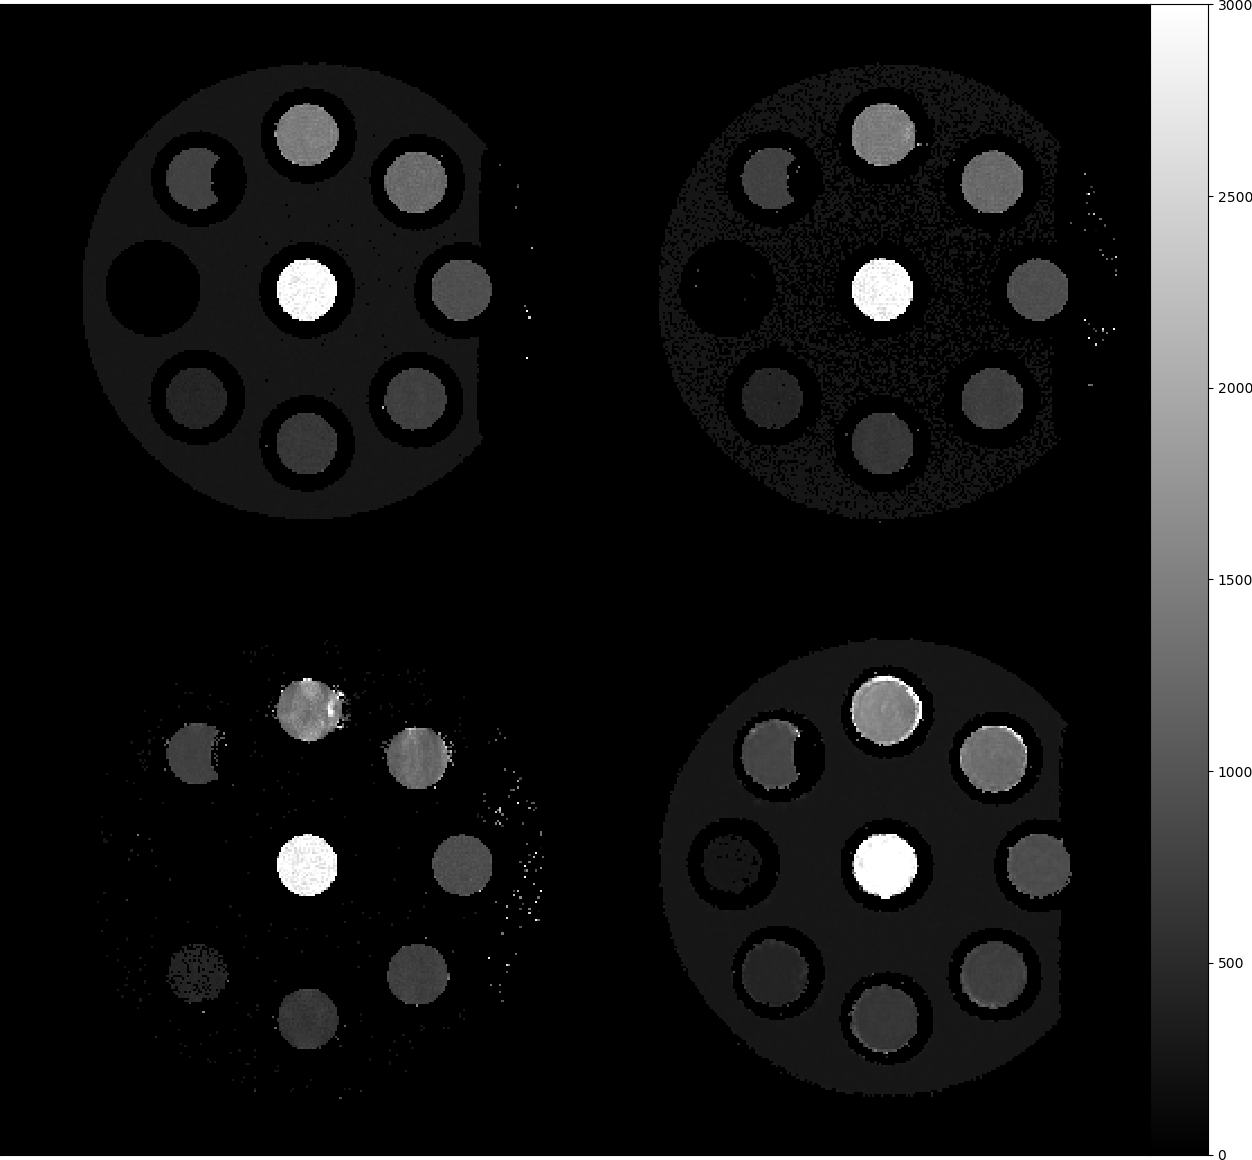
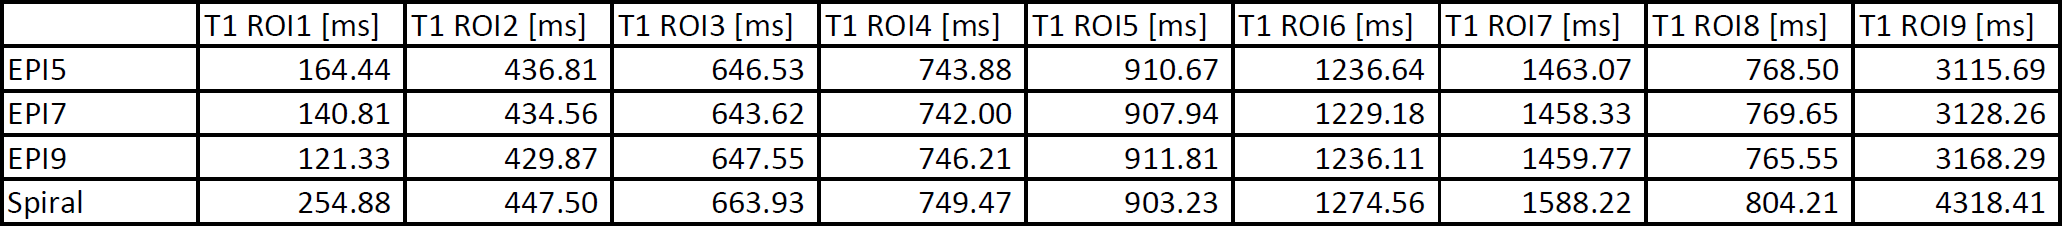
A cylindrical phantom with 9 inserts containing doped water with T1 relaxation times of 266ms, 421ms, 621ms, 704ms, 925ms, 1309ms, 1436ms, 764ms and 3178ms for ROIs 1 to 9 as measured via spectroscopy was used to determine the fitting accuracy for all sequences.
Fig. 1 depicts the results for the 8th slice in the measured group. ROI1 with the smallest T1 value is located on the left, and ROI number increases counter-clockwise.
Fig. 2 shows the evolution of mean T1 values over slices 1 to 8.
Fig. 3 shows the mean T1 values per ROI over all slices.
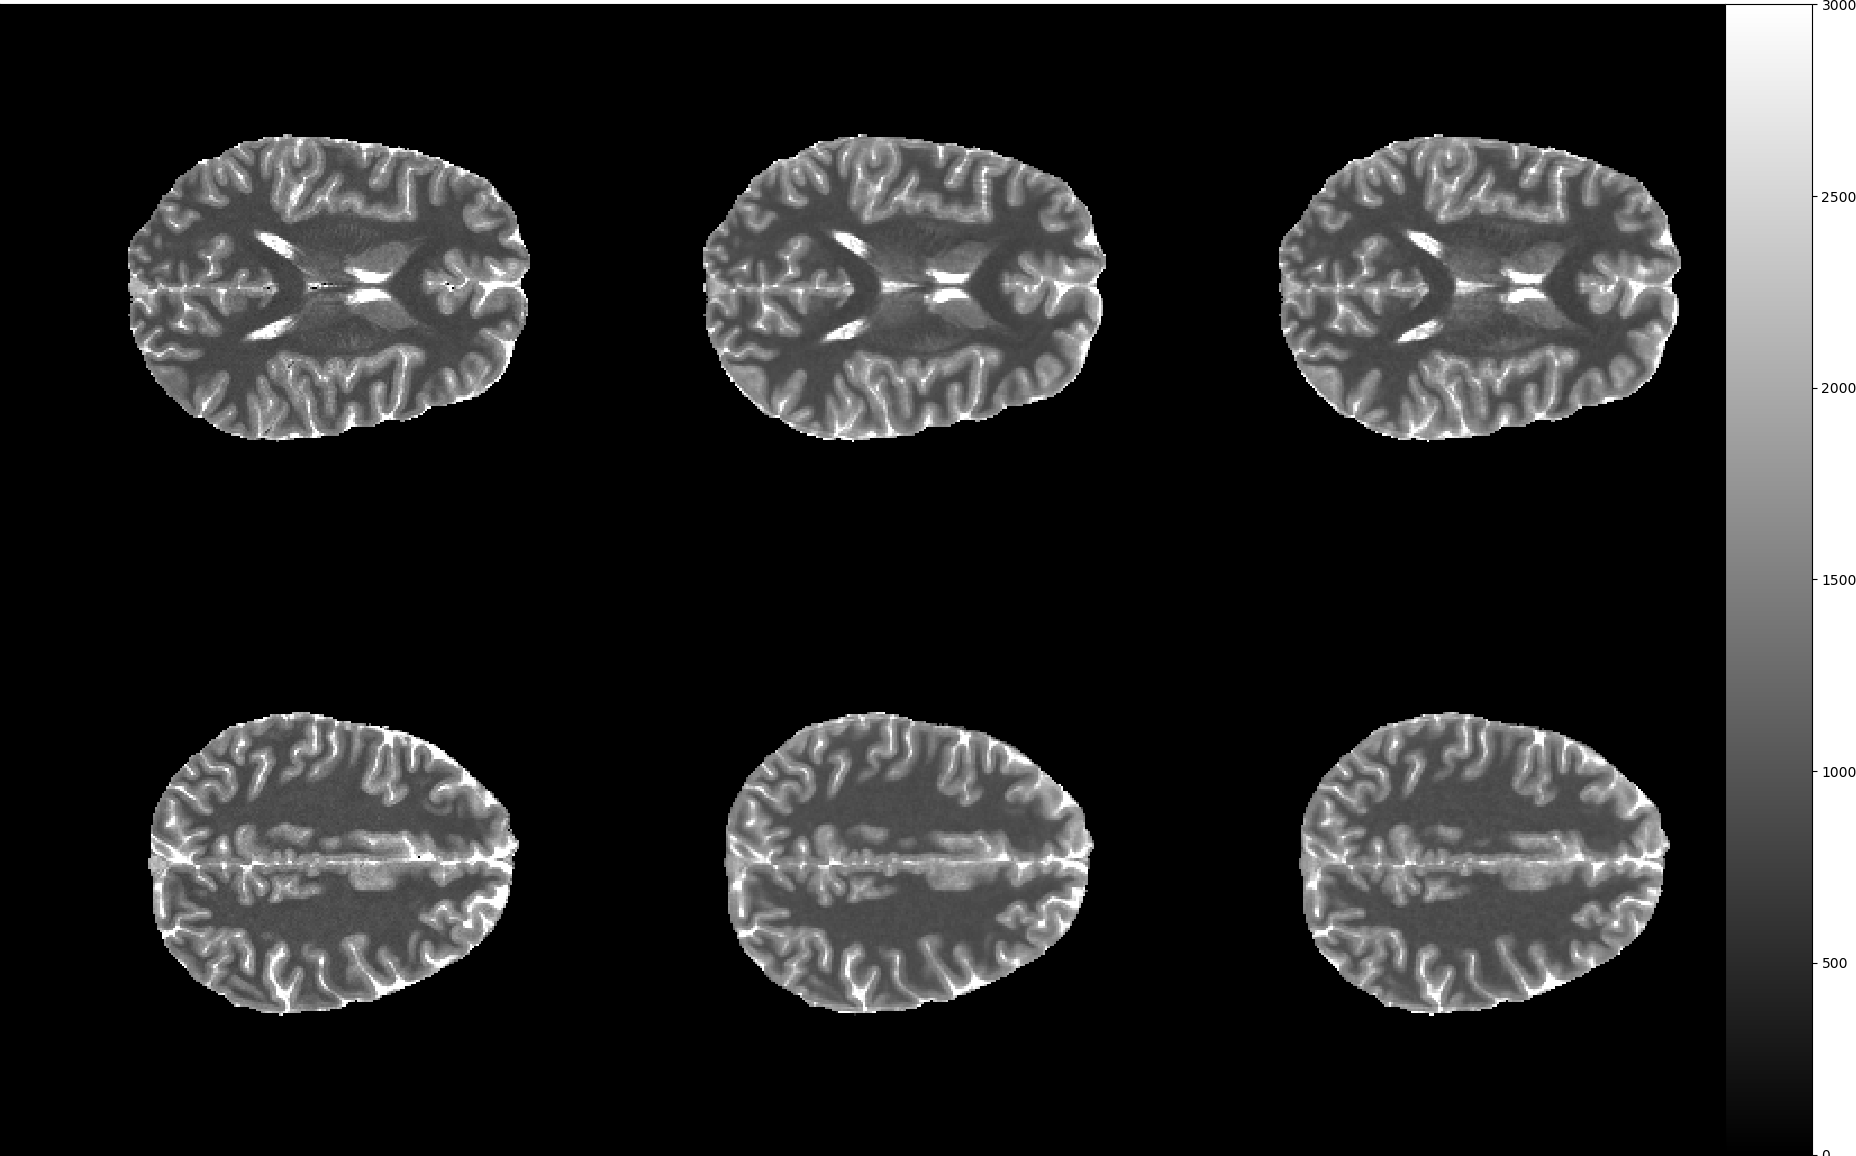
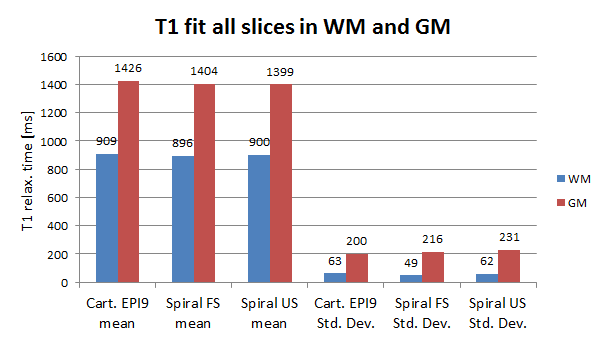
Fig. 4 shows T1 maps for the in vivo scans. The mean and standard deviation of T1 in WM and GM as shown in Fig. 5 were computed based on each sequences’ class map, which were generated using FSL FAST 6.
Discussion
The inability to fit T1 for rapidly relaxing components using EPI factors of 5 to 9 as shown in figures 1 and 2 is overcome with a spiral readout with shorter TR, starting sampling at the centre of k-space. Scanning times are reduced significantly by up to 3.3-fold. However in phantom imaging, field inhomogeneities affect the spiral acquisition leading to overestimation of T1 relaxation for some ROIs. The more benign field distribution in the brain shows the strengths of the spiral read-out. No significant differences in WM and GM T1 values and standard deviation between the methods were observed, while still enabling up to two times faster scanning compared to cartesian EPI factor 9 using a compressed sensing reconstruction.Conclusion
With significantly shorter TR than high EPI factor conventional TAPIR, spiral TAPIR allows fitting rapidly relaxing compartments while increasing scanning speed by up to 3.3-fold. Future work will implement field inhomogeneity correction to make the spiral imaging as robust as Cartesian imaging.Acknowledgements
No acknowledgement found.References
1. N.J. Shah, M. Zaitsev, S. Steinhoff, et al. A New Method for Fast Multislice T1 Mapping. NeuroImage. 2001;14:1175-1185.
2. M. Zaitsev, S. Steinhoff, N.J. Shah. Error Reduction and Parameter Optimization of the TAPIR Method for Fast T 1 Mapping. Magn. Res. Med. 2003;49:1121-1132.
3. G.H. Glover. Simple Analytic Spiral K-Space Algorithm. Magn. Res. Med. 1999;42:412-415.
4. R. K. Robison, A. Devaraj, J.G. Pipe. Fast, Simple Gradient Delay Estimation for Spiral MRI. Magn. Res. Med. 2010;63:1683-1690.
5. S. Boyd, N. Parikh, E. Chu, et al. Distributed Optimization and Statistical Learning via the Alternating Direction Method of Multipliers. Foundations and Trends in Machine Learning. 2010;3:1-122.
6. M. Jenkinson, C. F. Beckmann, T.E.J. Behrens, et al. FSL. NeuroImage. 2012;62:782-790
Figures