2037
T1-weighted imaging of the orbitofrontal cortex in individuals with dental braces using 2D FLAIR1Department of Epidemiology, Erasmus MC University Medical Center Rotterdam, Rotterdam, Netherlands, 2The Generation R Study Group, Erasmus MC University Medical Center Rotterdam, Rotterdam, Netherlands, 3Department of Radiology, Erasmus MC University Medical Center Rotterdam, Rotterdam, Netherlands, 4Department of Pediatrics, Erasmus MC University Medical Center Rotterdam, Rotterdam, Netherlands, 5Department of Neurology, Erasmus MC University Medical Center Rotterdam, Rotterdam, Netherlands, 6Department of Child and Adolescent Psychiatry/Psychology, Erasmus MC University Medical Center Rotterdam, Rotterdam, Netherlands
Synopsis
Neuroimaging studies in (pre)adolescent populations have steadily increased in number over the last decade. However, dental braces are common amongst (pre)adolescents and introduce metal-related artifacts in the images. Excluding individuals with braces from epidemiological studies may lead to selection bias and missingness in repeated measures. To this end we configured a T1-weighted 2D FLAIR sequence and compared it to a T1-weighted 3D SPGR sequence. Compared to SPGR, the FLAIR sequence suffered less from metal artifacts and performed similarly in cortical reconstruction and volumetric segmentation. Thus, T1-weighted 2D FLAIR may be a useful alternative for neuroimaging in participants with dental braces.
Introduction
The last few decades have seen a drastic increase in the number of population-based neuroimaging studies, particularly in child and adolescent populations1-5. Such studies generally consist of structural T1-weighted and diffusion weighted MRI sequences as well as functional MRI sequences. However, a significant portion of (pre)adolescents wear dental braces that introduce metal artifacts during imaging, thus rendering the acquired images unusable. Clinical imaging may involve temporary removal of the dental braces, but this is ethical nor feasible in population-based volunteer studies. Exclusion of participants with braces may lead to selection bias in cross-sectional studies and additionally missingness of repeated measures in longitudinal studies. To tackle this problem we configured a T1-weighted 2D fluid attenuated inversion recovery (FLAIR) sequence to substitute T1-weighted 3D spoiled gradient recalled (SPGR) sequence.Methods
The study population consisted of three adults (22-29 years) without dental braces and 12 adolescents (13-15 years) with MRI-safe dental braces. The latter group was a subset from the Generation R Study, a population-based birth cohort conducted in Rotterdam, The Netherlands6. Written informed consent was obtained for all participants. MR images were acquired using a 3 Tesla GE Discovery MR750w MRI System (General Electric, Milwaukee, WI, USA) and an 8-channel head coil. We collected two T1-weighted 2D axial FLAIR sequences (repetition time = 2883.1 ms, echo time = 5.4 ms, inversion time = 1188 ms, number of excitations = 1, flip angle = 111°, acquisition matrix = 192 x 192, field of view = 224.0 mm, slice thickness = 1.2 mm, bandwidth = 83.33 kHz). Additionally, we used the T1-weighted sequence from the Generation R Study, a 3D coronal inversion recovery fast SPGR sequence (repetition time = 8.8 ms, echo time = 3.4 ms, inversion time = 600 ms, number of excitations = 1, flip angle = 10°, acquisition matrix = 220 x 220, field of view = 220.0 mm, slice thickness = 1.0 mm, bandwidth = 25.00 kHz) with ARC acceleration (acceleration factor = 2.00). Cortical reconstruction and volumetric segmentation was performed using the Freesurfer image analysis package version 6.0 (https://surfer.nmr.mgh.harvard.edu/).Results
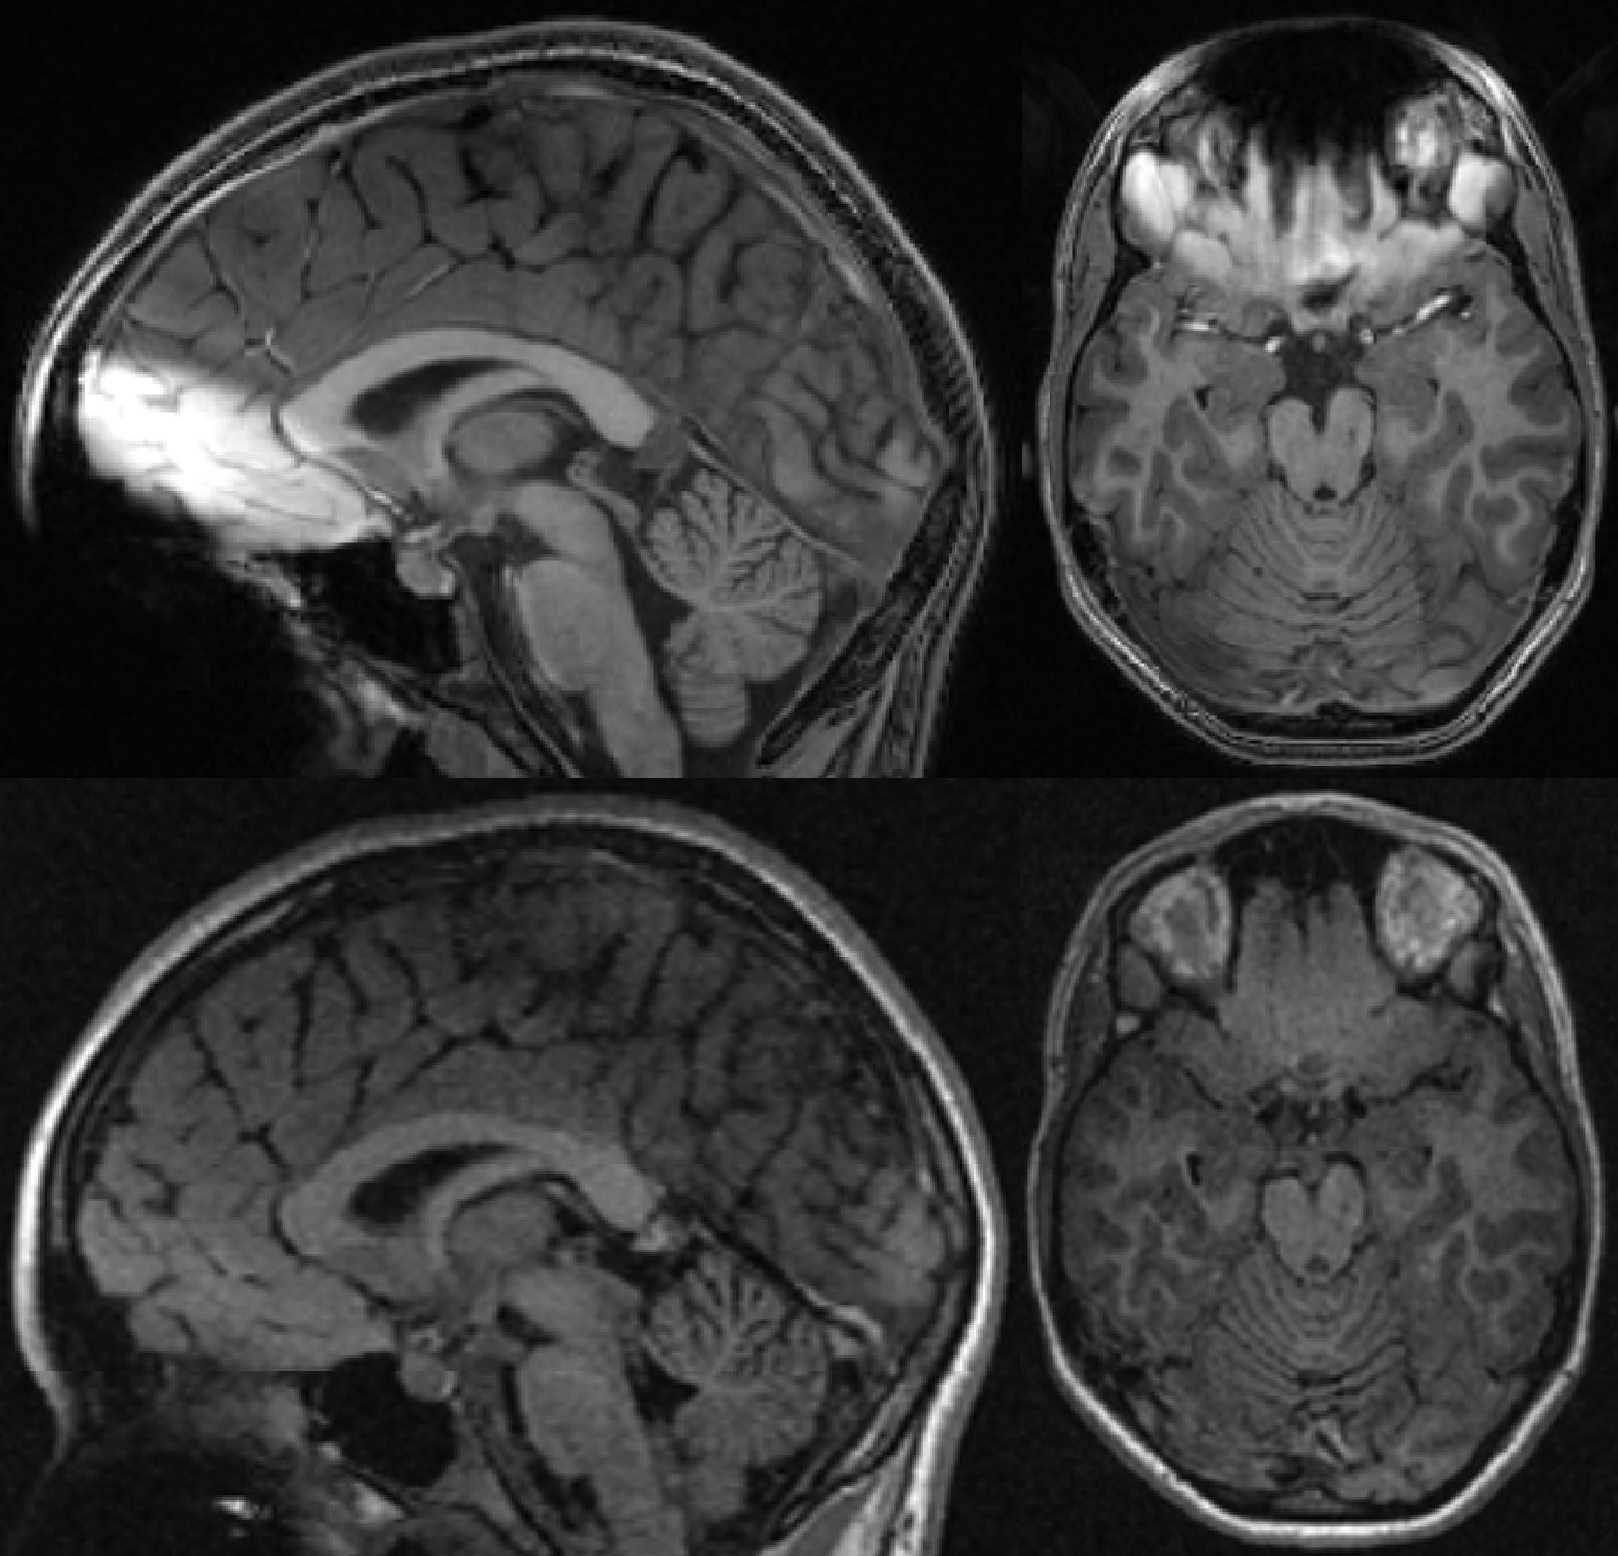
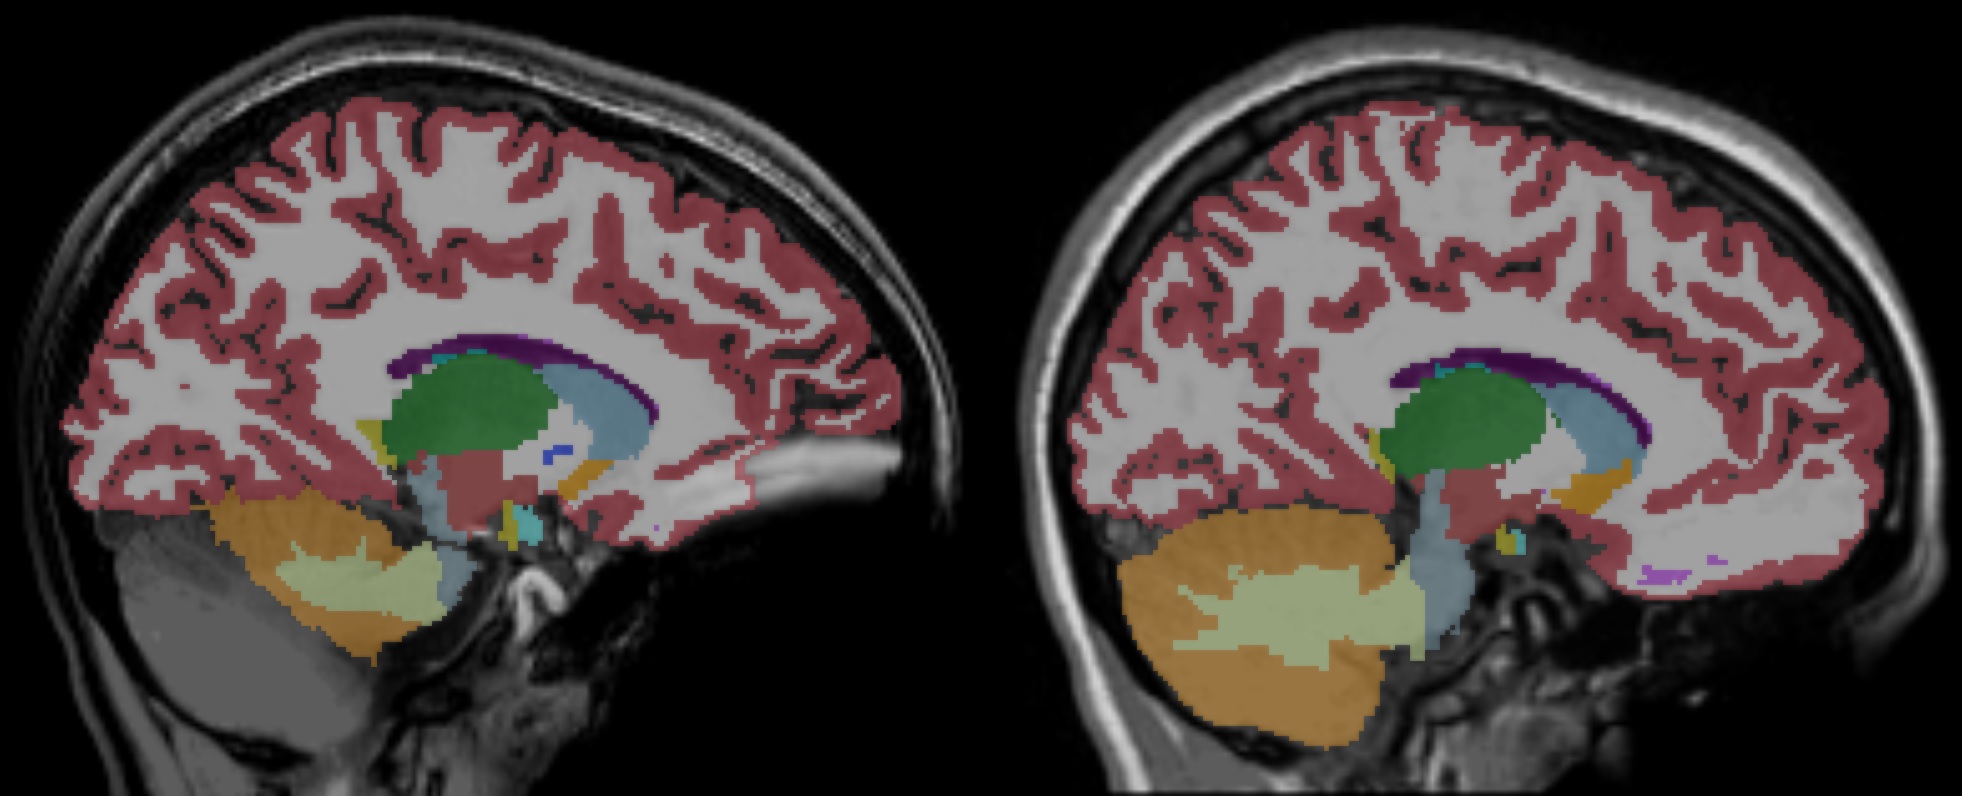
Examples of FLAIR and the SPGR acquisitions are shown for a participant with braces in Figure 1. The SPGR sequence showed extensive metal artifacts, especially in the orbitofrontal and cerebellar regions. The FLAIR sequence did show loss of gray-white matter contrast in the orbitofrontal region, but the pial surface of the orbitofrontal cortex seemed unaffected by the metal artifact. Figure 2 displays examples of Freesurfer output from the same individual with braces. In 4 out of 12 participants with braces the SPGR sequence lacked segmentation of significant portions of the cerebellum, whereas this was not a problem for the FLAIR sequence.
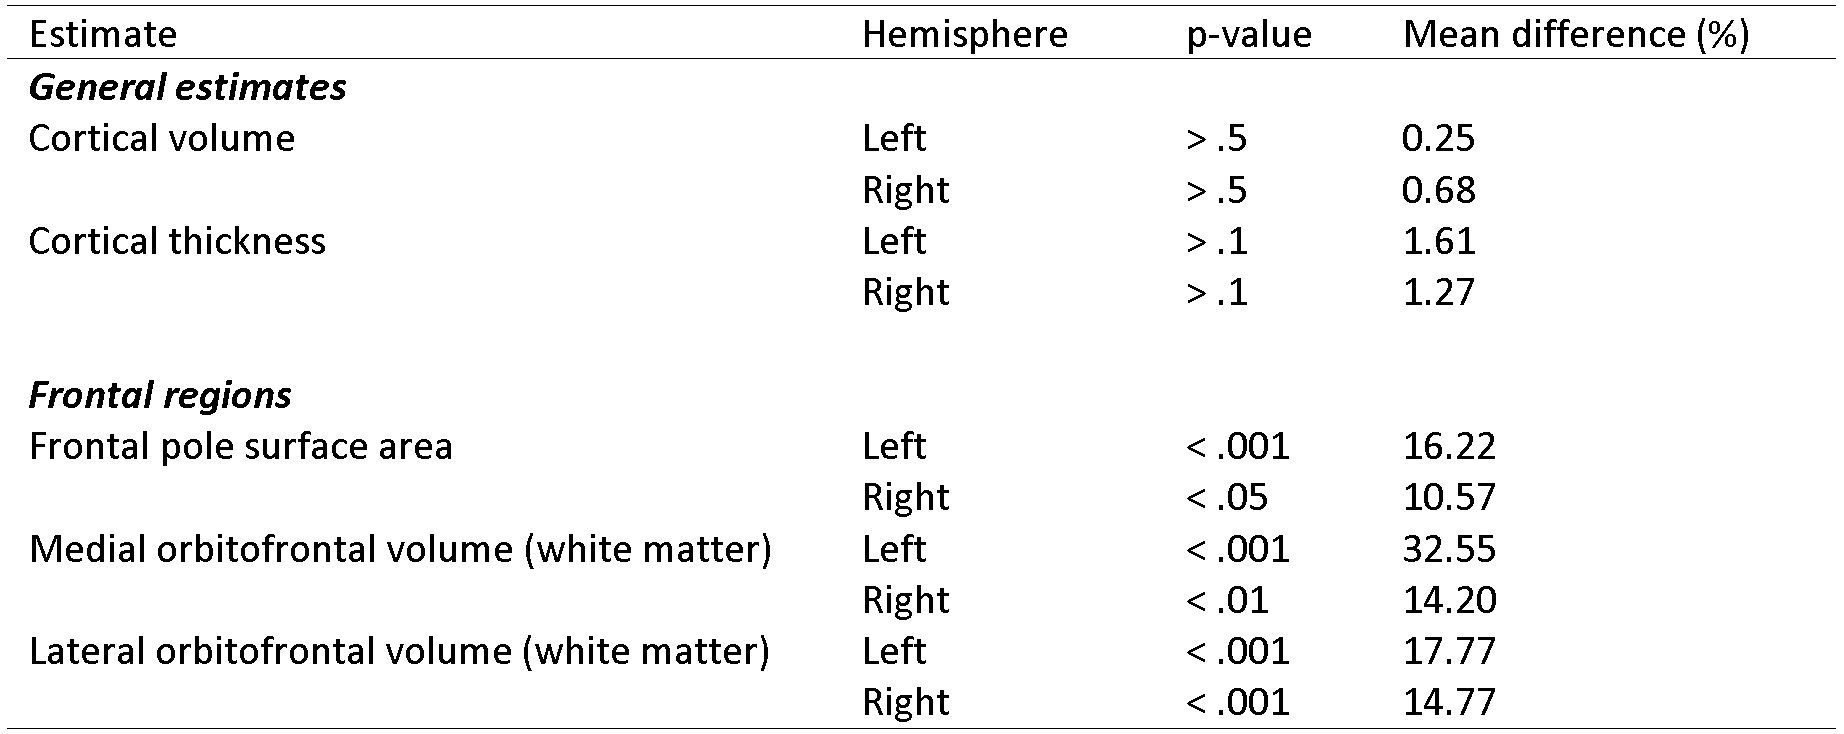
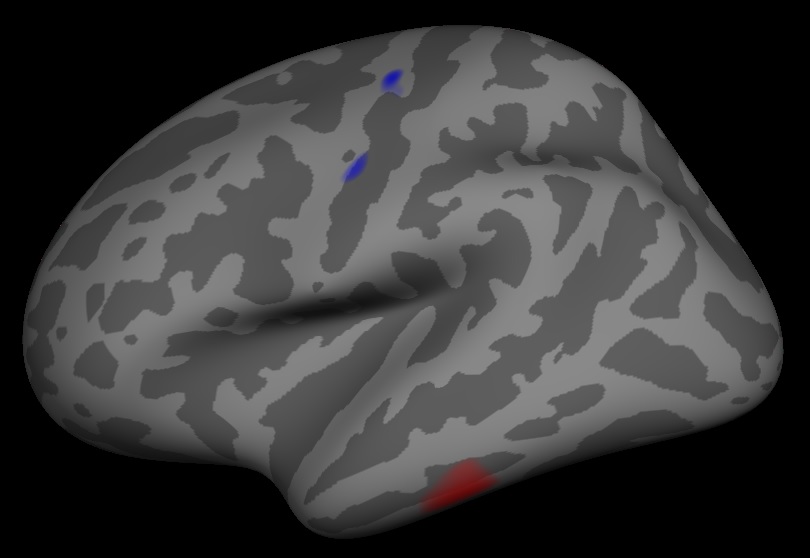
To test for differences in the volumetric and thickness estimates obtained from Freesurfer we performed paired t-tests in the 12 participants with braces. Some of the results are shown in Figure 3. Regions affected by the metal artifact showed significant differences between the two sequences while unaffected regions did not. Finally, we mapped the average difference in cortical thickness of the three participants without braces, shown in Figure 4. As can be seen no clear differences arise in the estimated cortical thickness.
Discussion
The T1-weighted 2D FLAIR was chosen to minimize the artifacts caused by metal-content in dental braces. Spin-echo is less sensitive to off-resonance than gradient-echo based sequences. Additionally, 2D pulses show a good performance limiting the excitation slice profile only to the correspondent slice to be excited and not affecting the oral region where braces are placed. Finally, the FLAIR sequence gave sufficient contrast between gray and white matter that the cortical reconstruction and volumetric segmentation seem to perform similarly to 3D SPGR in individuals without braces.
Conclusion
T1-weighted 2D FLAIR may be a straightforward alternative to T1-weighted 3D SPGR in adolescent studies due to its relative robustness to metal artifacts caused by dental braces.
Acknowledgements
The Generation R Study is conducted by the Erasmus Medical Center in close collaboration with the School of Law and Faculty of Social Sciences of the Erasmus University Rotterdam, the Municipal Health Service Rotterdam area, Rotterdam, the Rotterdam Homecare Foundation, Rotterdam and the Stichting Trombosedienst & Artsenlaboratorium Rijnmond (STAR-MDC), Rotterdam. The authors gracefully acknowledge the study participants, the staff from the Generation R Study, and the midwives, general practitioners, pharmacists and hospitals in Rotterdam.References
1. White T, Muetzel RL, El Marroun H, et al. Paediatric population neuroimaging and the Generation R Study: the second wave. Eur J Epidemiol. 2017
2. Schumann G, Loth E, Banaschewski T, et al. The IMAGEN study: Reinforcement-related behaviour in normal brain function and psychopathology. Mol Psychiatry. 2010;15:1128-1139
3. Satterthwaite TD, Elliott MA, Ruparel K, et al. Neuroimaging of the Philadelphia neurodevelopmental cohort. Neuroimage. 2014;86:544-553
4. Jernigan TL, Brown TT, Hagler DJ, et al. The Pediatric Imaging, Neurocognition, and Genetics (PING) data repository. Neuroimage. 2016;124:1149-1154
5. Giedd JN, Raznahan A, Alexander-Bloch A, Schmitt E, Gogtay N, Rapoport JL. Child psychiatry branch of the National Institute of Mental Health longitudinal structural magnetic resonance imaging study of human brain development. Neuropsychopharmacology. 2015;40:43-49
6. Kooijman MN, Kruithof CJ, van Duijn CM, et al. The Generation R Study: Design and cohort update 2017. Eur J Epidemiol. 2016;31:1243-1264
Figures