2036
Investigating relevance of tumor shape features in overall survival prediction of glioblastoma multiforme patients using machine learning and multi-channel MR images1Department of Biomedical Engineering, National University of Singapore, Singapore, Singapore, 2Department of Neurosurgery, National Neuroscience Institute, Singapore, Singapore
Synopsis
In this work, we study the impact of combining shape features with texture and volumetric features derived from glioblastoma multiforme (GBM) tumors for overall survival (OS) prediction. A comprehensive set of features were obtained from multichannel MR images of 163 GBM patients. Support Vector Machine-Recursive Feature Elimination (SVM-RFE) was used for feature selection, followed by SVM regression for survival prediction. The shape features used in this study have not yet been used for OS prediction in GBM patients and were found to improve the prediction accuracy.
Introduction
Glioblastoma multiforme (GBM) patients have a median overall survival (OS) of around 12-15 months1. OS prediction can be useful for surgical and treatment planning. Several studies have used MRI derived texture features for OS prediction of GBM patients2,3. In this study, texture features (first and higher order), tumor volumetric features, and patient age were used for GBM OS prediction (in days). Additionally, the impact of a set of (2D and 3D) shape features was analyzed for OS prediction in GBM patients.Method
T1-weighted Gadolinium (Gd) contrast enhanced (T1CE), T2-weighted (T2) and FLAIR MR images of 163 patients obtained from the BraTS 2017 dataset were used in this study4,5.
The volumetric features used in this work are illustrated in Figure-1.
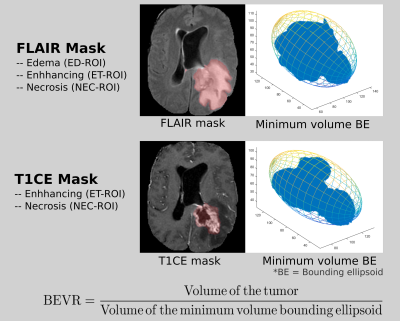
The FLAIR and T1CE masks referred to in this study are illustrated in Figure-2.
3D shape feature: Bounding Ellipsoid Volume Ratio (BEVR)6,7 was extracted from the T1CE and the FLAIR mask (Figure-2). It is an indicator of the irregularity of the tumor shape. A tumor with elliptical shape results in a higher BEVR value as compared to a tumor with irregular shape.
2D shape features8: Mean Radial Distance (MRD), Radial Distance Standard Deviation (RDSD), Mass Circularity (MC), Entropy of radial distance (Entropy), Area Ratio (AR), Zero Crossing Count (ZC) and Mass Boundary Roughness (MRB) were extracted from the largest axial slice of the FLAIR mask.
The first order texture (FOT) features extracted were entropy, kurtosis, median, skewness and uniformity.
Gray level co-occurrence matrix (GLCM) features were obtained from Lloyd-Max quantized (256 levels) multi-channel MRIs. 13 Haralick features9 along 13 directions were extracted from the GLCM matrices computed from the 3D ROIs. The rotation invariant GLCM matrices obtained from the 2D ROIs were computed along four directions (θ = 0, pi/4, pi/2, 3pi/4) and for four distances (d = 1, 2, 3, 4)10. The five features computed from the 2D GLCM matrices were contrast, correlation, dissimilarity, energy and homogeneity.
Rotation invariant spherical Gabor filter (RISGF)11 with scales: λ = {2.83, 4, 5.67, 8, 11.31}, and phase shifts: Ψ = {0, π/8, π/4, π/2} was applied to the MR images. FOT features computed from the Gabor filtered images were mean, standard deviation, ratio of mean and standard deviation, median, skewness, kurtosis and uniformity.
The texture features were extracted from the necrosis, edema and enhancing tumor ROIs of the multi-channel MRI.
The 150 top ranking features for the two feature sets (with and without tumor shape features) were selected by Support Vector Machine Regression – Recursive Feature Elimination (SVR-RFE) (linear kernel and C=1.0) using leave one out cross-validation (LOOCV).
An SVM based regression model was used to predict the OS of GBM patients using LOOCV for two the feature sets and their results were analyzed using the scatter plot for the true and predicted OS values.
The Bland-Altman
plot was used to assess the performance of the two feature sets in order to
study the impact of tumor shape features in OS prediction of GBM patients.
Results and Discussion
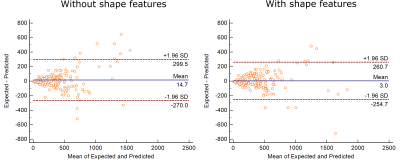
Figure-3 shows the scatter plot for the true and predicted OS values for both feature sets. For the feature set without the shape features, the coefficient of determination (R2) value obtained was 0.82. However, the R2 value increased to 0.86 when the shape features were included. This shows how the prediction improves with the inclusion of shape features. Out of the 23 shape features used, 4 were considered significant according to the SVM-RFE selection criteria. These were: BEVR of T1CE mask, circularity and mass boundary roughness of sagittal plane, and zero crossing count of coronal plane. Figure-4 shows the Bland Altman plot for both the feature sets. It shows that mean prediction error (MPE) decreased from 14.7 to 3.0 days on inclusion of shape features in the feature set. The 95% confidence interval on the MPE also reduced by 50 days. Hence, inclusion of shape features considerably reduces prediction error.Conclusion
This study demonstrates that using tumor shape features along with texture and clinical features reduces OS prediction error of GBM patients. The data used here were of 163 patients from multiple institutions, and were standard routine acquisitions for GBM patients. Hence, the proposed prediction framework can be considered for use in clinical practice with confidence.Acknowledgements
This work is supported by the Singapore Academic Research Fund under Grant R-397-000-227-112, NUSRI China Jiangsu Provincial Grant BK20150386 BE2016077 and NMRC Bedside Bench under grant R-397-000-245-511 awarded to Dr. Hongliang Ren. This research is also supported by the Singapore Ministry of Health’s National Medical Research Council under its Translational and Clinical Research Flagship Program- Tier 1 (Project No: NMRC/TCR/016-NNI/2016).References
- Central Brain Tumor Registry of the United States. "CBTRUS Statistical Report: Primary Brain and Central Nervous System Tumors Diagnosed in the United States, 2004–2006, February 2010." Hinsdale, IL: Central Brain Tumor Registry of the United States (http://www.cbtrus.org/2010-NPCR-SEER/CBTRUS-WEBREPORT-Final-3-2-10.pdf) [Accessed June 24, 2011].
- Upadhaya, Taman, et al. "Prognosis classification in glioblastoma multiforme using multimodal mri derived heterogeneity textural features: impact of pre-processing choices." Medical Imaging 2016: Computer-Aided Diagnosis. Vol. 9785. International Society for Optics and Photonics, 2016.
- Zhou, Mu, et al. "Identifying spatial imaging biomarkers of glioblastoma multiforme for survival group prediction." Journal of Magnetic Resonance Imaging 46.1 (2017): 115-123.
- Bakas, Spyridon, et al. "Advancing The Cancer Genome Atlas glioma MRI collections with expert segmentation labels and radiomic features." Scientific data 4 (2017): 170117.
- Menze, Bjoern H., et al. "The multimodal brain tumor image segmentation benchmark (BRATS)." IEEE transactions on medical imaging 34.10 (2015): 1993-2024.
- Czarnek, Nicholas, et al. "Algorithmic three-dimensional analysis of tumor shape in MRI improves prognosis of survival in glioblastoma: a multi-institutional study." Journal of neuro-oncology 132.1 (2017): 55-62.
- Moshtagh, Nima. "Minimum volume enclosing ellipsoid." Convex Optimization 111 (2005): 112.
- Georgiou, Harris, et al. "Multi-scaled morphological features for the characterization of mammographic masses using statistical classification schemes." Artificial Intelligence in Medicine 41.1 (2007): 39-55.
- Coelho, Luis Pedro. "Mahotas: Open source software for scriptable computer vision." arXiv preprint arXiv:1211.4907 (2012)
- Van der Walt, Stefan, et al. "scikit-image: image processing in Python." PeerJ 2 (2014): e453.
- Mulvey, Mark E. Classification of glioblastoma multiforme genomic subtypes using three-dimensional multiparametric MR imaging features. Diss. San Diego State University, 2016.
Figures


Figure 4: The Bland Altman plots for both feature sets (with and without tumor shape features) have been shown. The mean prediction error (MPE) obtained were 3 and 14.7 for the feature set with and without tumor shape features respectively. The 95% confidence interval on the MPE reduced by 50 days on inclusion of shape features.