2033
Diffusion MRI Changes in the Brain of the 3xTg Mouse Model of Alzheimer’s Disease1Department of Neuroscience, Medical University of South Carolina, Charleston, SC, United States, 2Center for Biomedical Imaging, Medical University of South Carolina, Charleston, SC, United States, 3Department of Neurology, Medical University of South Carolina, Charleston, SC, United States
Synopsis
The triple transgenic mouse model (3xTg) of Alzheimer’s disease (AD) exhibits both Aβ and tau pathology. Although diffusion MRI (dMRI) is an established tool for tracking changes in brain microstructure for aging and AD in humans, prior research using diffusion tensor imaging has called into question the sensitivity of dMRI for 3xTg mice. Here we investigated the sensitivity of an alternative dMRI method, diffusional kurtosis imaging, to detect brain changes associated with aging and disease progression in 3xTg mice. Our results indicate that dMRI is able to capture age and/or pathology related alterations in brain tissue for this mouse model.
INTRODUCTION:
This study uses diffusion MRI (dMRI) to examine AD-related pathology in aged triple transgenic mice model of AD (3xTg), which exhibits both Aβ and tau pathology1. This model has been well-characterized morphologically and biochemically2,3, but only two dMRI studies have been published4,5 to date. Although abnormal brain myelination patterns have been described in young 3xTg mice6, assessment of white matter (WM) in 3xTg mice using diffusion tensor imaging (DTI) revealed no significant differences compared with age-matched controls4. Recently, abnormalities in the hippocampus of 3xTg mice were detected using DTI5. Diffusional kurtosis imaging (DKI) is a dMRI technique that quantifies the non-Gaussian properties of water diffusion, contributing additional information beyond that provided by DTI7. Our goal was to investigate the sensitivity of DKI to capture brain microstructural alterations associated with different stages of disease progression (11-18 months old) in the 3xTg mouse model.METHODS:
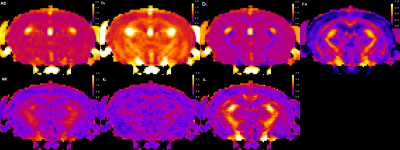
Five female 3xTg mice were studied longitudinally at 11, 15 and 18 months of age. In vivo MRI experiments were performed on a 7T Bruker MRI system (PARAVISION 5.1). A 2-shot SE-EPI sequence was used for DKI acquisition. Sequence parameters: TR/TE=3750/32.6ms, δ/Δ=5/18ms, slice thickness=0.7 mm, 15 slices with no gap, data matrix=128×128, image resolution=156×156μm2, 2 signal acquisitions, 10 b-value=0 images, followed by 30 diffusion encoding gradient directions with 4 b-values for each gradient direction (0.5, 1, 1.5, 2 ms/μm2) and fat suppression flip angle=105°. Total acquisition time=33 minutes. Mean (MD), axial (D‖) and radial (D┴) diffusivity, fractional anisotropy (FA), mean kurtosis (MK), axial (K‖) and radial (K┴) kurtosis, were derived from the DKI data (Figure 1) set using Diffusional Kurtosis Estimator software (DKE; http://www.nitrc.org/projects/dke)9. Regions of interest (ROIs) at the level of the cortex (Ctx), dorsal (DH) and ventral (VH) hippocampus, corpus callosum (CC), fimbria (Fi), external (EC) and internal (IC) capsule were manually drawn in the average b-value=0 image, using ImageJ (http://rsb.info.nih.gov/) (Figure 2). Two-tailed paired t-tests were performed to assess differences in the ROI measurements between the three age groups. The advantage of DKI relative to DTI is that DKI provides estimates for both the diffusivity (MD, D‖, D┴, FA) and kurtosis (MK, K‖, K┴), metrics, while DTI only yields values for the diffusivity metrics. In this way, DKI enables a more comprehensive assessment of the diffusion microenvironment in brain tissue.RESULTS:
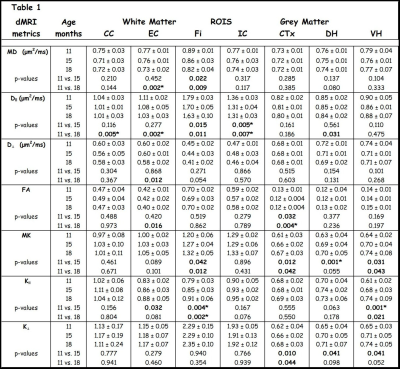
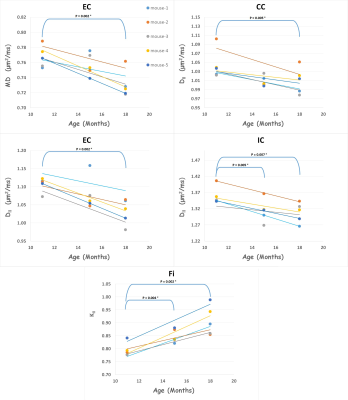
Table 1 shows all age-group means, standard deviations and uncorrected p-values for all the diffusion metrics in each ROI. For WM regions, diffusivity metrics show an overall trend to decrease with age. Even after a Bonferroni correction (7 tests), MD is significantly reduced in the EC, and D‖ is significantly reduced in the CC, EC, IC in 18 months old mice (relative to 11 months). For kurtosis metrics, K‖ is significantly increased in the Fi in both 15 and 18 months old mice (relative to 11 months).
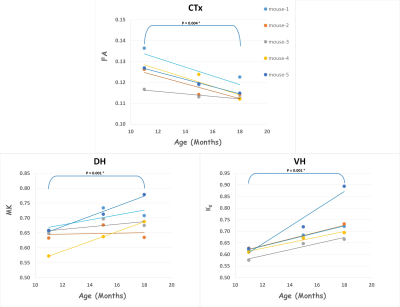
In grey matter (GM) regions, FA is significantly reduced in the Ctx of 18 months old mice. The kurtosis metrics show an overall trend to increase with age, with MK being significantly increased in the DH and K‖ being significantly increased in the VH in 15 months old mice (relative to 11 months). Figure 2 & 3 shows the scatter plots for all WM and GM results that survived Bonferroni correction, respectively.
DISCUSSION & CONCLUSION:
Our results show that dMRI is able to capture age and/or pathology related brain changes in the 3xTg mouse model. As we did not include a control group in this preliminary study, it is not possible to determine the extent to which the observed dMRI changes are related to different stages of disease progression rather than to aging. However, since 3xTg mice are known to have moderate to intense Aβ and tau pathology in this age range (11-18 months), our hypothesis is that Aβ deposition creates a more heterogeneous brain microstructure, leading to an increase in kurtosis metrics, as reported previously in the GM of the PS/APP AD mouse model9,10. The decrease of diffusivity and increase of kurtosis metrics in WM & GM regions with age may be related to morphological changes previously described in this model, such as myelin abnormalities5, tau-related axon pathology1 and inflammation2, which would lead to increased barriers for diffusion. This study is the first application of DKI to 3xTg mice, and it illustrates the enhanced sensitivity, in comparison to DTI, for detecting alterations in brain microstructure provided by the addition of the kurtosis metrics.Acknowledgements
This study was supported, in part, by NIH grant R01AG057602-01References
1. Oddo S, et al. (2003) Neuron, 39(3): 409-421. 2. Oddo S, et al. (2003) Neurobiol Aging, 24(8):1063-70. 3. Oh KJ, et al. (2010) Int J Alzheimers Dis, Article ID 780102. 4. Kastyak-Ibrahimet MZ, et al. (2013) Magn Reson Imaging. 31(9):1515-21. 5. Snow WM, et al. (2017) J Alzheimers Dis, 58(3):841-853. 6. Desai MK, et al. (2009) Glia, 57(1):54-65. 7. Jensen JH, et al. (2005) Magn Reson Med, 53:1432-1440. 8. Tabesh A, et al. (2011) Magn Reson Med, 65(3):823-36. 9. Falangola MF, et al. (2007) 15th Scientific Meeting of the ISMRM, Berlin, Germany, pp. 310. 10. Vanhoutte, G, et al. (2013) Magn Reson Med, 69(4) 1115-1121.Figures


