2028
Characterizing Perfusion and Arterial Transit Time of the Choroid Plexus with Arterial Spin Labeling1Radiology, Beth Israel Deaconess Medical Center & Harvard Medical School, Boston, MA, United States
Synopsis
Choroid plexus signal is readily apparent on Arterial Spin Labeling images but its perfusion characteristics have not been systematically studied. Since the choroid plexus plays an important role in both cerebrospinal fluid production and composition, measuring its function may yield insights into cerebrospinal fluid physiology and disease. In this work, we report initial measurements of the choroid plexus blood flow with noninvasive arterial spin labeling methods using anatomically defined regional measurements.
Introduction
The choroid plexus (CP) is a unique structure located in the ventricles of the brain. It doesn’t participate in neuronal activities, but acts as a secretory tissue responsible for cerebrospinal fluid (CSF) production (1). The capillaries of the CP are fenestrated without blood-brain barrier; instead the blood-CSF barrier is formed by choroidal epithelial cells (2). Because of the unique characteristics of the CP, its perfusion is expected to be different from other regions of the brain.
Recent studies suggest that CSF serves as a drainage pathway for the brain metabolic wastes and toxins (3). CSF may play a critical role in the brain clearance changes related to Alzheimer’s disease (4). Since one-fourth of the blood flow of the CP is secreted as CSF(5,6), the perfusion level of the CP could be a determining factor for CSF generation. Therefore, the study of CP perfusion could provide insights into brain clearance mechanisms and related pathology.
CP signal is commonly apparent on Arterial Spin Labeling (ASL) images but its perfusion characteristics have not been systematically studied. In this work, we report perfusion measurements of the CP with noninvasive ASL to establish a baseline measurement for future research in pathology.
Methods
Experiments were performed on a GE 3T scanner. Two groups of subjects were scanned using 3D pseudo continuous ASL (7). Group one, including 13 subjects, was scanned with a single-delay ASL, with blood labeling for 1.45s and post label delay 1.525s. The second group, including five subjects, was scanned with a three-delay Hadamard encoding ASL (8) with labeling duration 0.57s, 0.89s, and 2.04s and post label delay 1s, 1.57s, and 2.46s. Arterial transit time (ATT) and cerebral blood flow (CBF), including the gray matter blood flow (GMBF) and the CP blood flow (CPBF), were quantified following Dai et al’s work (9). T1 of the blood/tissue was assumed to be 1.6s/1.2s.
A high-resolution anatomic image was acquired with an FSPGR BRAVO sequence at a resolution of 0.94mm x 0.94mm x 1mm in 5 minutes.
The region of the choroid plexus was selected with the following steps: (1) the high-resolution anatomic images were segmented into the gray matter region with SPM12; (2) the CBF map of the single-delay ASL was registered to the gray matter image and anatomic image space. The CBF map was interpolated to match the resolution of the anatomic image. For three-delay ASL, the averaged ASL images of three delays were registered to the gray matter image. The ASL image at each delay, CBF map, and ATT map were transformed to anatomic image space with the same transformation parameters.
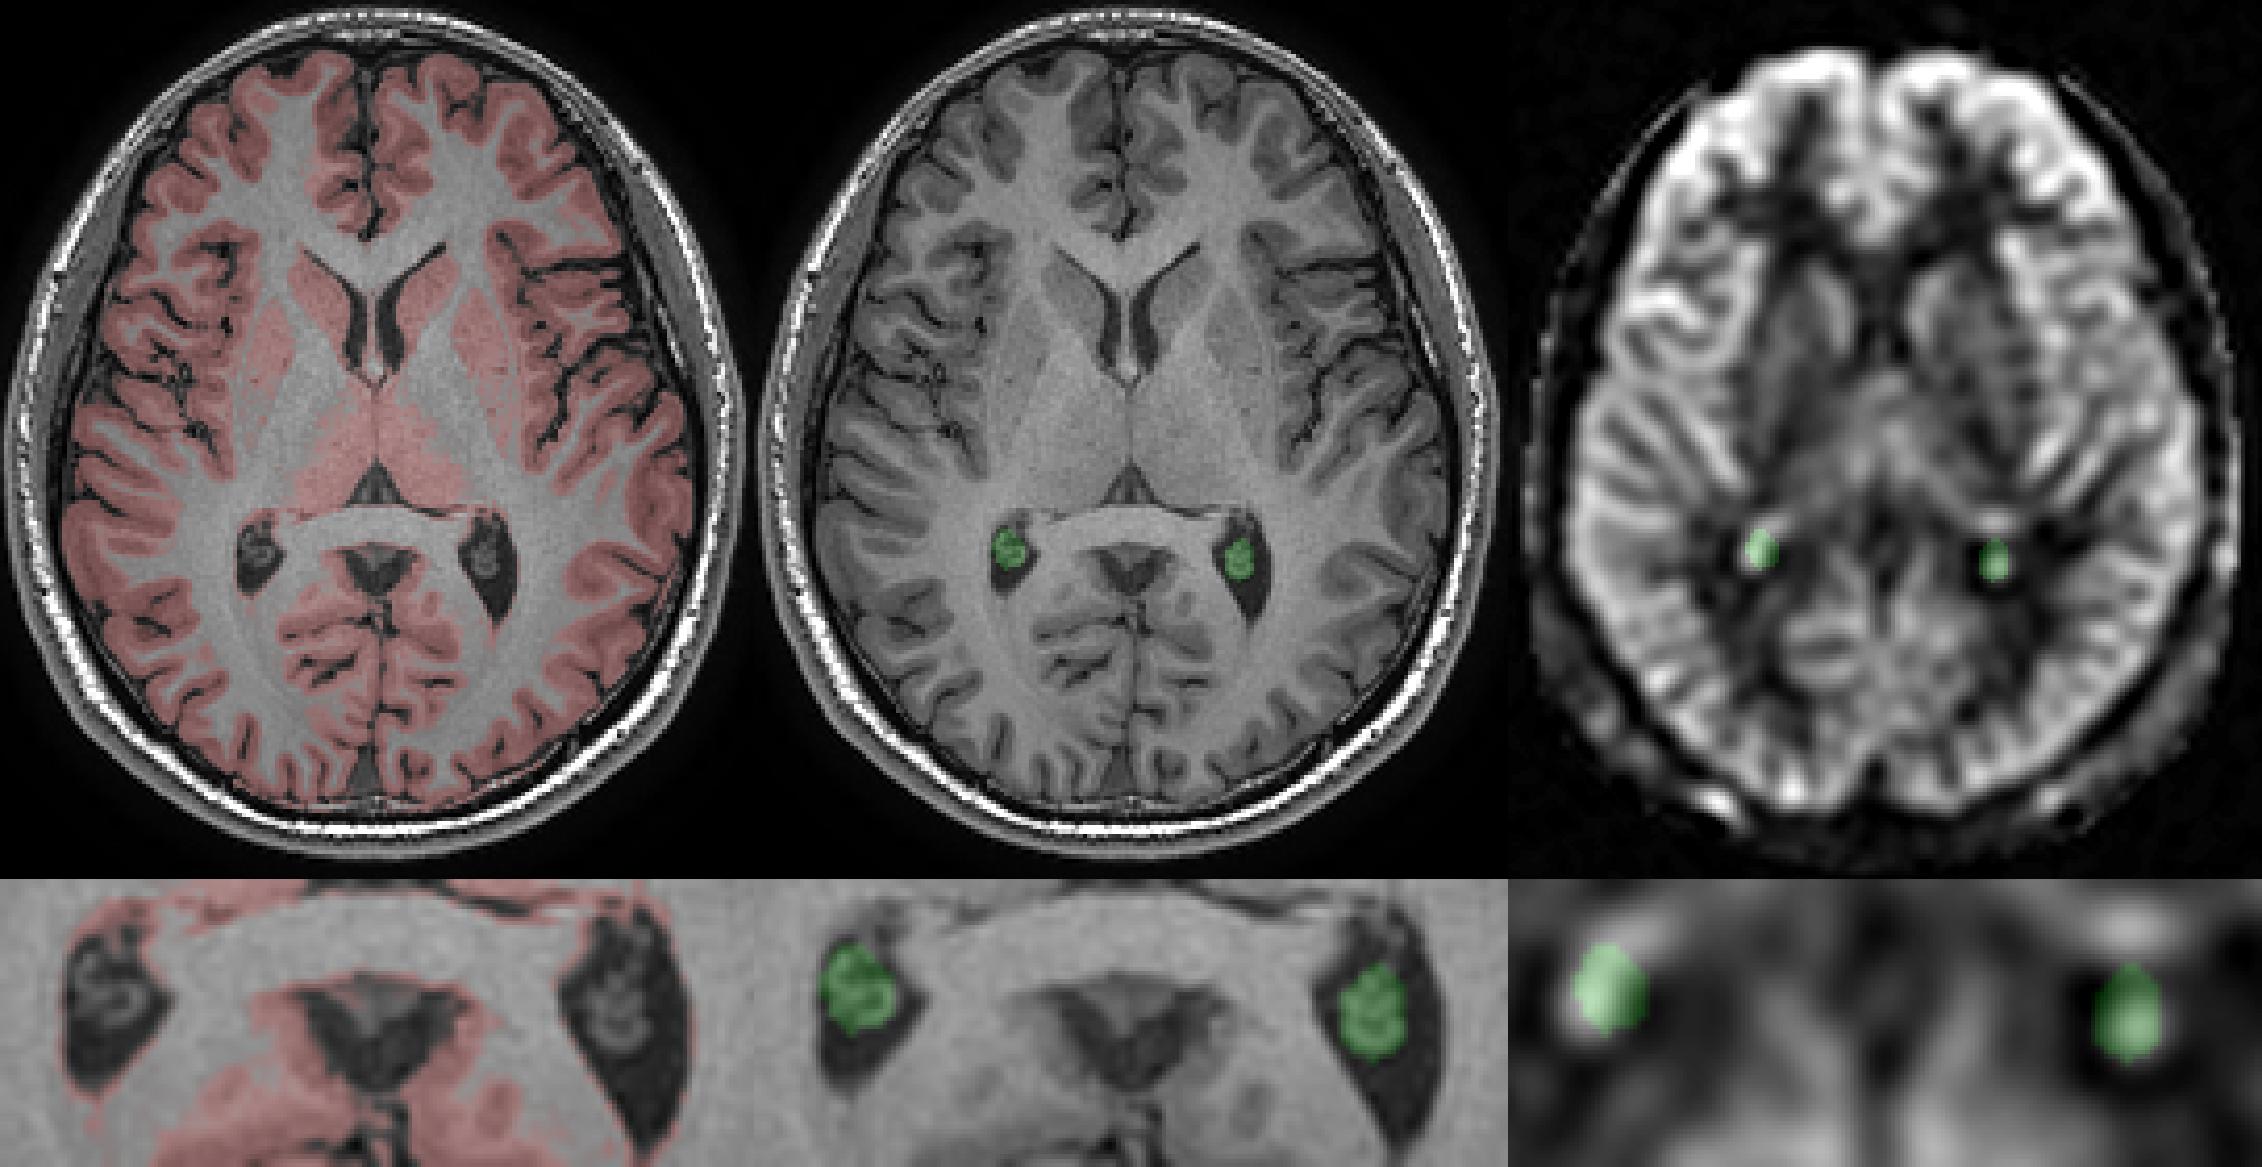
To avoid the inclusion of neighboring tissues, the region of the CP was selected manually as the non-CSF region in the occipital horn of lateral ventricle on the anatomical slice where it is most readily identified, the green region Fig.1 middle. The same ROI was used in the ASL, CBF and ATT images, Fig.1 right. The gray matter binary mask was generated by a constant threshold of the gray matter images, the red region in Fig.1 left. The mean values of the gray matter region were calculated from ASL, CBF and ATT maps.
Results and Discussion
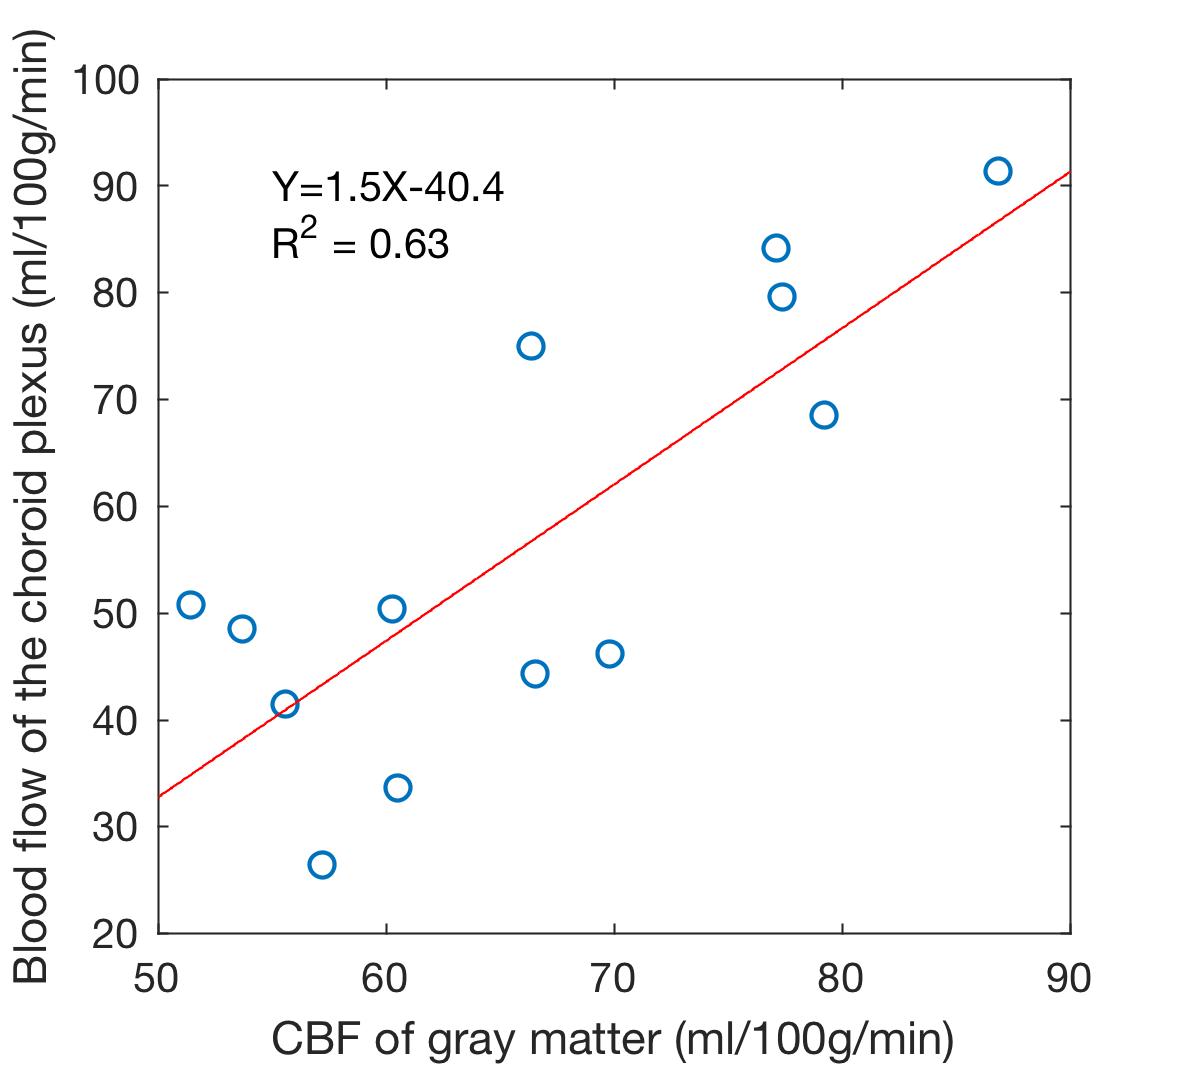
The CP demonstrated bright perfusion signal in all subjects. In the single-delay ASL experiments where a transit time shorter than 1.525s was assumed, the measured CPBF (56.8±20.5ml/100g/min) was slightly lower than GMBF (66.4±11.1ml/100g/min). Interestingly, CPBF and GMBF were correlated across subjects with a correlation coefficient 0.8 (p=0.001), Fig.2. This may suggest a functional or hemodynamic coupling between the tissues, potentially correlated systematic errors in the measurement (labeling efficiency and blood hematocrit).
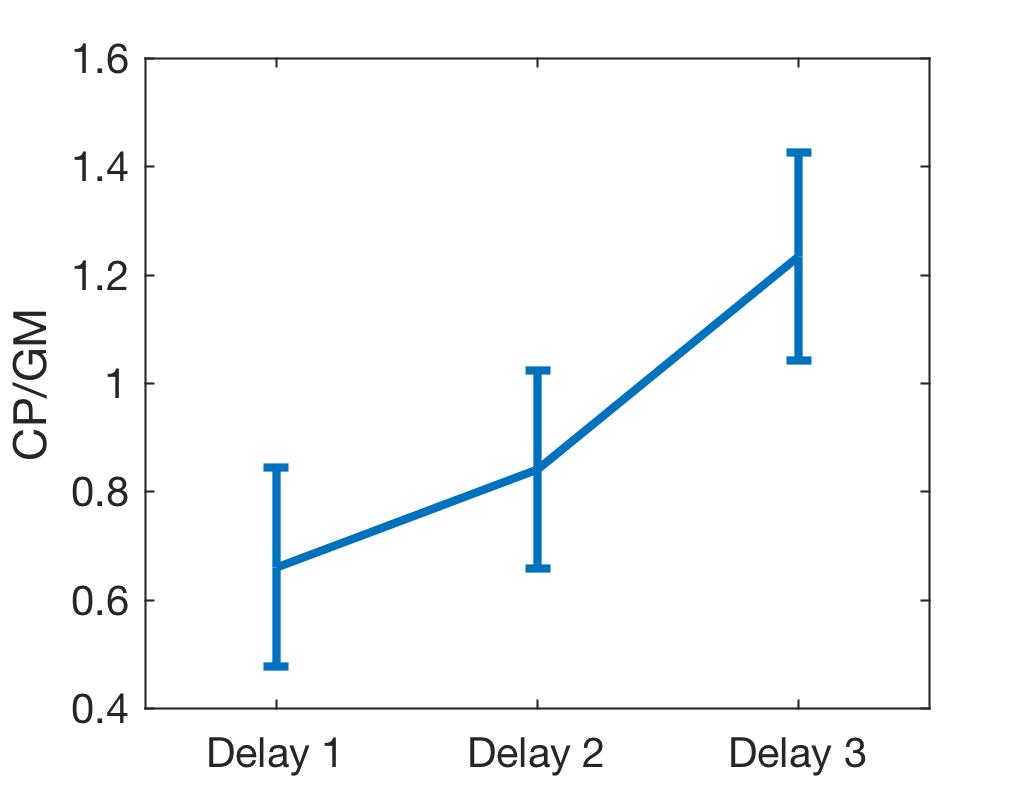
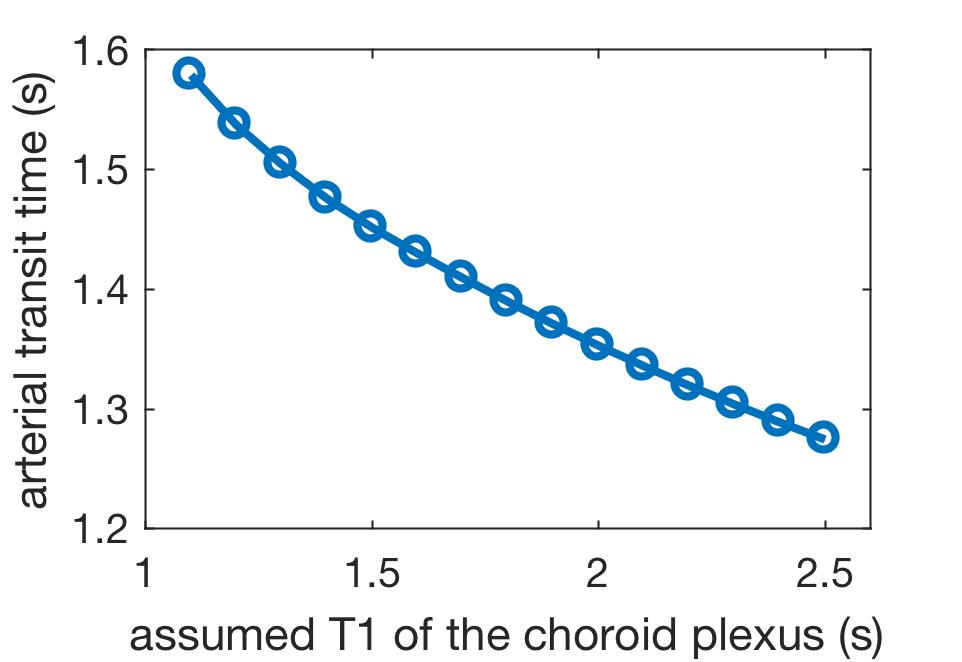
In three-delay ASL, the CPBF (50.8±15.3ml/100g/min) was also in a similar range to the GMBF (48.8±11.3ml/100g/min). Measured CP ATT (1.55±0.1s) was significantly longer than that of gray matter (1.29±0.1s) in a paired t-test (p=0.005). This reflects a higher relative signal in the CP compared to GM at longer delays, Fig.3. However, the ATT estimate is closely associated with the assumed T1 of the CP. Alternative assumptions of T1s will change the mean ATT estimate across subjects, Fig.4. Ongoing experiments with more time delays will help to separate ATT and T1 contributions to the CP ASL signal dynamics.
Conclusion
This work demonstrated that choroid plexus blood flow is readily measurable on 3D arterial spin labeling images. The results indicate different signal dynamics in the choroid plexus relative to gray matter reflect a combination of different arterial transit time and T1. A positive correlation between the blood flow of choroid plexus and gray matter suggest a functional coupling between the two.Acknowledgements
No acknowledgement found.References
1. Lun MP, Monuki ES, Lehtinen MK. Development and functions of the choroid plexus–cerebrospinal fluid system. Nat. Rev. Neurosci. 2015;16:445–457. doi: 10.1038/nrn3921.
2. Brinker T, Stopa E, Morrison J, Klinge P. A new look at cerebrospinal fluid circulation. Fluids Barriers CNS 2014;11:10. doi: 10.1186/2045-8118-11-10.
3. Benveniste H, Lee H, Volkow ND. The Glymphatic Pathway. Neuroscientist 2017;151:1073858417691030. doi: 10.1177/1073858417691030.
4. Silverberg GD, Heit G, Huhn S, Jaffe RA, Chang SD, Bronte-Stewart H, Rubenstein E, Possin K, Saul TA. The cerebrospinal fluid production rate is reduced in dementia of the Alzheimer’s type. Neurology 2001;57:1763–1766. doi: 10.1212/WNL.57.10.1763.
5. Welch K. Secretion of Cerebrospinal Fluid By Choroid Plexus of the Rabbit. Am. J. Physiol. 1963;205:617–24.
6. Redzic ZB, Preston JE, Duncan JA, Chodobski A, Szmydynger-Chodobska J. The Choroid Plexus-Cerebrospinal Fluid System: From Development to Aging. Curr. Top. Dev. Biol. 2005;71:1–52. doi: 10.1016/S0070-2153(05)71001-2.
7. Dai W, Garcia D, De Bazelaire C, Alsop DC. Continuous Flow-Driven Inversion for Arterial Spin Labeling Using Pulsed Radio Frequency and Gradient Fields. Magn. Reson. Med. 2008;60:1488–1497. doi: 10.1002/mrm.21790.
8. Dai W, Shankaranarayanan A, Alsop DC. Volumetric measurement of perfusion and arterial transit delay using hadamard encoded continuous arterial spin labeling. Magn. Reson. Med. 2013;69:1014–1022. doi: 10.1002/mrm.24335.
9. Dai W, Robson PM, Shankaranarayanan A, Alsop DC. Reduced resolution transit delay prescan for quantitative continuous arterial spin labeling perfusion imaging. Magn. Reson. Med. 2012;67:1252–1265. doi: 10.1002/mrm.23103.
Figures