2024
The brain functional network alterations of AD and MCI detected by DCCA1Clincial Science, Philips Healthcare, Beijing, China, 2Biomedical Engineering, Capital Medical University, Beijing, China
Synopsis
Pearson’s Correlation analysis has been applied to construct the connectivity network and describe the connectivity strength between different brain function areas. But the correlation coefficient was sensitive to the noise and just for stationary signals. In this study, a new functional connectivity network constructing method based on DCCA (Detrend Cross Correlation Analysis) for non-stationary signals was proposed and applied on AD and MCI.
Purpose
In the last decades, bold-based functional magnetic resonance imaging has been used to character the brain functional connectivity and applied to neurological diseases. Pearson Correlation analysis has been applied to construct the connectivity network and describe the connectivity strength between different brain function areas. But the correlation coefficient was sensitive to the noise and just for stationary signals. And the fMRI signals may contain some non-stationary processes1. In this study, a new functional connectivity network constructing method based on DCCA (Detrend Cross Correlation Analysis) for non-stationary signals was proposed and applied on AD and MCI.Methods
Bold-based fMRI and 3D T1w structural MRI images of 23 AD patients, 39 MCI patients and 32 normal controls were obtained from the ADNI (website: http://adni.loni.usc.edu/ ). All these subjects are age- and sex- matched. Pre-processing procedures including slice timing, head motion correction and nuisance covariates regression (realign parameter, white matter and CSF signals), filtering (0.01-0.1Hz), normalization by using 3D T1w structure MRI images and DARTEL , smooth by DARTEL were carried out based on DPARSFA software (website: http://rfmri.org/DPARSF). And then the time series within each region based on AAL template (116 sub-regions) were extracted for the next network construction. DCCA is a multiscale analysis method especially for non-stationary signals and is robust to noise. Details of this method can be found in the previous work2. In this work, DCCA was applied to character the relationship between the extracted time series and construct the functional connectivity networks. Finally, there are 2 connectivity networks at 2 different scales (60 time points window and full time points window same as conventional Pearson’s correlation) for each subject. And the connectivity network constructed by conventional Pearson’s Correlation was also obtained for each subject. The connectivity networks were threshold by PSW method. Some network parameters including small worldness index, characteristic path length, clustering coefficient, global and local efficiency were calculated based on the weighted networks at different PSWs (0.05-0.4, interval 0.05). ANOVA and two-sample students’ T-test analysis (p<0.05) were carried out for the difference investigation of the 3 groups and each-pair of the groups respectively.Results
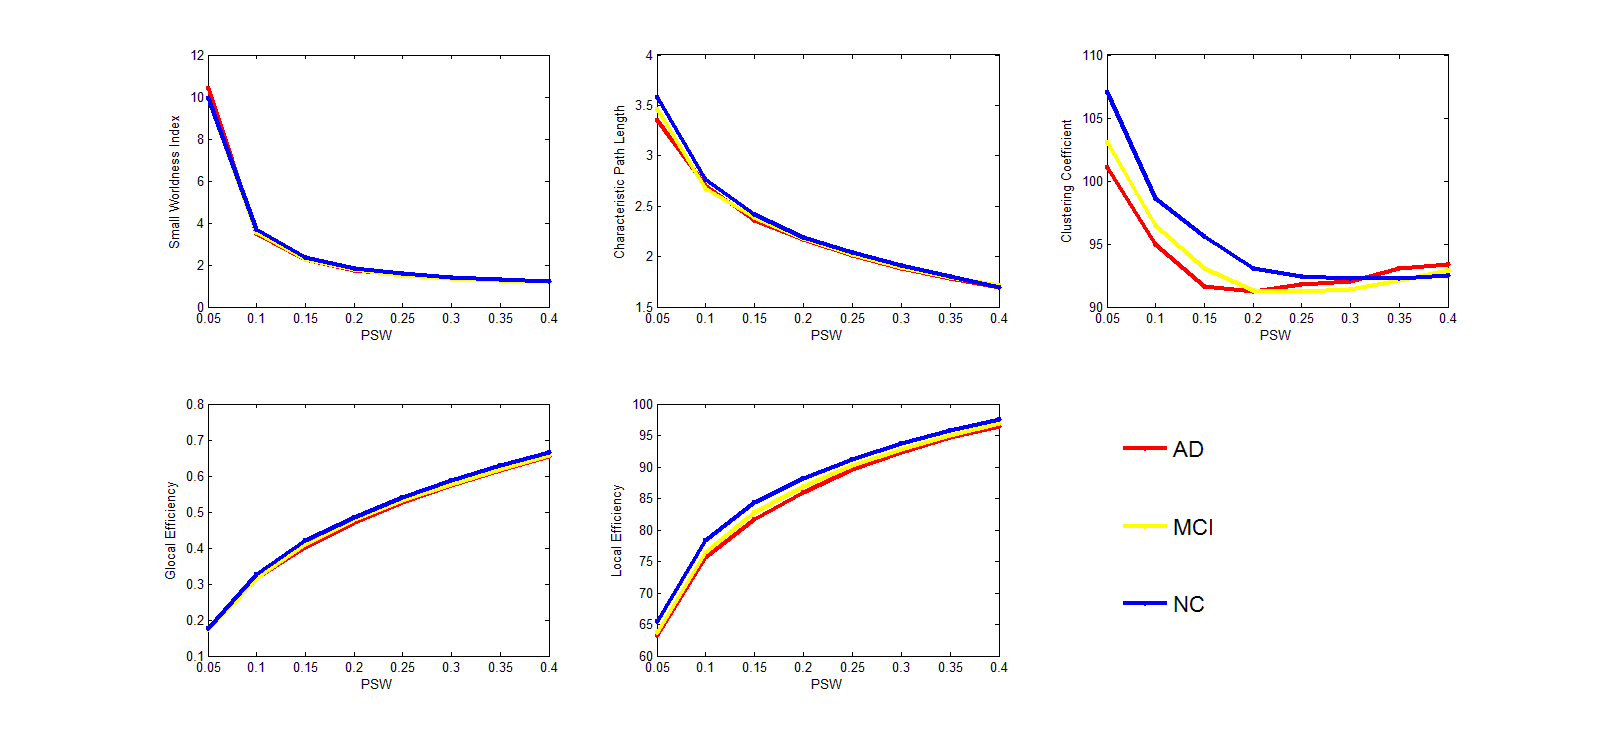
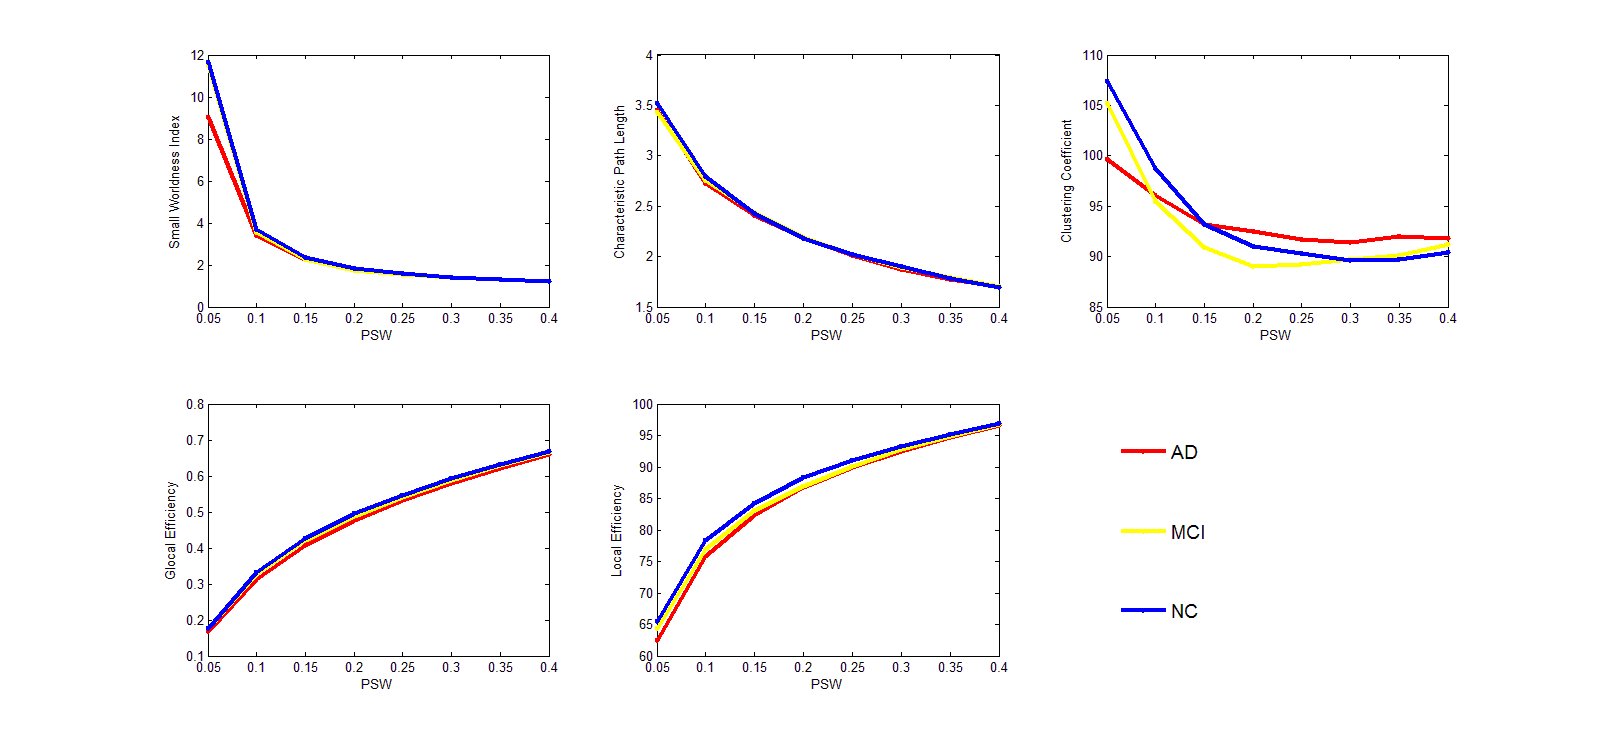
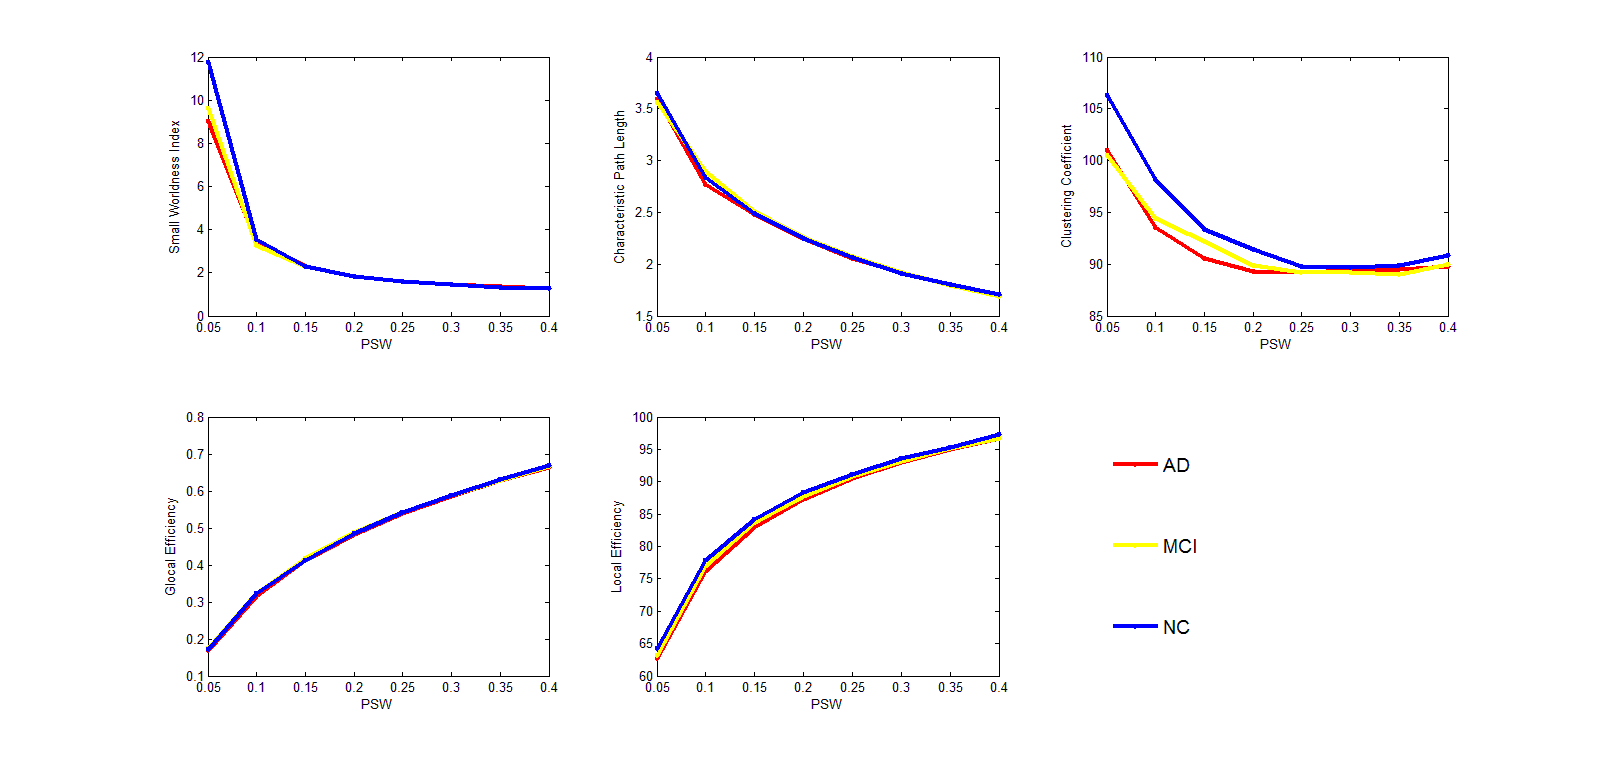
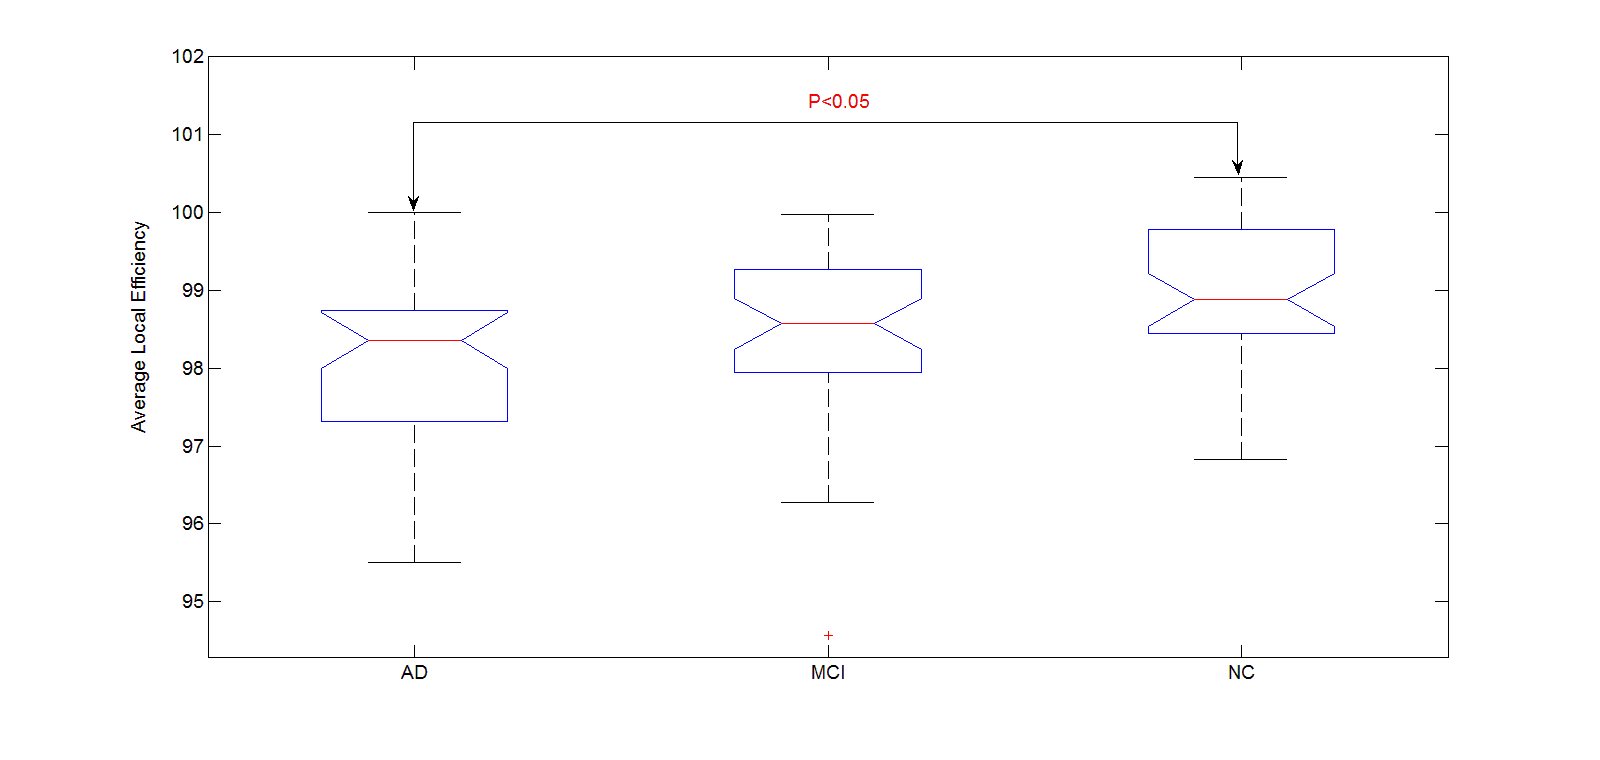
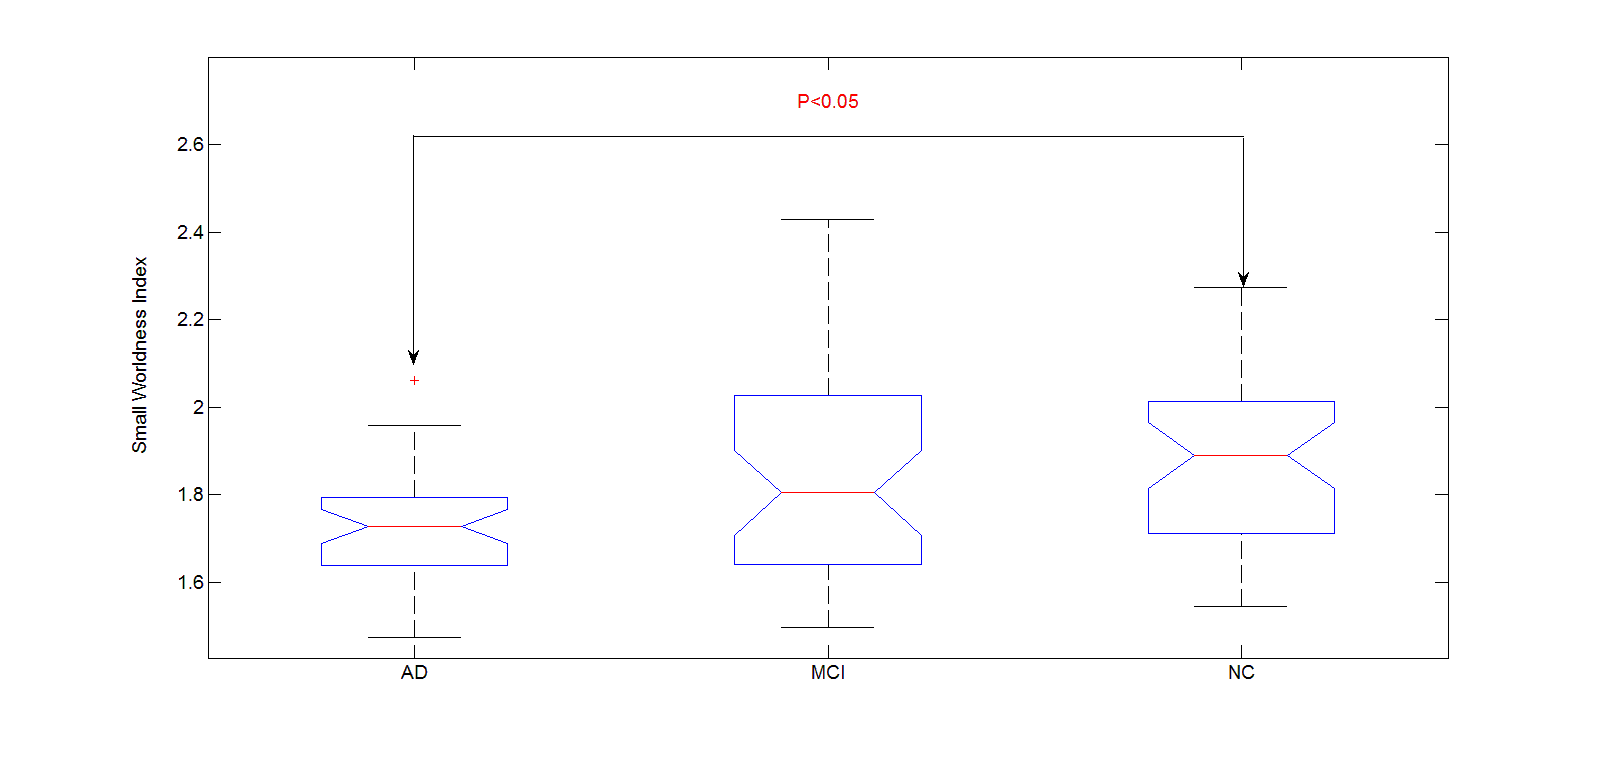
The parameters by the PSWs of Pearson’s correlation and DCCA at 2 scales were shown in Figure 1-3. ANOVA and two-sample student’s T-test analysis results showed some network parameters including local efficiency with Pearson’s correlation (Figure 4) and small worldness index with DCCA at scale of 60 time points window were significant different (Figure 5).Discussion
DCCA is a kind of temporal multi-scale signal analysis technique and is robust to noise. It has been used to analyze non-stationary signals effectively in the last decades2. Functional MRI signals contain various noise caused by breath, heartbeat and scanning machine itself. And what’s more important, it contains non-stationary contents such as very low frequency fluctuations. This work applied the DCCA method to construct the connectivity matrix and showed its comparative ability to describe the functional network characteristics compared to Pearson’s correlation method, which indicated that the DCCA is an effective and reliable method to construct the functional connectivity network. For both Pearson’s correlation and DCCA analysis, there showed no difference between MCI and NC or MCI and AD. This might due to that the functional networks of MCI patients alterated but still keep the main function and organization of brain network. As shown Figure1-3 we can find the network parameters of MCI located between AD and NC for a specific PSW range, which indicated the MCI was an intermediate state of AD and NC. And these findings were consistent with previous studies.Conclusion
DCCA can be applied to construct the functional connectivity networks effectively, which would provide a new method for nonstationary functional signals analysis.Acknowledgements
No acknowledgement found.References
[1] Robert X.S, Kay J, Beau A and Danny J.J.W. Wavelet-based regularity analysis reveals Recurrent Spatiotemporal Behavior in Resting-state fMRI. Hum Brain Mapp., 2015; 36(9): 3603-3620.
[2] Zebende G.F. DCCA cross-correlation coefficient: Quantifying level of cross-correlation. Physica A, 2011; 390: 614-618.
Figures