2019
Prediction of long-term evolution of cognitive impairment following stroke using resting-state functional connectivity.1Univ. Lille, INSERM, CHRU Lille, U1171 – Neurodegenerative and vascular disorders, Lille, France
Synopsis
The mechanisms of chronic post-stroke cognitive impairments are currently poor understood. However, the study of functional connectivity gives new opportunities to better elucidate the physiopathology. Here, using resting functional connectivity and a machine learning approach, we tried to predict the evolution of cognitive functions up to 36 months after stroke. The results showed that the prediction capacity depends on the studied cognitive domain, and that a particular focus should be done on frontal and temporal cortices.
INTRODUCTION
Despite a high prevalence, the mechanisms conducting to the appearance of cognitive disorders following stroke are poorly understood1. However, previous studies showed that the resting functional connectivity can be an interesting tool to study the physiopathology of post-stroke cognitive impairment at chronic phase2. The aim of this study was to evaluate the ability of the resting functional connectivity to predict the cognitive decline at long term after stroke. To do so, functional brain connectivity at rest measured 6 months after stroke was used as input of a ridge regression machine learning model in order to predict the cognitive decline 36 months after stroke.METHODS
67 patients who had a first ischemic stroke and free of dementia (STROKDEM cohort, NCT01330160) were followed at 72 hours, 6 and 36 months after stroke. All of patients undergone a resting-state functional imaging with a 3T MR Achieva scanner (Phillips, The Netherland) using a 10-minute echo planar imaging sequence with the following parameters: TR/TE: 2400/30 ms; voxel size: 3 mm3; matrix size: 64 x 64 x 40 voxels; flip angle: 90°; 250 volumes. Participants were instructed to close their eyes, and stay awake. The 3 first volumes were discarded and a slice-timing correction was applied using the first volume as reference. The remaining volumes were realigned and corrected for any head motion. Finally, a high pass filter (0.007 Hz) was applied and artefacts from motions as well as scanner noises were removed using FSL-FIX. A clinical and neuropsychological evaluations of patients were done at each step of the follow-up with the assessment of 4 cognitive domains: language, memory, executive and visuo-perceptive functions. The cognitive evolution was measured using the difference between the scores measured at 6 and 36 months post-stroke. The prediction of this cognitive evolution was done using functional connectivity measured at 6 months after stroke and a machine learning algorithm called “ridge regression”. This regression model includes a regularization step that limits overfitting by reducing prediction weights. This model takes as input the connectivity values of 178 connections that forms a functional network previously showed as altered in post-stroke cognitive impairment 3. The efficiency of the machine learning algorithm was evaluated by a leave-one out approach. The predictions were considered as significant for p<0.05 using a null model with permutations (n=10000). Finally, the efficiency of the predictions was evaluated using the square of the regression coefficient (R², mentioned as “explained variance”) between the predicted and observed values. Prediction weights were finally projected on brain glass to visualize the most predictive connections using BrainNetRESULTS
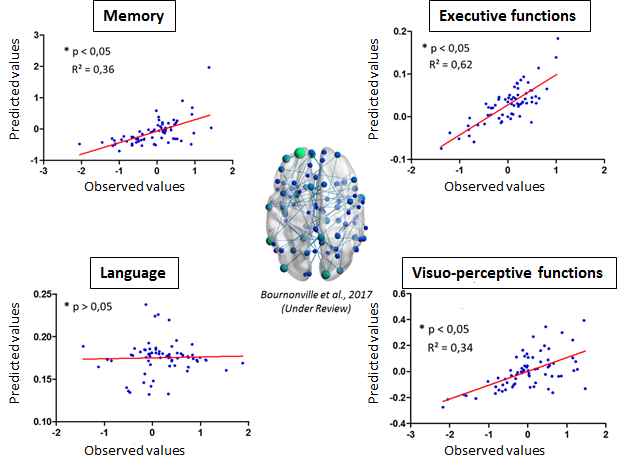
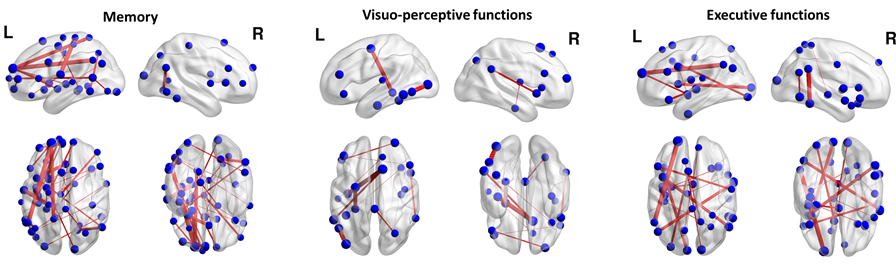
Excepted for the language, the evolution of each cognitive domain was predicted (Figure 1, p < 0.05) with an explained variance rising from 30% (memory and executive functions) to 60% (visuo-perceptive functions). For the memory evolution, the most predictive connections concerned the left medial frontal cortex as well as the left insula and anterior cingulate cortices, the left precuneus and the right and left temporal cortex (Figure 2). For the executive functions evolution between 6 and 36 months post-stroke, the most predictive connections concerned the left medial frontal cortex, the left insula and cuneus, the left and right temporal cortex and the left fusiform and supramarginal cortices. Finally, the most predictive connections for the visuo-perceptive functions concerned the left hippocampus, the left and right temporal cortex, the left fusiform and frontal cortices and the left occipital cortex.CONCLUSION
This study showed the interest of using functional connectivity 6 months after stroke to predict the evolution of the cognitive functions up to 36 months after the stroke. Despite the absence of prediction for the evolution of language, the analysis highlighted the importance of medial frontal and temporal cortices in the long term cognitive evolution. Further work could be needed to better improve the long-term prediction using structural characteristics of brain pre-vulnerability, such as cerebral small vessel diseases, known to significantly alter the cognitive function4.Acknowledgements
No acknowledgement found.References
1. Dichgans M, Leys D. Vascular Cognitive Impairment. Circ Res. 2017;120:573–591.
2. Siegel JS, Ramsey LE, Snyder AZ, et al. Disruptions of network connectivity predict impairment in multiple behavioral domains after stroke. Proc Natl Acad Sci. 2016;113:E4367–E4376.
3. Bournonville C, Hénon H, Delamaire C, Bombois S, Mendyck AM, Cordonnier C, Moulin S, Leclerc X, Bordet R, Lopes R. Identification of a specific functional network altered in post-stroke cognitive impairment. Neurology, under review.
4. Rost NS, Rahman RM, Biffi A, et al. White matter hyperintensity volume is increased in small vessel stroke subtypes. Neurology. 2010;75:1670–1677.
Figures