2015
Assessment of mild cognitive impairment detection in a community-dwelling population using quantitative, multiparametric MRI-based classification1Psychology, Leiden University, Leiden, Netherlands, 2Radiology, Leiden University Medical Center, Leiden, Netherlands, 3Leiden Institute for Brain and Cognition, Leiden University, Leiden, Netherlands, 4Radiology and Nuclear Medicine, Erasmus MC University Medical Center, Rotterdam, Netherlands, 5Epidemiology, Erasmus MC University Medical Center, Rotterdam, Netherlands, 6Medical Informatics, Erasmus MC University Medical Center, Rotterdam, Netherlands, 7Applied Sciences, Delft University of Technology, Delft, Netherlands, 8Neurology, Erasmus MC University Medical Center, Rotterdam, Netherlands
Synopsis
Multiparametric MRI-based classification algorithms improve classification of dementia over single measure classifications. Yet, how accurate these algorithms are in identifying subjects with mild cognitive impairment (MCI) in a general population is unclear. We evaluated single and multiparametric algorithms that include structural and diffusion tensor MRI in their potential to accurately differentiate MCI from normal aging subjects in a community-dwelling population. While highest classification rates were observed for multiparametric algorithms, overall classification performance was low (AUC: 0.524-0.631). Our results suggest that accurate MRI-based single subject detection of MCI within a population-based setting may be difficult to achieve using MR imaging alone.
Introduction
Early and accurate detection of mild cognitive impairment (MCI) is important for improving care of patients at risk of developing dementia.1 MRI-derived differences in gray (GM) and white matter (WM) volumes may inform on MCI stage and progression.2,3 However, MRI-based single subject MCI detection may be more complex.4,5 Multiparametric MRI-based classification algorithms are promising in subject-based differentiation between patients and controls.4,6,7 However, how accurate these algorithms are in differentiating MCI from cognitively normal subjects in a general population is unknown. We therefore evaluated the accuracy of several MRI-based algorithms in classifying MCI from normal aging based on structural MRI and diffusion tensor imaging (DTI) measures in a community-dwelling cohort.Materials & Methods
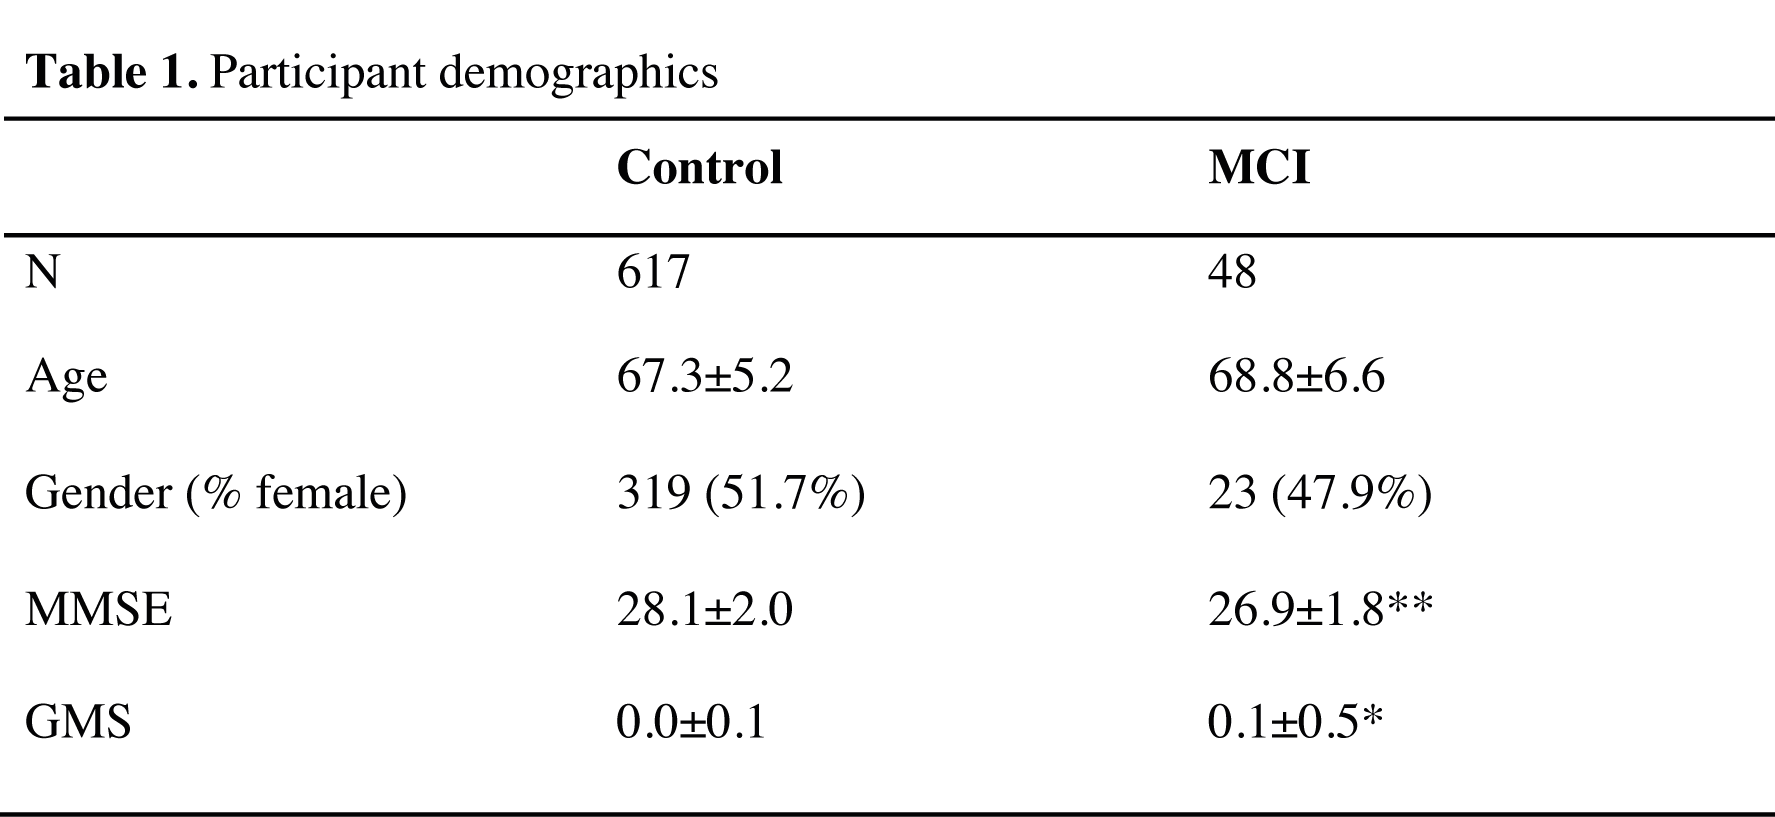
This study was based on community-dwelling subjects from the Rotterdam Study. For the present analyses we selected all subjects aged > 60 years who underwent MRI in the period 2002 – 2005 and had MCI screening according to a validated algorithm.8 We included 48 MCI (age: 61.4-91.7 years) and 617 control subjects (age: 60.7 – 89.2 years; Table 1). All participants underwent 1.5T MRI (GE Healthcare) including 3D T1-weighted and DTI to obtain maps of fractional anisotropy (FA) and mean diffusivity (MD).8 T1-weighted images were used for tissue type segmentation.9 Probabilistic GM and WM maps were then used to determine regional GM density (GMD) of 96 Harvard-Oxford cortical and 14 subcortical regions after coregistration with the MNI152 template. The 20 tracts of the Johns-Hopkins university tractography atlas were used to determine regional measurements of WM density (WMD). These regions were also used to derive regional FA and MD measurements, mapped on a skeleton using tract-based spatial statistics.10 Imaging measures combined with age and gender were subsequently used for classification analysis. Classification accuracy was determined using repeated nested cross validation with an elastic net regression classifier.11 Classifier parameter settings were obtained using a 10-fold inner-loop, followed by a 10-fold outer-loop to determine overall classification accuracy. This was repeated 25 times to reduce variance resulting from random partitioning in training and test folds. MRI measures were step-wise added to the best performing combination of the previous step, starting with the most accurate single measure. Classification accuracy was expressed as area under the receiver operating characteristic curve (ROC) obtained by iteratively comparing classification scores (between 0 and 1) with the corresponding diagnosis. Measures of sensitivity, specificity, and accuracy were derived from the optimal operating point on the ROC curve. A bootstrap percentile method (N=5000) with Bonferroni correction was used to compare the ROC curves of single measure and the best performing multiparametric classifications. Permutation testing with maximum statistic-based family-wise error correction (N=5000) was used to determine whether classification performance was better than random chance classifications.13 P<0.05 was considered significant.Results
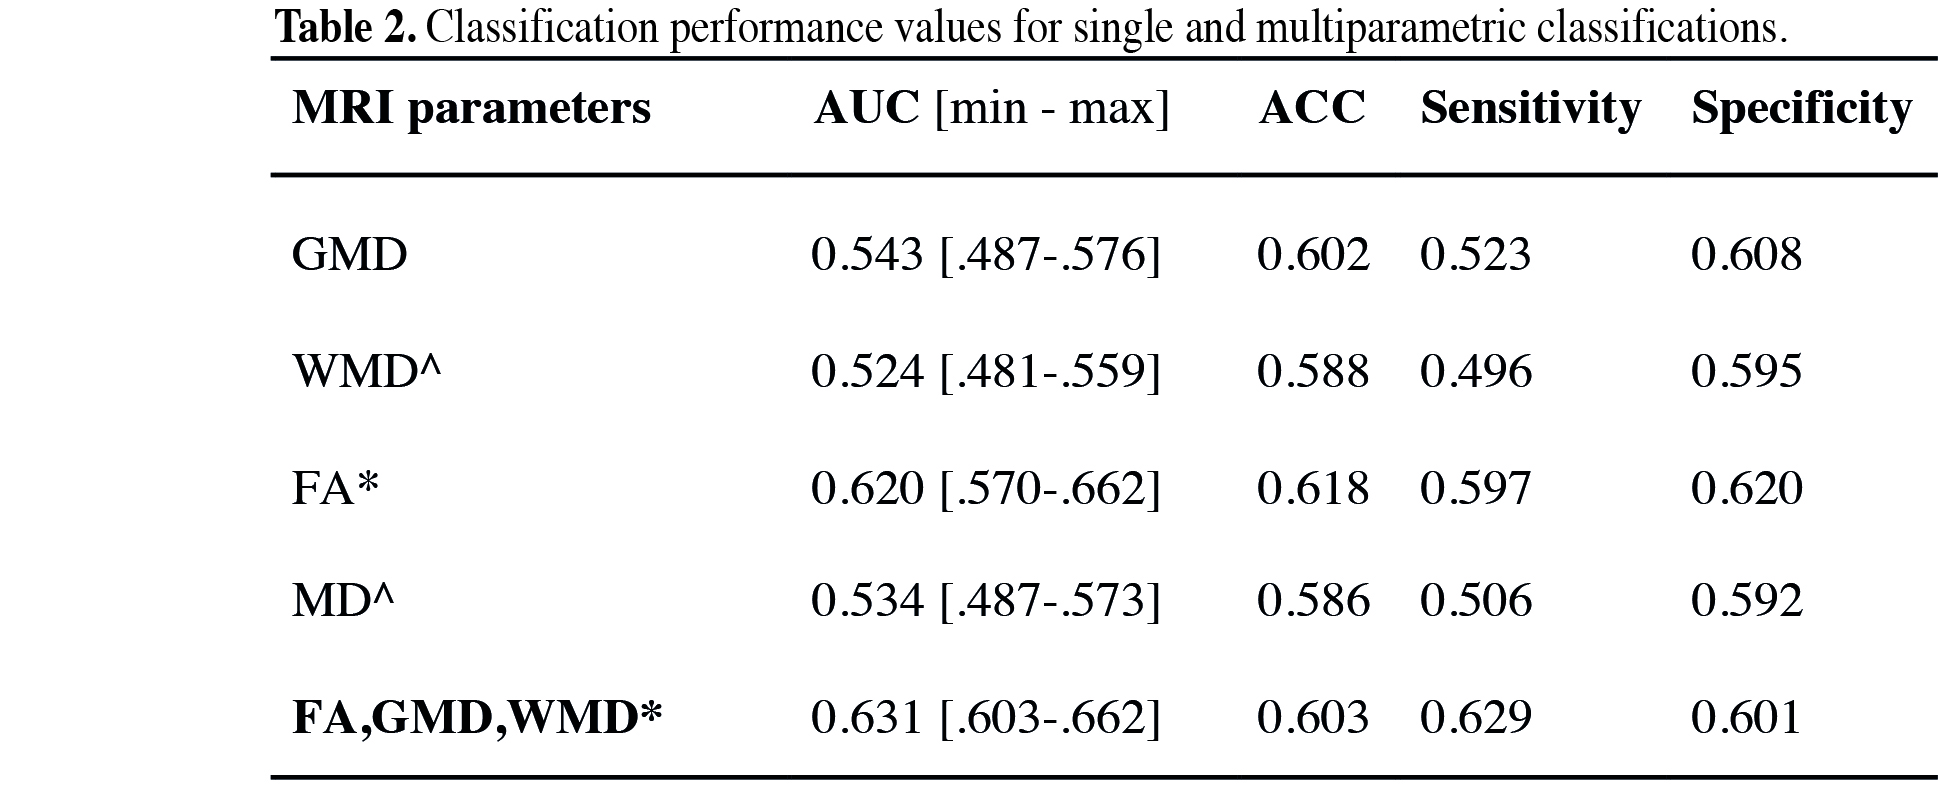
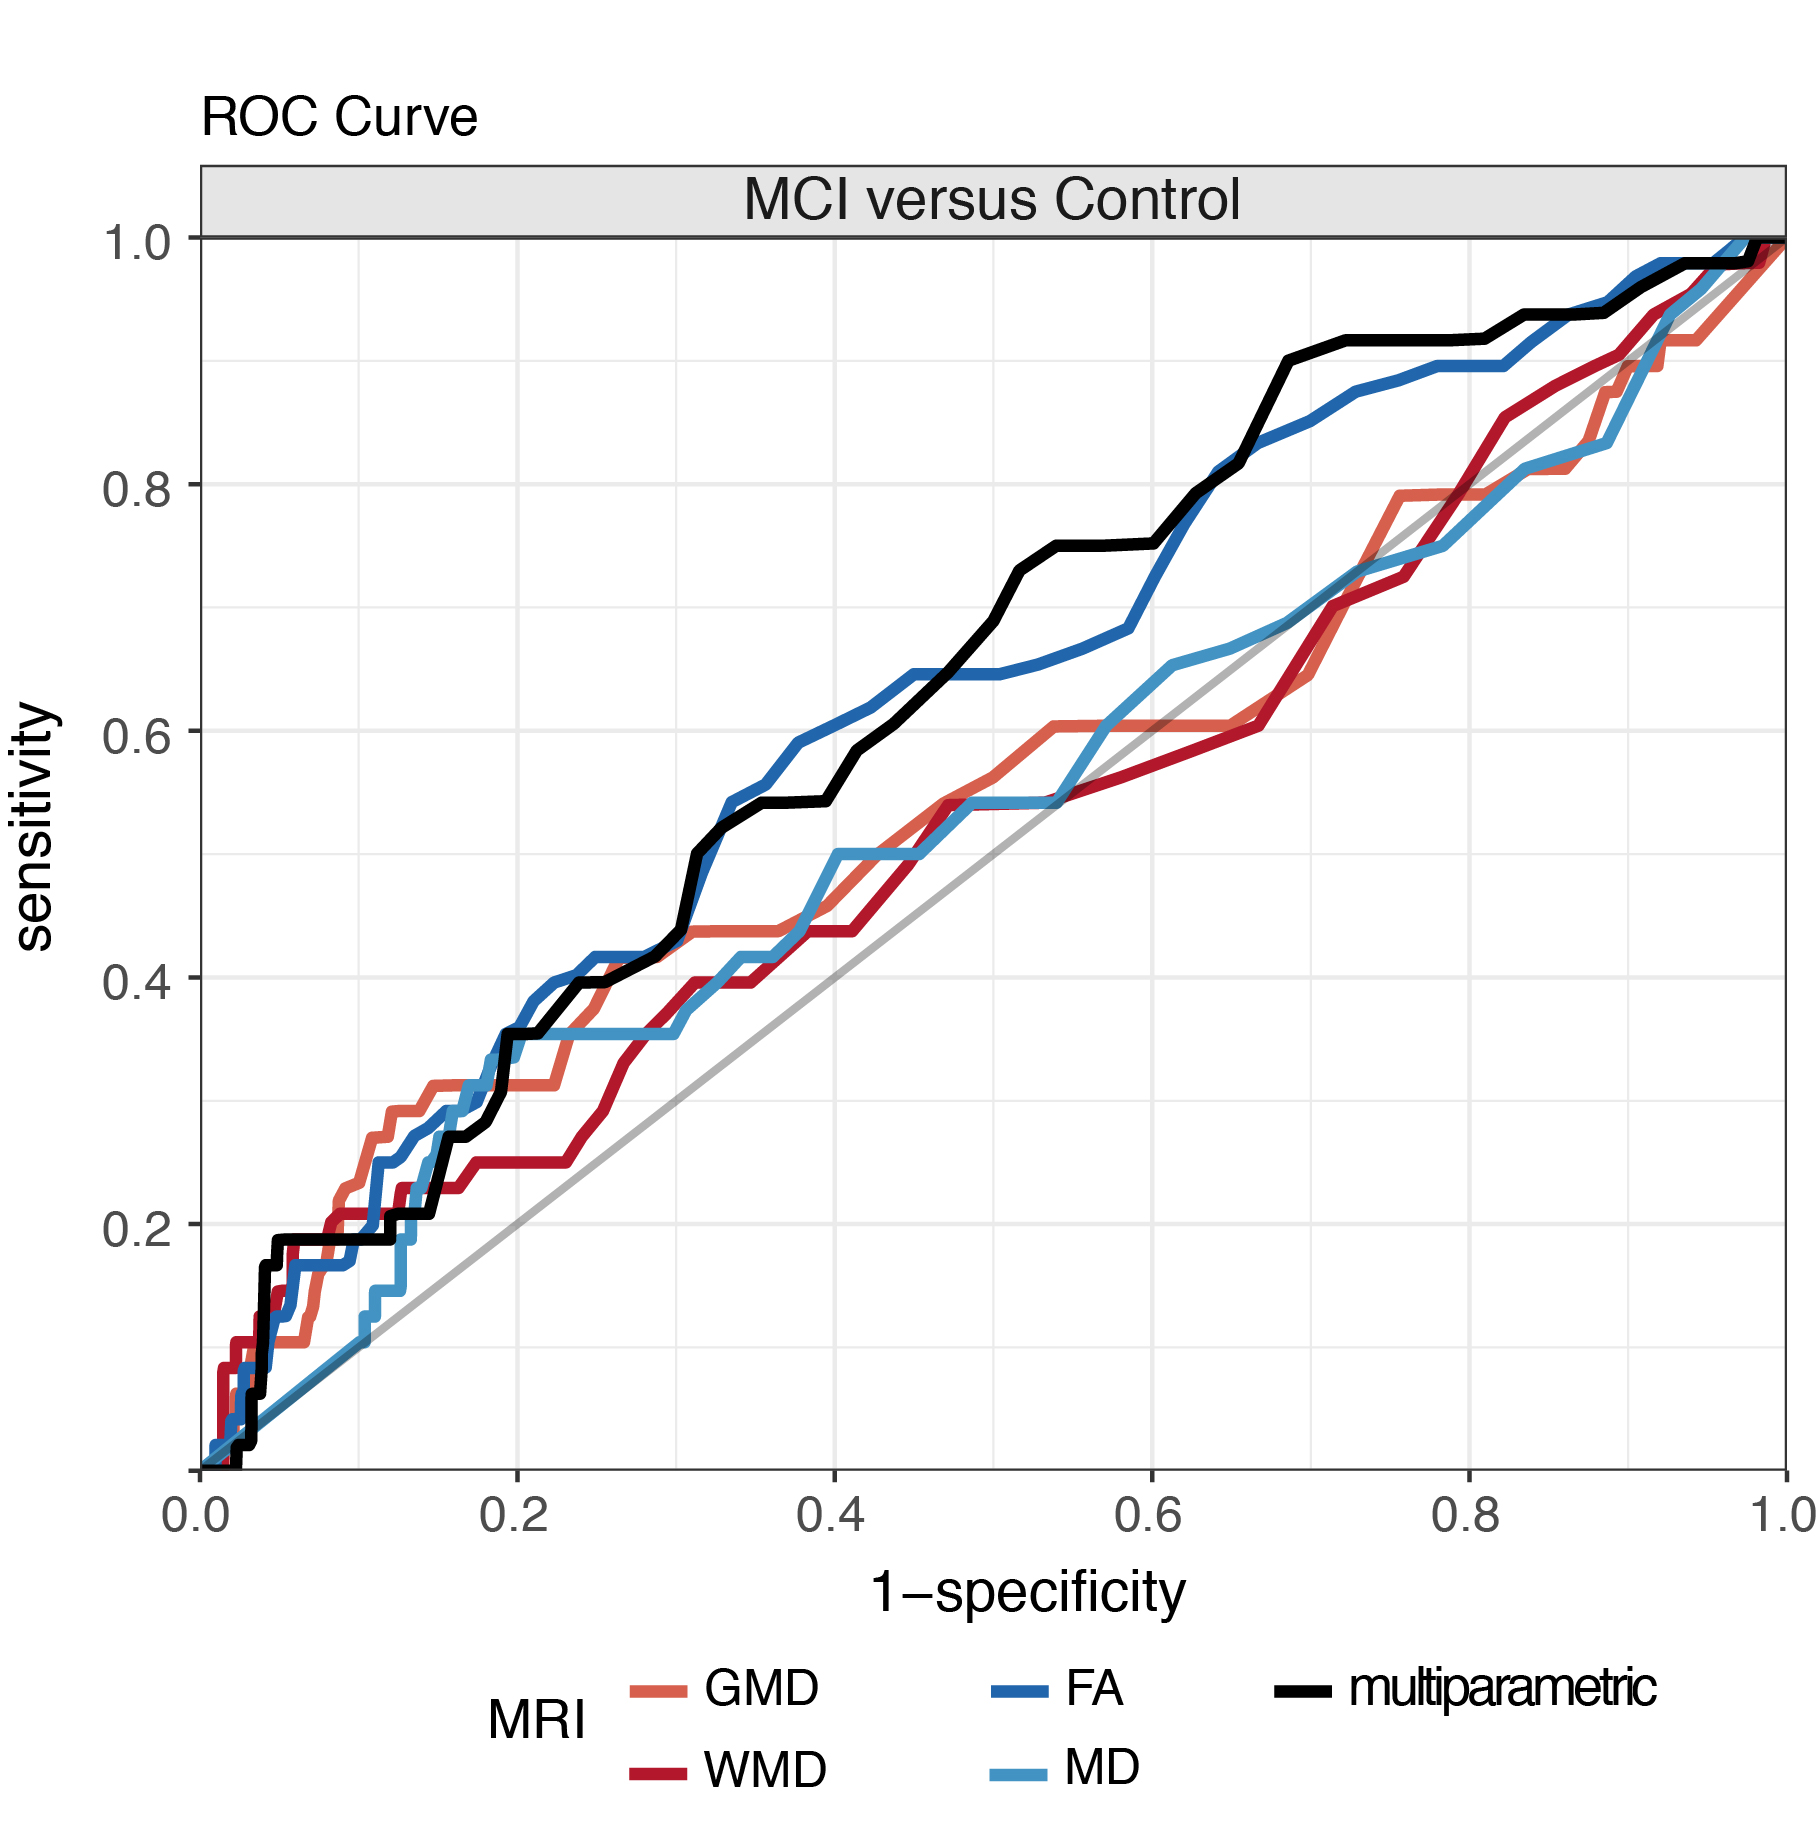
A multiparametric model that included FA, GMD, and WMD measures resulted in overall highest AUC values (mean AUC=0.631) (Table 2, Figure 1). AUC values of the multiparametric model were significantly higher than those obtained with single measure models, except for FA (AUC=0.620, p=0.390 versus multiparametric classification) and GMD (AUC=0.543, p=0.06 versus multiparametric classification) (Table 2). Classification performance values of the multiparametric model were furthermore higher than random chance classifications (p=0.003). For single measure classifications, this was only observed for FA-based classifications (p=0.0048) (Table 2).Discussion
Single MRI measure-based methods were unable to differentiate between MCI and normal aging subjects; only FA-based classifications exceeded random classification levels. While multiparametric models improved MCI versus control classification accuracy compared with WMD- and MD-based methods, classifications were not significantly better than FA-based differentiations. Furthermore, in particular when compared with accuracy rates of smaller cohorts in a clinical setting4,14, classification accuracy rates in our population-based study were low (AUC: 0.524-0.631). In a general population accurate MCI detection may be challenged by differences between MCI and normal aging subjects that are less conspicuous5,8 or more heterogeneous14 than in carefully selected clinical cohorts. Our results suggest that accurate MRI-based single subject detection of MCI may be hard to achieve within a population-based setting using MR imaging alone.Conclusion
We could not show that multiparametric
MRI-based classification is effective in accurately detecting MCI
in a general population.Acknowledgements
This study was supported by VICI grant no. 016.130.677 of the Netherlands Organization for Scientific Research (NWO).References
- Petersen RC. Mild Cognitive Impairment. N Engl J Med 2011; 36: 2227–2234.
- Frisoni GB, Fox NC, Jack CR, et al. The clinical use of structural MRI in Alzheimer disease. Nat Rev Neurol 2010; 6: 67–77.
- Zhang B, Xu Y, Zhu B, Kantarci K. The Role of Diffusion Tensor Imaging in Detecting Microstructural Changes in Prodromal Alzheimer’s Disease. CNS Neurosci Ther 2014; 20: 3–9.
- Rathore S, Habes M, Iftikhar MA, et al. A review on neuroimaging-based classification studies and associated feature extraction methods for Alzheimer’s disease and its prodromal stages. Neuroimage. 2017; 155: 530–548.
- Eskildsen SF, Coupé P, García-Lorenzo D, et al. Prediction of Alzheimer’s disease in subjects with mild cognitive impairment from the ADNI cohort using patterns of cortical thinning. Neuroimage 2013; 65: 511–521.
- Schouten TM, Loitfelder M, de Vos F, et al. Combining anatomical, diffusion, and resting state functional magnetic resonance imaging for individual classification of mild and moderate Alzheimer’s disease. NeuroImage Clin 2016; 11: 46–51.
- de Vos F, Schouten TM, Hafkemeijer A, et al. Combining multiple anatomical MRI measures improves Alzheimer’s disease classification. Hum Brain Mapp 2016; 37: 1920–1929.
- De Bruijn RFAG, Akoudada S, Cremers LGM, et al. Determinants, MRI correlates, and prognosis of mild cognitive impairment: The Rotterdam study. J Alzheimer’s Dis 2014; 42: S239–S249.
- Ashburner J, Friston KJ. Unified segmentation. Neuroimage 2005; 26: 839–851.
- Smith SM, Jenkinson M, Johansen-Berg H, et al. Tract-based spatial statistics: voxelwise analysis of multi-subject diffusion data. Neuroimage 2006; 31: 1487–1505.
- Zou H, Hastie T. Regularization and variable selection via the elastic net. J R Stat Soc Ser B (Statistical Methodol 2005; 67: 301–320.
- Noirhomme Q, Lesenfants D, Gomez F, et al. Biased binomial assessment of cross-validated estimation of classification accuracies illustrated in diagnosis predictions. NeuroImage Clin 2014; 4: 687–694.
- Arbabshirani MR, Plis S, Sui J, Calhoun VD. Single subject prediction of brain disorders in neuroimaging: Promises and pitfalls. Neuroimage. 2016; 145: 137–165.
- Haller S, Missonnier P, Herrmann FR, et al. Individual classification of mild cognitive impairment
subtypes by support vector machine analysis of white matter DTI. Am J
Neuroradiol 2013; 34: 283–291.
Figures