2014
Quantitative vascular measurements in APOE-ε4 knock-in female rats before the onset of AD1Massachusetts General Hospital and Harvard Medical School, Boston, MA, United States, 2Center for Translational Neuroimaging (CTNI), Northeastern University, Boston, MA, United States, 3Nanomedicine Science and Technology Center, Northeastern University, Boston, MA, United States
Synopsis
There is an increasing body of evidence that suggests vascular dysfunction may play an important role in Alzheimer’s Disease (AD)1. Hyperperfusion has been shown to be associated with mild cognitive impairment (MCI) and hypoperfusion with the onset of AD, along with neurodegeneration2,3. In this study we utilized a novel imaging modality, QUTE-CE MRI4,5, to study the micro- and macro- vascular abnormalities in a APOE-ε4 knock-in model, since the APOE-ε4 allele is the single most important genetic risk factor for AD. While our 173-region characterization reveals both hyper- and hyop-vascularization, the changes in microvascularity are almost entirely hypervascular.
PURPOSE
Over five million individuals in the United States suffer from AD, and by 2050 this number will rise to nearly 16 million Americans, placing a tremendous strain on the country’s healthcare system6. The exact biochemical mechanisms underpinning AD are yet unsolved, no biomarker exists for early screening, and there is no effective treatment7. Thus, there exists a compelling need to develop quantitative and reliable physiological biomarkers for diagnostics, prognosis and testing drug efficacy. Here we show the feasibility of QUTE-CE MRI to detect vascular abnormalities in an APOE-ε4 rat model of AD.METHODS
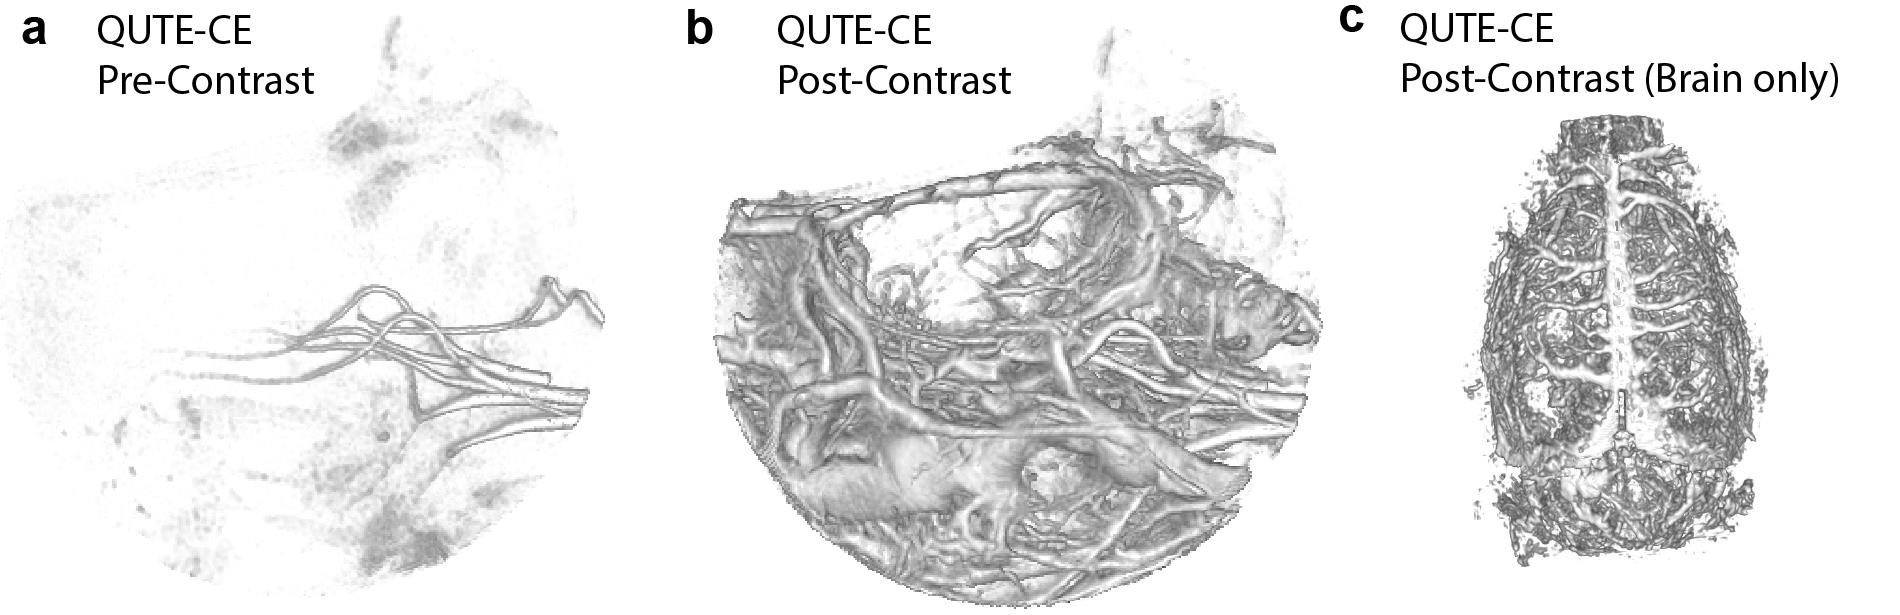
Quantitative Ultrashort Time-to-Echo Contrast-Enhanced (QUTE-CE) MRI is a method that utilizes a 3D UTE pulse sequence and an intra-vascular contrast agent to render high CNR vascular images with quantitative signal8 (Figure 1). At this ultrashort TE, contrast is inverted from the typical negative-contrast obtained from superparamagnetic iron-oxide nanoparticles (SPIONs) to purely T1-enhanced positive-contrast. We have previously shown that quantitative measurements of the micro- and macro-vasculature can be mapped throughout the whole rat brain, and that functional changes of state can also be measured5. The absolute cerebral blood volume (qCBV) is calculated by simple partial volume calculations using a two-compartment model for signal from blood and tissue: $$I_{m}=f_{B}I_{B} + (1-f_{B})I_{T}$$Where, $$$I_{m}$$$ is the measured signal intensity at each voxel,$$$I_{T}$$$ is the tissue intensity, $$$I_{B}$$$ is the blood intensity and $$$f_{B}$$$ is the fraction of the voxel occupied by blood. qCBV is calculated voxel-wise by subtracting a pre-contrast intensity from post-contrast after catheter injection of ferumoxytol (Feraheme, AMAG Pharmaceuticals, Waltham, Massachusetts, USA, 7mg/kg). Solving for the blood volume fraction,$$qCBV = f_{B} = \frac{I_{M}'-I_{M}}{I_{B}'-I_{B}} $$$$$I_{B}$$$ measured in the voxels containing blood only, taken from the superior sagittal sinus, per image. Images are then fit to a 173 anatomic region atlas for segmented analyses using anatomical scans. The mean qCBV is reported per region, and the mode is taken as a proxy for microvessel density.All animal experiments were conducted in accordance with institutional IACUC approved protocols. QUTE-CE measurements were made on 5 wild-type (WT) and 6 APOE-ε4 knock-in female rats of 7 months of age showing signs of mild cognitive impairment (MCI).RESULTS
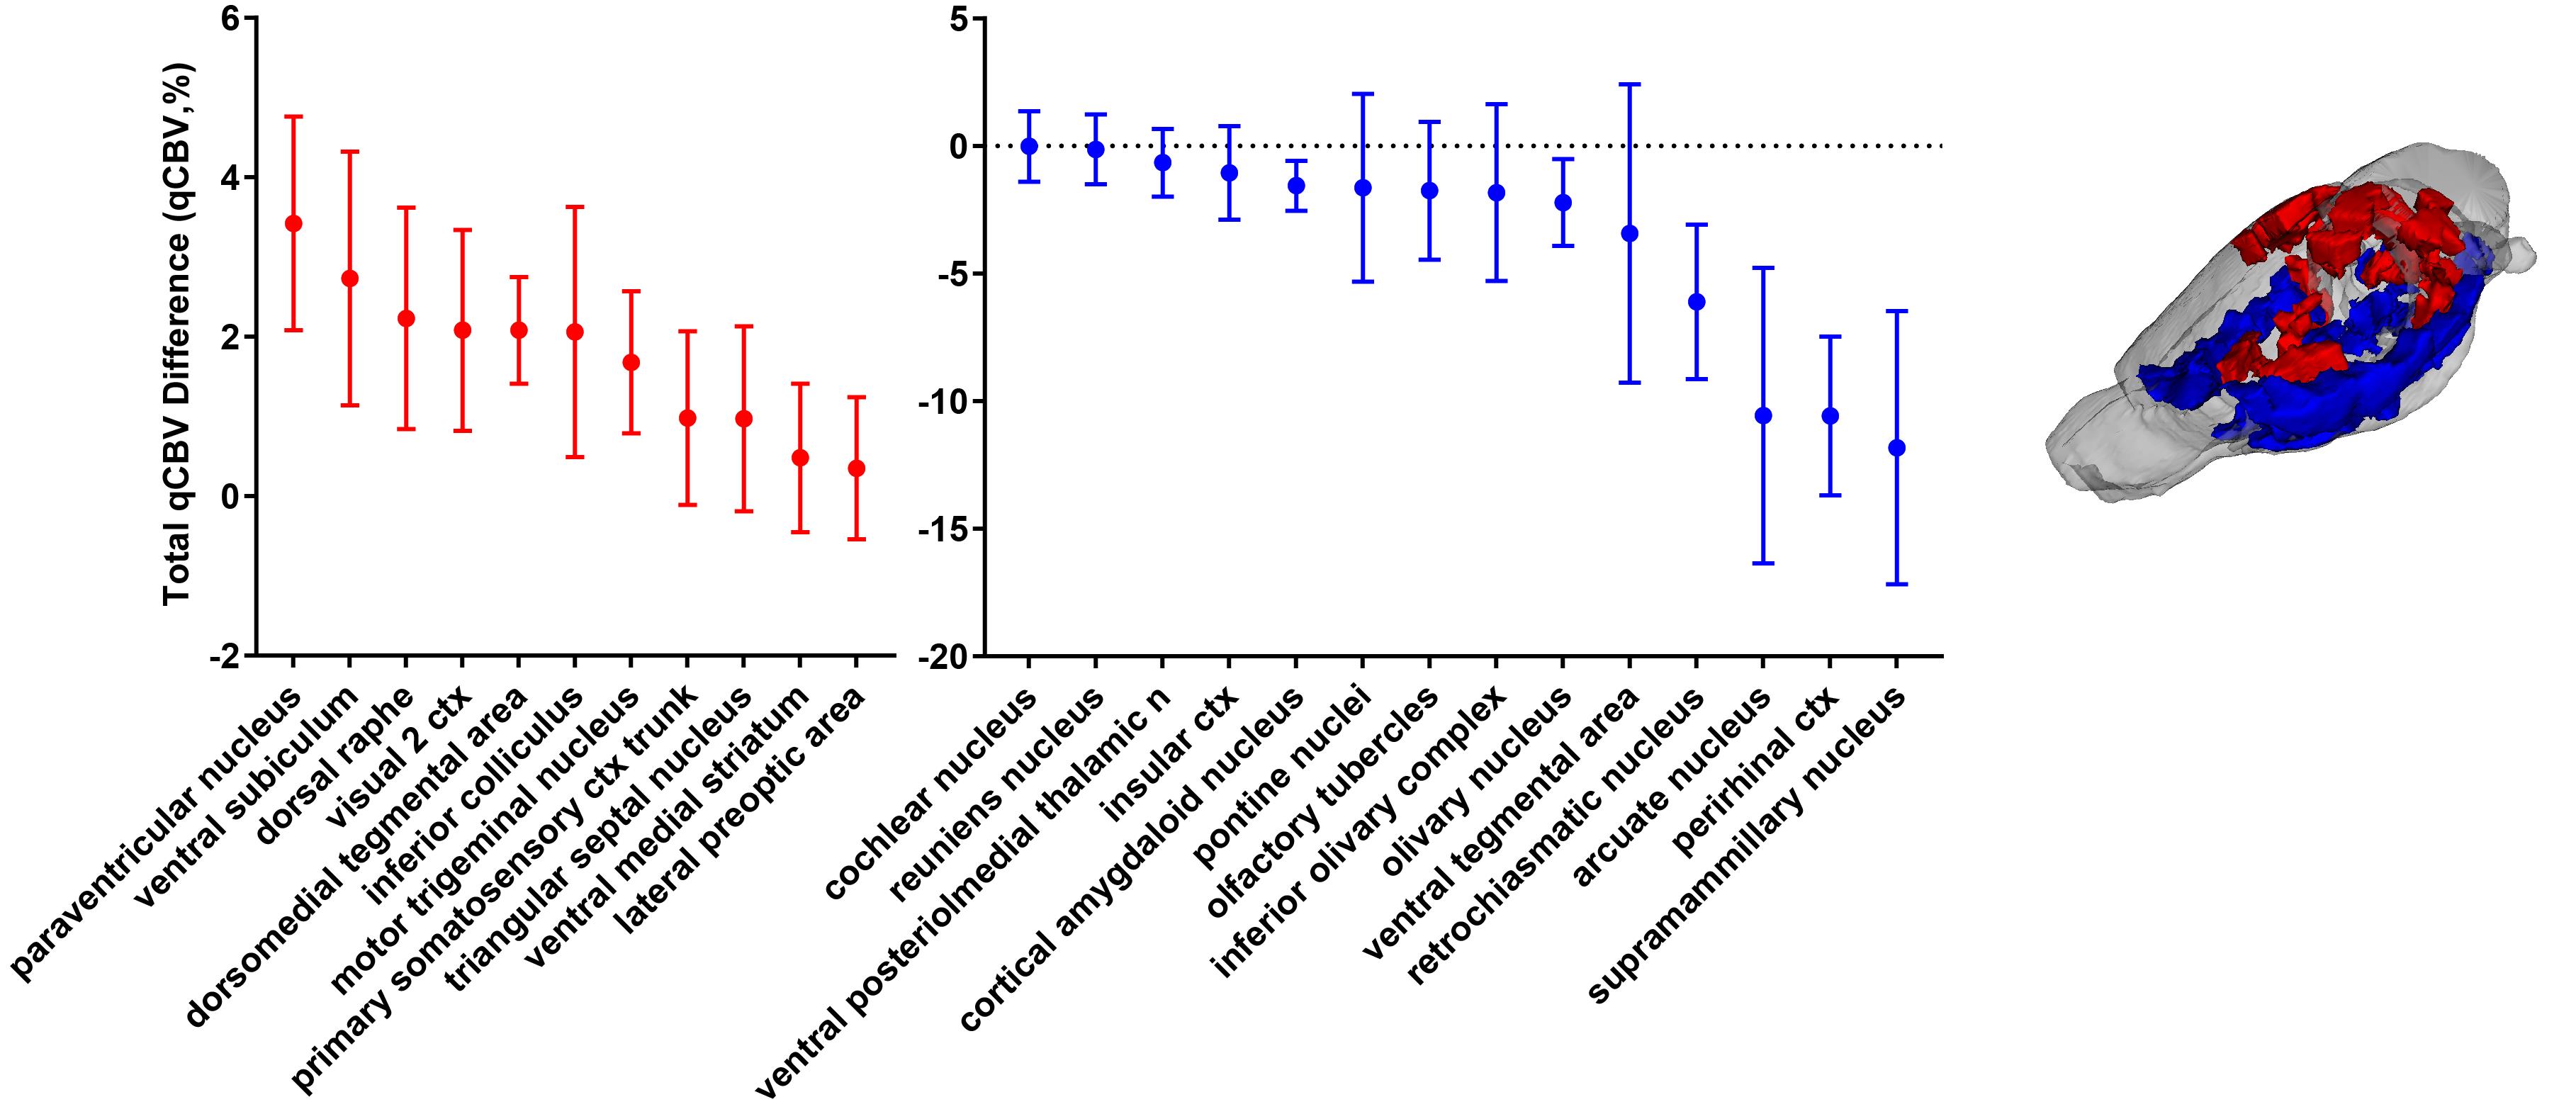
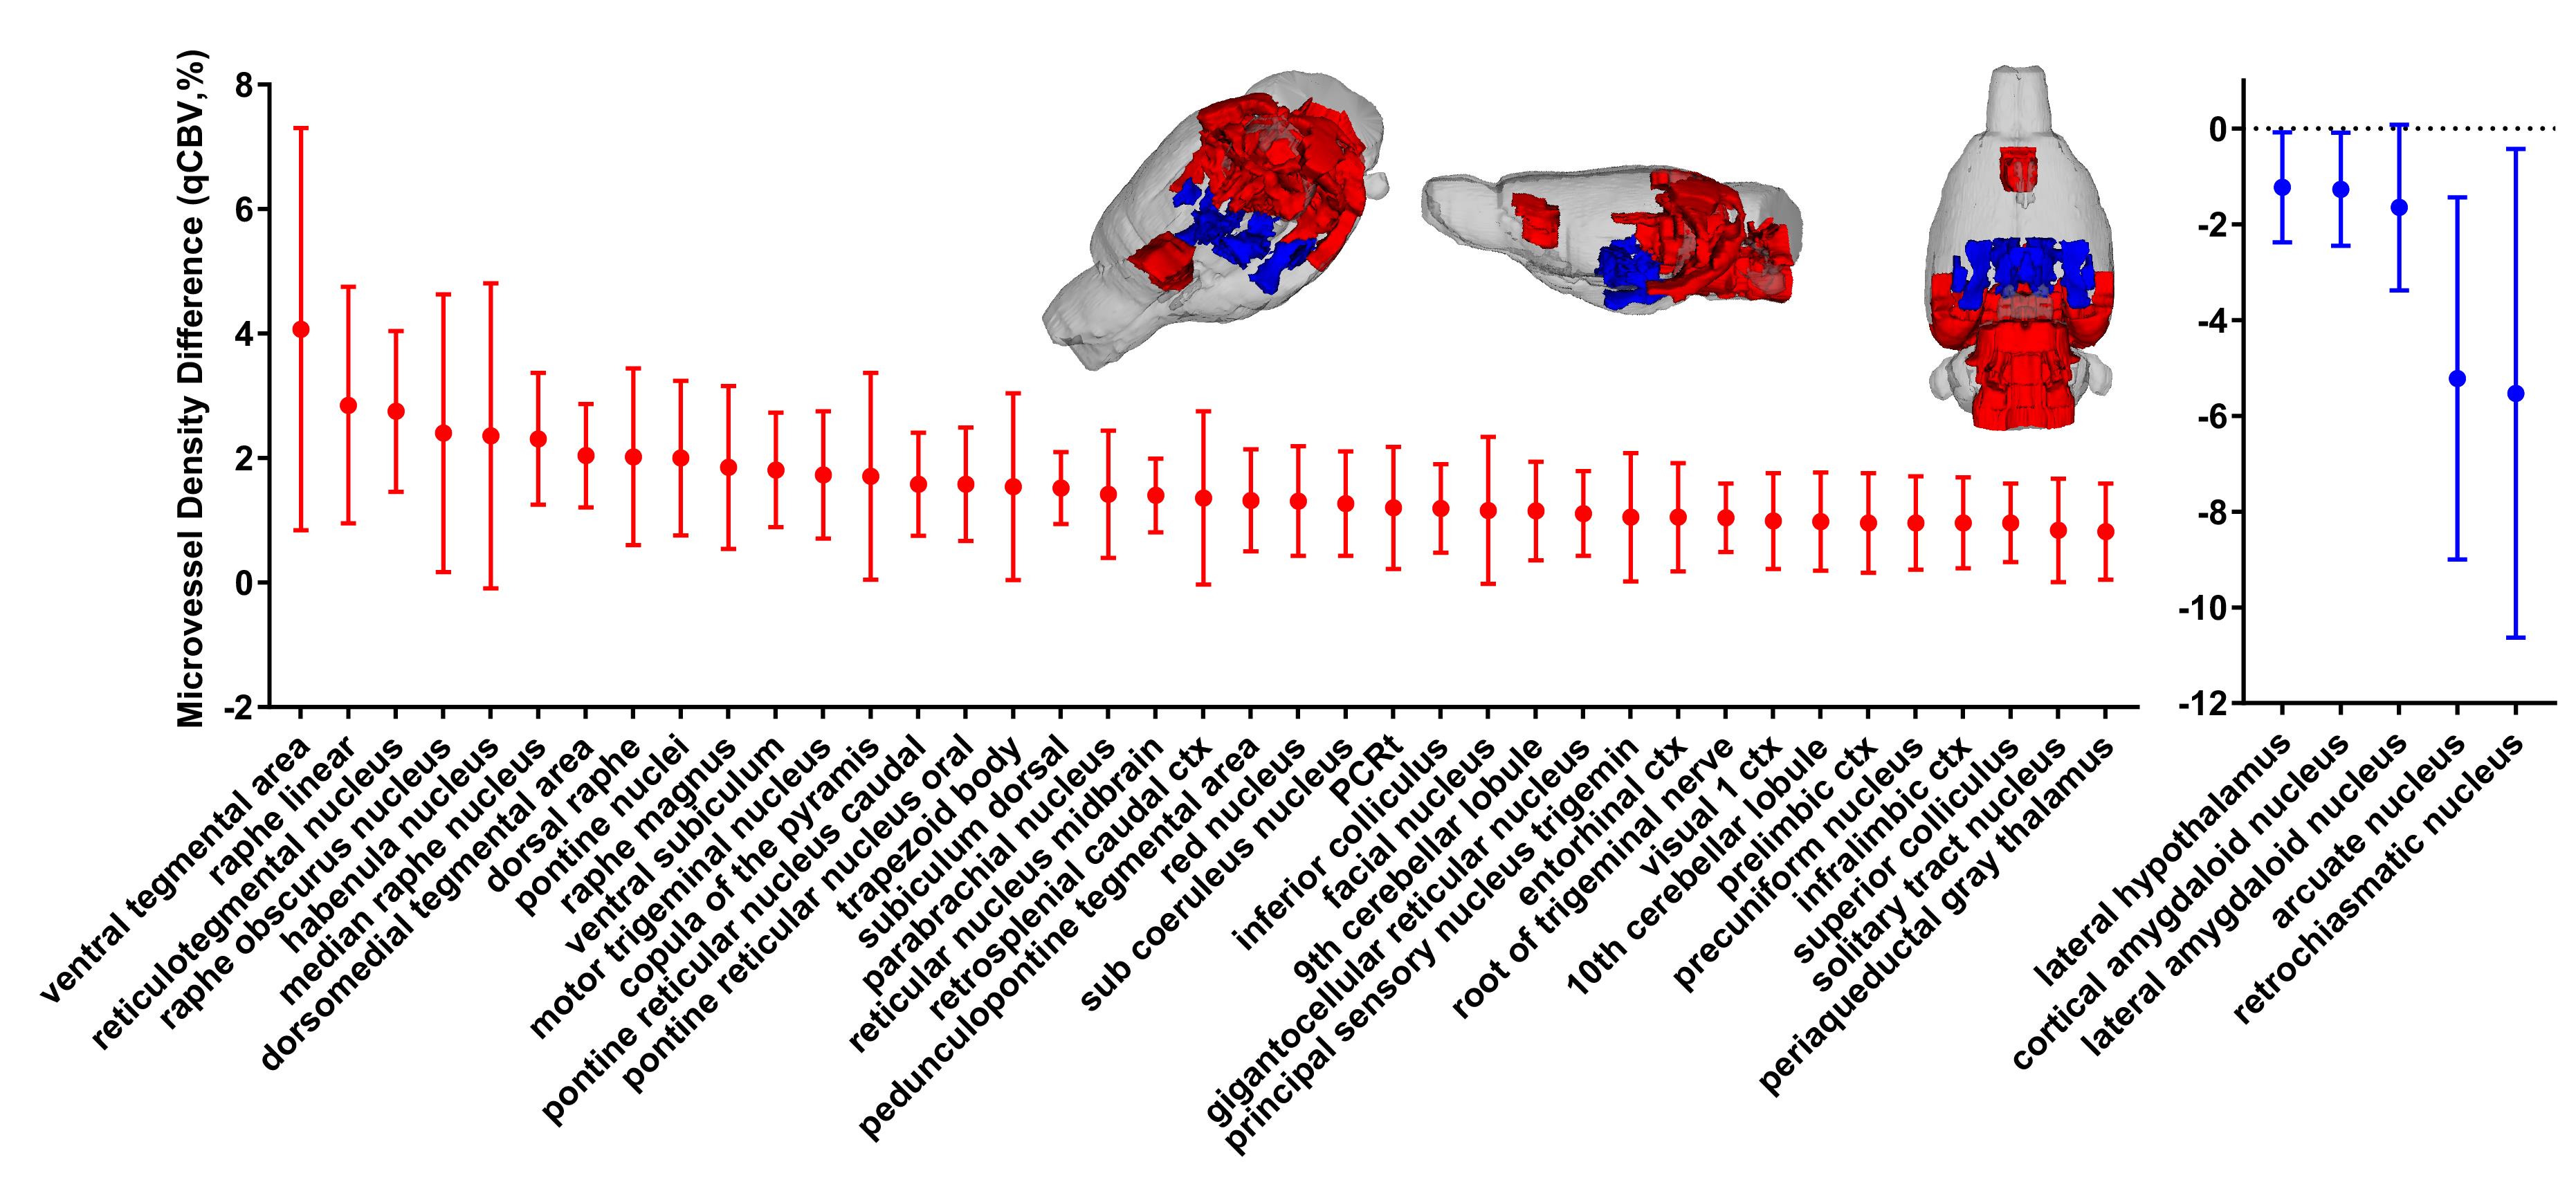
The mean qCBV showed a mix of about half hyper- and half hypo-vascularized regions (18 of 41 for p<0.05, or 11/25 for p<0.01) for APOE-ε4 knock-in females compared to WT (Figure 2). Microvasculature, however, revealed almost complete hypervascularization in abnormal regions (39 of 44 regions, p<0.05, Figure 3). Ten of these regions were among the twenty-three that demonstrated statistically significant increased regional anatomical size for APOE-ε4 females (brain size results in Praveen Kulkarni abstract).
DISCUSSION
It was originally hypothesized that the brain is hypo-vasculraized in AD, however theories now offer an alternative hypothesis supporting data that hypervascularization occurs in MCI before degeneration occurs. The data here supports that hypothesis.
CONCLUSION
We have demonstrated the feasibility of using qCBV from QUTE-CE MRI as a quantitative biomarker in an AD animal model.Acknowledgements
This work was supported in part by funding by NIH T32EB013180 (GEF).References
1. Zlokovic, B. V. Neurovascular pathways to neurodegeneration in Alzheimer’s disease and other disorders. Nat. Rev. Neurosci. (2011). doi:10.1038/nrn3114 2. Kim, S. M. et al. Regional cerebral perfusion in patients with Alzheimer’s disease and mild cognitive impairment: effect of APOE epsilon4 allele. Neuroradiology 55, 25–34 (2013). 3. Chen, C.-C. V, Chen, Y.-C., Hsiao, H.-Y., Chang, C. & Chern, Y. Neurovascular abnormalities in brain disorders: highlights with angiogenesis and magnetic resonance imaging studies. J. Biomed. Sci. 20, 47 (2013). 4. Gharagouzloo, C. A., McMahon, P. N. & Sridhar, S. Quantitative contrast-enhanced MRI with superparamagnetic nanoparticles using ultrashort time-to-echo pulse sequences. Magn. Reson. Med. 0, 1–11 (2014). 5. Gharagouzloo, C. A. et al. Quantitative vascular neuroimaging of the rat brain using superparamagnetic nanoparticles: New insights on vascular organization and brain function. Neuroimage (2017). doi:10.1016/j.neuroimage.2017.09.003 6. Alzheimer’s Association. Alzheimer’s disease facts and figures. Alzheimer’s Dement. 9, 110 –133. (2013). 7. Huang, Y. & Mucke, L. Alzheimer mechanisms and therapeutic strategies. Cell 148, 1204–1222 (2012). 8. Gharagouzloo, C. A., Mcmahon, P. N. & Sridhar, S. Quantitative contrast-enhanced MRI with superparamagnetic nanoparticles using ultrashort time-to-echo pulse sequences. Magnetic Resonance in Medicine (2014). doi:10.1002/mrm.25426Figures