2012
MR Spectroscopy in a Transgenic Rat Model of Alzheimer’s Disease1Physical Sciences Platform, Sunnybrook Research Institute, Toronto, ON, Canada, 2Medical Biophysics, University of Toronto, Toronto, ON, Canada, 3Neurosurgery and Pediatric Neurosurgery, Medical University of Lublin, Lublin, Poland, 4Biological Sciences Platform, Sunnybrook Research Institute, Toronto, ON, Canada, 5Department of Laboratory Medicine and Pathobiology, University of Toronto, Toronto, ON, Canada
Synopsis
The transgenic rat model of Alzheimer’s Disease (AD), TgF344-AD rats, manifests a more complete spectrum of age-dependent AD pathologies in conjunction with cognitive disturbance. Importantly, TgF344-AD rats exhibit amyloid and tau pathology as well as frank neuronal loss with aging. This study investigates brain metabolic changes, using magnetic resonance spectroscopy, in older TgF344-AD animals relative to younger and to non-transgenic littermate rats. Our data shows a statistically significant decrease in phosphocreatine, glutamate, and taurine, and a trend towards decreased NAA (p=0.053) in comparison to the combined younger and non-transgenic littermate rats.
Introduction
The transgenic rat model of Alzheimer’s Disease (AD), TgF344-AD rats, manifests a more complete spectrum of age-dependent AD pathologies in conjunction with cognitive disturbance1, which is an improvement over many of the existing rodent models of AD. Importantly, TgF344-AD rats exhibit amyloid and tau pathology as well as frank neuronal loss with aging. This study investigates brain metabolic changes, using magnetic resonance spectroscopy (MRS), in older TgF344-AD animals relative to younger and to non-transgenic littermate rats. This work was conducted at 7T which improves the separation of signals from different metabolites relative to that available from most human studies of AD which are typically conducted at 1.5 or 3T. This metabolic information can improve our interpretation of the human MRS results, suggest treatment targets for AD therapy, and motivate human studies at high field.Methods
Both male and female TgF344-AD rats (Tg) on the Fisher 344 background, overexpressing APPSW and Δ exon 9 mutant human presenilin-1 (PS1ΔE9) under the mouse prion protein promoter1 were used. Non-transgenic littermates (nTg) were used as controls. Young (aged 5-7 months, 3 Tg, 1 nTg) and old rats (15-19 months, 2 Tg, 2 nTg) were scanned using a 7T Bruker BioSpec MRI. MRS data was acquired in the hippocampus (Figure 1) using a PRESS sequence with TE 16ms, TR 2.5s, 725 averages, a spectral width of 3005 Hz, RF bandwidth of 5400Hz, and 4096 data points.
Data was analyzed using LCModel (Stephen Provencher Inc., Oakville, Ontario, Canada)2. The unsuppressed water signal recorded from each voxel was used as an internal reference for water scaling in LCModel, assuming the concentration of water to be 43.3 M in grey matter3,4. Metabolites with Cramer-Rao lower bounds greater than 20% were selected for analysis, and t-tests with α=0.05 were used to assess statistical significance of between-group differences.
Results
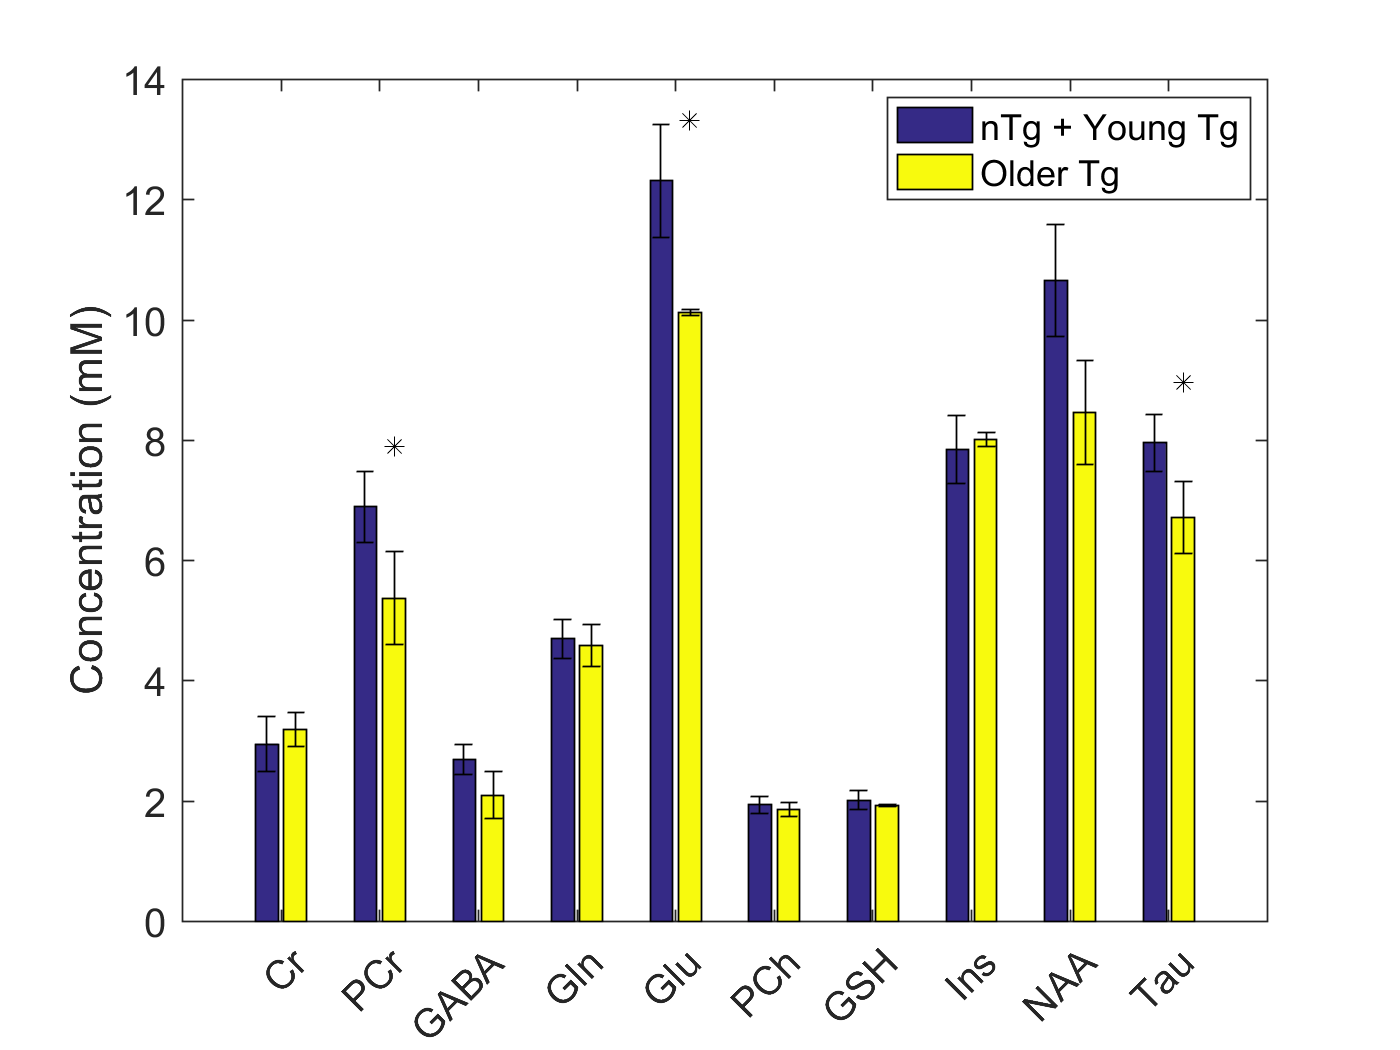
No statistical differences were observed between young nTg, young Tg, and older nTg, thus these three cohorts were combined and compared to the older Tg cohort. The differences between these two groups for creatine (Cr), phosphocreatine (PCr), gamma-aminobutyric-acid (GABA), glutamine (Gln), glutamate (Glu), phosphocholine (PCh), glutathione (GSH), myo-inositol (Ins), N-acetylaspartate (NAA), and taurine (Tau) are presented in Figure 2. Statistically significant decreases were observed in the older Tg group for PCr, Glu, and Tau in comparison to the combined young nTg, Tg and older nTg group.Discussion
Our data shows a statistically significant decrease in PCr, Glu, and Tau, and a trend towards decreased NAA (p=0.053).
Comparing our results with those from other animal studies conducted at high field, there are many similarities in the neurochemical profile. A rat AD model involving intracerebro-ventricular injection of the bacterial toxin streptozotocin to model insulin resistance seen in AD patients5, showed decreases in PCr, Glu, Tau, and NAA, similar to our study, but also showed decreases in GSH, PCh. Mouse models of AD also demonstrate decreased NAA and Glu, however some also show increased Tau or Ins6. One caveat to the comparison between different models of AD, is the variability in presentation of AD-like pathologies.
Human studies of AD are typically conducted at lower field (1.5-3T) where metabolite quantification is more difficult, and thus ratios of metabolites with total creatine (TCr = Cr + PCr) are used. Such studies have described decreases in both NAA/TCr and Glu/TCr as well as increases in PCh/TCr7–9. Our data also shows a significant decrease in Glu, and a trend towards decreased NAA (p=0.053). We did not detect an increase in PCh, however we did detect a significant decrease in PCr which would result in an increased PCh/TCr ratio. Most recently, focal deposits of Cr have been discovered in AD, suggestive of a perturbed energetic status and deregulated Cr synthesis and/or uptake10. These findings in conjunction with our results suggest that using Cr ratios to quantify metabolites in AD is problematic.
Conclusion
The metabolite profile observed in this model of AD replicates the decreases in Glu and NAA reported in human MRS studies of AD, and suggests that the increased PCh/TCr is due to decreased PCr rather than increased PCh.Acknowledgements
No acknowledgement found.References
1. Cohen RM, Rezai-Zadeh K, Weitz TM, et al. A Transgenic Alzheimer Rat with Plaques, Tau Pathology, Behavioral Impairment, Oligomeric A-Beta, and Frank Neuronal Loss. J Neurosci. 2013;33(15):6245-6256.
2. Provencher SW. Estimation of metabolite concentrations from localized in vivo proton NMR spectra. Magn Reson Med. 1993;30(6):672-679.
3. Tkac I, Rao R, Georgieff MK, Gruetter R. Developmental and regional changes in the neurochemical profile of the rat brain determined by in vivo 1H NMR spectroscopy. Magn Reson Med. 2003;50(1):24-32.
4. De Souza S, Dobbing W. Cerebral edema in developing brain. I. Normal water and cation content in developing rat brain and postmortem changes. Exp Neurol. 1971;32(3):431-438.
5. Labak M, Foniok T, Kirk D, et al. Metabolic Changes in Rat Brain Following Intracerebroventricular Injections of Streptozotocin : A Model of Sporadic Alzheimer ’ s Disease. 2010;106:3-7.
6. Choi J, Dedeoglu A, Jenkins B. Application of MRS to mouse models of neurodegenerative illness. NMR Biomed. 2007:216-237.
7. Hattori N, Abe CAK, Sakoda S, Sawada T. Proton MR spectroscopic study at 3 Tesla on glutamate / glutamine in Alzheimer’s disease. 2002;13(1):7-10.
8. Fayed N, Modrego PJ, Rojas-salinas G, Aguilar K. Brain Glutamate Levels Are Decreased in Alzheimer ’ s Disease : A Magnetic Resonance Spectroscopy Study. 2011;26(6):450-456.
9. Kantarci K, Weigand SD, Petersen RC, et al. Longitudinal 1H MRS changes in mild cognitive impairment and Alzheimer’s disease. Neurobiol Aging. 2007;28(9):1330-1339.
10. Burklen TS, Schlattner U, Homayouni R, et al. The Creatine Kinase/Creatine Connection to Alzheimer’s Disease: CK Inactivation, APP-CK Complexes, and Focal Creatine Deposits. J Biomed Biotechnol. 2006;2006:1-11.
Figures