2011
Effect of Antiepileptic Treatment on Hippocampal Activity in Alzheimer’s Disease measured by ASL1Computer Science, State University of New York at Binghamton, Binghamton, NY, United States, 2Department of Radiology, Beth Israel Deaconess Medical Center and Harvard Medical School, Boston, MA, United States, 3Department of Neurology, Beth Israel Deaconess Medical Center and Harvard Medical School, Boston, MA, United States
Synopsis
Increased hippocampal perfusion in early AD has been reported, but the underlying mechanism is still not clear. We hypothesized that epileptiform activity occurs in the hippocampus with AD and causes increased perfusion. Here, we designed a placebo-controlled study using an antiepileptic drug, Levetiracetam to modulate epileptic activity of the hippocampus. Nine subjects with AD were scanned following drug or placebo. We observed decreased perfusion and increased perfusion fluctuation in entorhinal cortex with Levetiracetam. These findings support the potential epileptic activity effects of entorhinal cortex in AD. Due to neighboring locations of hippocampus and entorhinal cortex, further work will probe the effects of potential misregistration.
Introduction
Increased hippocampal perfusion has been reported in early AD (1,2,3). Recent evidence from animal studies has raised the intriguing possibility that epilepsy plays a more central role in the pathophysiology of AD. Epileptic activity directly damages the hippocampus via hypoxia and ischemia (4). Ischemia in turn increases amyloid deposition (5). Our hypothesis is that similar epileptiform activity and seizures occurs in the hippocampus of humans with AD and that suppression of epileptiform activity will improve memory deficits. If increased hippocampal perfusion in AD is caused by epileptiform activity, then an antiepileptic drug, Levetiracetam, should lead to decreased rCBF in the hippocampus.Methods
Nine AD subjects were imaged on a GE 3 Tesla scanner using an 8-channel head coil receive array. Each subject received 3 study drug regimens at 3 different days. The 3 drug regimens were Placebo, Low dose levetiracetam (2.5 mg/kg), High dose levetiracetam (7.5mg/kg). After drug administration, Resting-state pseudo-continuous arterial spin labeling (PCASL) (6) acquisitions with 40 3D ASL images were performed. Each PCASL image was acquired with a 3D stack of spirals RARE sequence. ASL perfusion image time series were head-motion corrected and normalized to the standard template space using SPM8. The ASL time course data from each subject was represented by a 4D matrix with dimension of 79956839. The 3D ASL data from the first time point was removed to reduce the instability. The ASL time course data from all 27 scans (9 subjects and each subject with 3 drug regimens) are concatenated by stacking the 4D matrix of each subject on top of each other. The single-session independent component analysis (ICA) was applied to the ASL time course data from all 27 scans using MELODIC (Multivariate Exploratory Linear Decomposition into Independence components, part of FSL, www.fmrib.ox.ac.uk/fsl) for extracting the resting state networks. No high-pass filter was applied to the ASL data. Single-session ICA was used because multi-session temporal concatenation ICA automatically applies dimension reduction on the temporal/subject dimension and therefore it is difficult to analyze the difference for the time courses of each independent component (IC). The ICA of the ASL data resulted in time courses of each IC for each scan, corresponding to each subject with a drug regimen. The time-course average and standard deviation were calculated to represent mean perfusion and perfusion fluctuation for each subject with a drug regimen and each IC. Nonparametric paired tests were used to compare the difference of perfusion and perfusion fluctuations between placebo and low-dose levetiracetam, between placebo and high-dose levetiracetam, between low-dose and high-dose levetiracetam. The significant p-value threshold was set as 0.05.Results and Discussion
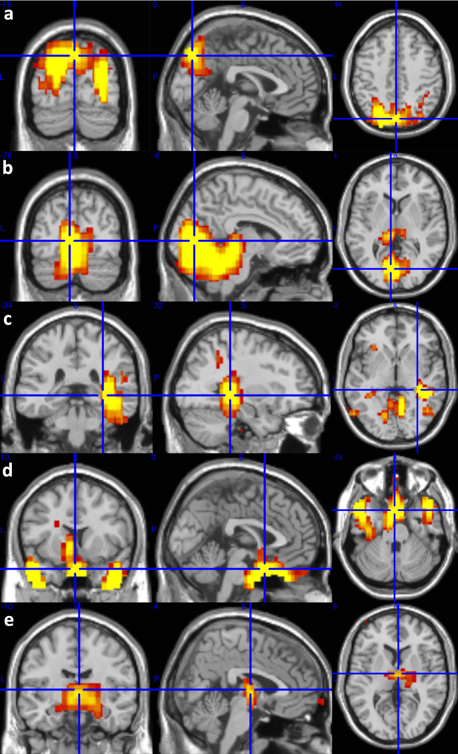
We observed significant perfusion decrease in the parietal (p = 0.0078, Fig. 1a), occipital and cerebellum (p = 0.0195, Fig. 1b), and right entorhinal and posterior cingulate regions (p = 0.0195, Fig. 1c) for low-dose levetiracetam compared to placebo. We also observed perfusion increase in the parahippocampus and amygdala (p = 0.0039, Fig. 1d), and thalamus regions (p = 0.0078, Fig. 1e) for low dose/high dose levetiracetam compared to placebo. Increased perfusion fluctuation was observed in the parietal, cerebellum, thalamus, insular, and anterior region of default mode network (DMN) (p < 0.027) for low-dose levetiracetam compared to placebo. Increased perfusion fluctuation was also observed in the posterior lateral regions of DMN, posterior medial region of DMN, occipital and cerebellum, parietal, thalamus, insular, right entorhinal and posterior cingulate, and parahippocampus and amygdala regions (p < 0.039) for high-dose levetiracetam compared to placebo. Increased perfusion fluctuation was further observed in the right entorhinal and posterior cingulate regions for high-dose levetiracetam compared to low-dose levetiracetam (p = 0.019). Perfusion fluctuation in the the right entorhinal and posterior cingulate regions with low-dose levetiracetam does not show significant difference from that with placebo, but increases significantly with high-dose levetiracetam. Our results demonstrate decreased perfusion and increased perfusion fluctuation in entorhinal cortex with levetiracetam. These findings indicate the potential epileptic activity effects of entorhinal cortex in AD. Due to neighboring locations of hippocampus and entorhinal cortex, further work will probe the effects of potential misregistration.Acknowledgements
No acknowledgement found.References
1. Alsop et al, Neuroimage 2008;42:1267-1274. 2. Dai et al, Radiology 2009;250:856-866. 3. Fleisher et al, Neurobiol Aging 2009;30:1737-1748. 4. Thom et al, J Neuropathol Exp Neurol 2009;68:928-938. 5. Guglielmotto et al, J Neurochem 2009;108:1045-1056. 6. Dai et al, Magn Reson Med 2008;60(6):1488-97.Figures